Abstract
Background
Cholangiocarcinoma (CCA) is a relatively rare cancer worldwide; however, its incidence is extremely high in Asia. Numerous studies reported that serum carbohydrate antigen 19-9 (CA19-9) plays a role in the diagnosis of CCA patients. However, published data are inconclusive. The aim of this meta-analysis was to provide a systematic review of the diagnostic performance of CA19-9 for CCA.
Material/Methods
We searched the public databases including PubMed, Web of Science, Embase, Chinese National Knowledge Infrastructure (CNKI), and WANFANG databases for articles evaluating the diagnostic accuracy of serum CA19-9 to predict CCA. The diagnostic sensitivity (SEN), specificity (SPE), positive likelihood ratio (PLR), negative likelihood ratio (NLR), diagnostic odds ratio (DOR), and summary receiver operating characteristic curve (SROC) were pooled by Meta-DiSc 1.4 software.
Results
A total of 31 articles met the inclusion criteria, including 1,264 patients and 2,039 controls. The pooled SEN, SPE, PLR, NLR, and DOR were 0.72 (95% CI: 0.70–0.75), 0.84 (95% CI: 0.82–0.85), 4.93 (95% CI, 3.67–6.64), 0.35 (95%CI, 0.30–0.41), and 15.10 (95% CI, 10.70–21.32), respectively. The area under SROC curve was 0.8300. The subgroup analyses based on different control type, geographical location, and sample size revealed that the diagnostic accuracy of CA19-9 tends to be same in different control type, but showed low sensitivity in European patients and small size group.
Conclusions
Serum CA19-9 is a useful non-invasive biomarker for CCA detection and may become a clinically useful tool to identify high-risk patients.
MeSH Keywords: CA-19-9 Antigen, Cholangiocarcinoma, Diagnosis, Review
Background
Cholangiocarcinoma (CCA), tumor that arises from the epithelial cells of the bile duct, is a relatively rare cancer worldwide; however, its incidence is extremely high in Asia [1]. Over the past three decades, the incidence of CCA appears to be increasing, and accounts for approximately 3% of all gastrointestinal carcinomas in Western countries [2]. The percentage of patients who survive 5 years after diagnosis has not increased during this time period, remaining at 10% [3]. CCA is notoriously difficult to diagnose owing to its nonspecific symptoms, the low sensitivity and specificity of most diagnostic modalities, and the lack of absolute diagnostic criteria. Therefore, timely diagnosis of CCA is sometimes a challenging task for clinicians.
MRI and CT with endoscopic ultrasound and PET provide useful diagnostic information in certain patients. However, tumor biomarkers provide significant help in the diagnosis and are increasingly attractive because of their noninvasive features and relative inexpensiveness. To date, the most studied and the most used tumor markers in clinical practice are carbohydrate antigen 19-9 (CA 19-9) and carcinoembryonic antigen (CEA) [4]. Data suggests that the estimated sensitivity of CA 19-9 in predicting CCA in the context of primary sclerosing cholangitis is 38–89%, and a specificity is 50–98% [5]. CA19-9 level can be normal in patients with localized diseases, and high CA19-9 levels can also occur in benign bile duct diseases, including cholangitis, calculus of bile duct, and nonmalignant jaundice [6,7]. Therefore, there is insufficient evidence to confirm the diagnostic accuracy of CA19-9 in CCA.
To address this issue, we conducted a meta-analysis of all eligible studies to evaluate the role of CA19-9 in CCA diagnostic accuracy, and to find if CA19-9 could be a potential marker for detecting CCA, anticipating providing an evidence base for medicine.
Material and Methods
Search strategy and inclusion criteria
Comprehensive databases have been used to identify the relevant studies published up to February, 2015. Databases include PubMed, Web of Science, Embase, Chinese National Knowledge Infrastructure (CNKI), and WANFANG databases. The following search terms were employed: “cholangiocarcinoma”, “cholangiocellular”, “gastrointestinal carcinoma”; “carbohydrate antigen 19-9”, CA19-9; “blood”, “serum”, “circulating”; “diagnosis”; and “sensitivity and specificity” were used individually and in various pairwise combinations. All eligible studies were retrieved, and their bibliographies were checked for other relevant publications.
All eligible studies satisfying the following criteria were firstly included in our analysis: (1) CA19-9 was assessed in CCA diagnostic studies; (2) Patients were referred to confirmed CCA; (3) sensitivity (SEN) and specificity (SPE) of CA19-9 were reported to provide sufficient information to construct two×two contingency tables, or sufficiently detailed data were presented to derive these numbers. Exclusion criteria were as follows: (1) incomplete data to construct 2×2 contingency tables; (2) duplicate studies; and (3) reviews, letters and comments.
Data extraction and Quality assessment
Two reviewers (Liang and Zhong) reviewed and extracted the data from each eligible study independently. The following data were collected for each eligible study: Author’s name, publication year, country, number of cases and controls, controls source, test method, sensitivity and specificity data, cut-off value. We assessed the methodological quality of the eligible studies for risk of bias and applicability using Quality Assessment of Diagnostic Accuracy Studies (QUADAS-2) criteria. Any disagreement was resolved by consensus.
Statistical analyses
Data were analyzed using STATA 12.0 software (Stata Corporation, College Station, TX) and Meta-Disc 1.4 software (XI Cochrane Colloquium, Barcelona, Spain). We extracted the numbers of all subjects with true positive (TP), true negative (TN), false positive (FP), and false negative (FN) from each included study, and the pooled SEN, SPE, positive likelihood ratio (PLR), negative likelihood ratio (NLR), diagnostic odds ratio (DOR), and area under the summary receiver operating characteristic curve (SROC) were analyzed using the bivariate meta-analysis model [8]. An examination of the potential sources of heterogeneity is indispensable for any meta-analysis before pooling the data from the included studies into summary assessments. We used a Spearman correlation analysis to quantify the heterogeneity due to the threshold effect among the included studies. Moreover, the Cochran-Q test and the inconsistency index (I2) test were used to assess the non-threshold effect. When the result of the Q-test and I2 statistics suggested heterogeneity (P≤0.05 and I2>50%), a random-effects model (DerSimonian-Laird method) was used; otherwise, a fixed-effects model (Mantel-Haenszel method) was adopted. The Deeks funnel plots was applied to assess the potential publication bias among studies [9], and P<0.05 was considered to be representative of a significant statistical publication bias.
Results
Literature search
Flow chart for study selection was shown in Figure 1. In this study, we found 31 studies eligible for meta-analysis and the clinical characteristics were shown in Table 1 [10–40]. The 31 eligible studies included 1,264 patients of confirmed CCA and 2,039 controls. Of 31 studies, 19 studies were conducted in Asian countries [10,11,14–22,24–26,31–33,40], 7 studies in American countries [23,30,29,34–36,39], and 5 studies in European counties [12,13,27,37,38]. The characteristics of the control groups varied among the 31 articles. Eight studies used PSC patients as a control group [23,29,30 34,36–39], and the other studies used a mix of healthy volunteers and patients with other diseases [10–22,24–28,31–33,35,40]. Among the 31 studies, 20 studies were small-size sample (<100), and 11 studies were large-size sample (≥100). All studies were published from 1991 to 2015, and the sample sizes ranged from 22 to 320 subjects.
Figure 1.
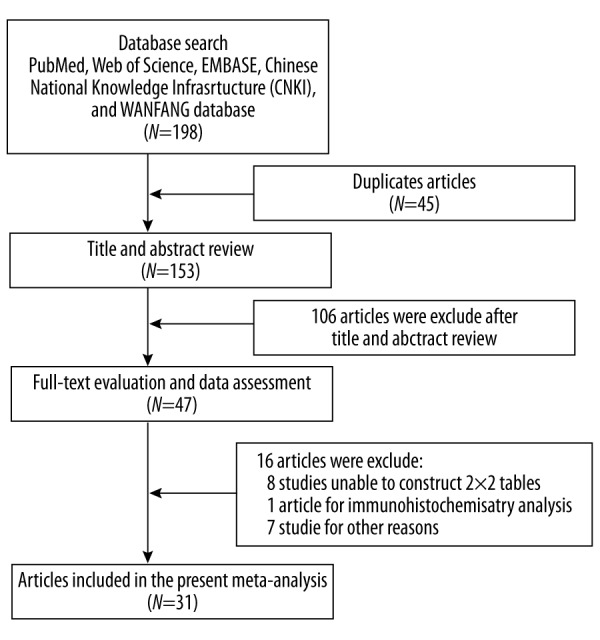
Flow chart of study selection process.
Table 1.
The characteristics of 31 eligible studies.
| Author | Year | Country | Case/controls | Control type | Test method | Cut-off values | SEN/SPE |
|---|---|---|---|---|---|---|---|
| Li Y | 2015 | China | 30/30 | HCC patients | CLIA | 125.07 U/mL | 76.67%/80.00 |
| Wang S | 2015 | China | 15/15 | Normal controls | NA | 28.915 ng/mL | 66.7%/100% |
| Lumachi F | 2014 | Italy | 24/25 | Benign liver disease | CLIA | 37 U/mL | 74.1%/84.8% |
| Voigtländer T | 2014 | Germany | 49/48 | PSC, BDS | NA | 130 U/mL | 53%/82% |
| Kraiklang R | 2014 | Thailand | 40/26 | HCC, chronic biliary-liver disease | NA | 100 U/mL | 44.4%/100% |
| Ma H | 2012 | China | 54/42 | Healthy control | CLIA | 27 U/mL | 81.48%/31.35% |
| Leelawat K | 2011 | Thailand | 50/50 | Benign biliary tract disease | CLIA | 100 U/mL | 72%/86% |
| Jiang H | 2011 | China | 68/115 | BDS | CLIA | 35 kU/L | 73.53%/86.79% |
| Leelawat K | 2010 | Thailand | 59/128 | Benign biliary tract disease | CLIA | 100 U/mL | 68%/87% |
| Li Y | 2009 | China | 115/205 | Benign disease, blood donors | EIA | 37 U/mL | 68.4%/75.0% |
| Qin L | 2009 | China | 35/50 | Benign biliary tract disease | CLIA | 39 U/mL | 80%/860% |
| Liu L | 2008 | China | 56/86 | Benign hepatobiliary diseases, normal controls | EIA | NA | 85.7%/100% |
| Chen J | 2008 | China | 148/98 | Benign polyp | CLIA | 37 U/mL | 82.43%/78.0% |
| Charatcharoenwitthaya P | 2008 | USA | 23/207 | PSC | CLIA | 20 U/mL | 78%/67% |
| Uenishi T | 2007 | Japan | 71/90 | Nonmalignant liver disease | CLIA | 39 U/mL | 62.0%/92.2% |
| Sun H | 2007 | China | 35/31 | Benign biliary tract disease | RIA | 30 U/mL | 80.00%/61.29% |
| Leelawat K | 2006 | Thailand | 33/51 | Benign biliary tract disease, volunteer | CLIA | 100 U/mL | 60.6%/80.49% |
| John AR | 2006 | UK | 68/38 | Benign liver tumors, benign bile bile duct disease | CLIA | 35 kU/L | 67.5%/86.8% |
| Qin X | 2005 | China | 51/42 | Benign bile disease | 37 kU/L | 86%/86% | |
| Levy C | 2005 | USA | 14/194 | PSC | NA | 129 U/mL | 78.6%/98.5% |
| Furmanczyk PS | 2005 | USA | 4/18 | PSC | RIA | 186 IU/mL | 100%/94% |
| Tangkijvanich P | 2004 | Thailand | 45/10 | Benign biliary disease | EIA | 100 U/mL | 64.4%/100% |
| Qin X | 2004 | China | 35/92 | Benign biliary disease | RIA | 37 kU/L | 77.14%/84.78% |
| Wang Z | 2003 | China | 34/21 | Benign polyp | RIA | 37 U/mL | 80.15%/92% |
| Siqueira E | 2002 | USA | 12/43 | PSC | RIA | 180 U/mL | 75.0%/97.3% |
| Patel AH | 2000 | USA | 36/41 | Nonmalignant liver disease | RIA | 100 U/mL | 53%/76% |
| Chalasani N | 2000 | USA | 13/41 | PSC | NA | 100 U/mL | 75%/80% |
| Björnsson E | 1999 | Sweden | 9/63 | PSC | NA | 200 ng/mL | 38%/81% |
| Ramage JK | 1995 | England | 15/59 | PSC | RIA | 200 U/mL | 60.0%/86.3% |
| Nichols JC | 1993 | USA | 9/28 | PSC | RIA | 100 U/mL | 89%/86% |
| Pungpak S | 1991 | Thailand | 14/52 | Normal control | RIA | 43.1 U/mL | 64.3%/98.1% |
PSC – primary sclerosing cholangitis; BDS – bile duct stone; HCC – hepatocellular carcinoma; CLIA – chemiluminescent immunoassay; EIA – sandwichenzyme-linked immunosorbent assay, RIA – radioimmunoassay; SEN – sensitivity; SPE – specificity.
Quality assessment of the included studies
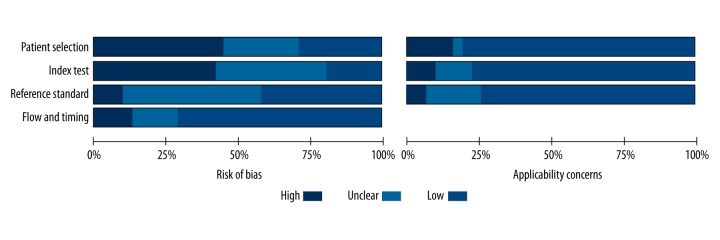
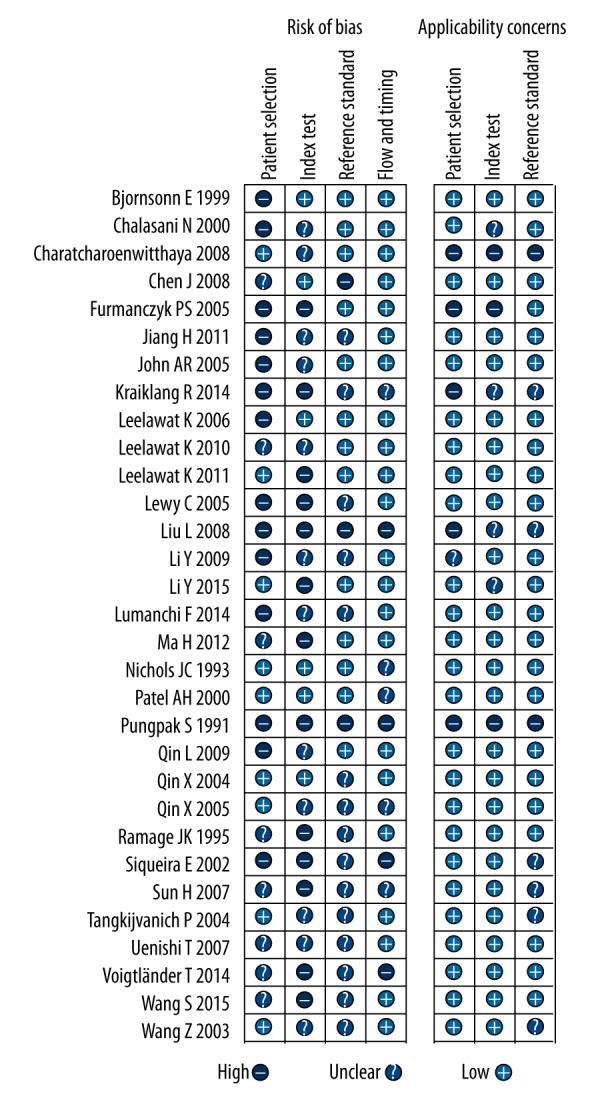
The risk of bias and applicability of the studies were evaluated based on QUADAS-2 summarized in Figures 2 and 3. A considerable proportion of studies (14/31, 45.2%) were considered to be at high risk of bias in the patient selection due to the case-control study design or inexplicit report. The index test domain in 13 studies (41.9%) was labeled as high risk of bias because the diagnostic threshold was not pre-specified. Concerning the flow and timing domain, four studies (12.9%) were considered at high risk of bias because the authors did not disclose whether all of the participants received the same reference standard.
Figure 2.
Quality assessment of all included studies according to QUADAS-2 criteria.
Figure 3.
Risk of bias and applicability concerns summary.
Quantitative data synthesis
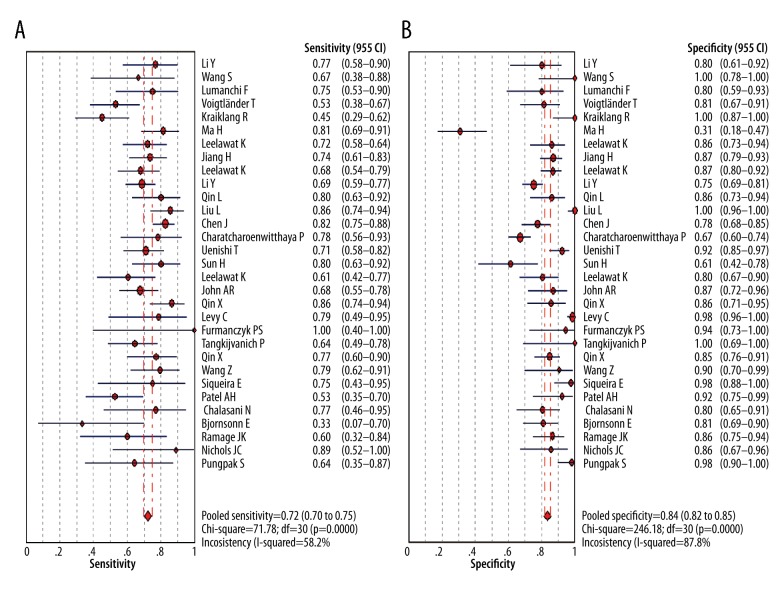
Figure 4 showed the forest plot of diagnostic SEN and SPE of CA19-9 in all 31 included studies. The overall diagnostic SEN and SPE of CA19-9 were 0.72 (95% CI: 0.70–0.75) and 0.84 (95% CI: 0.82–0.85), respectively. SEN of individual studies ranged widely from 33% to 100%, while SPE of individual studies ranged from 31% to 100%. In addition, the pooled PLR, NLR, and DOR were 4.93 (95% CI, 3.67–6.64), 0.35 (95%CI, 0.30–0.41), and 15.10 (95% CI, 10.70–21.32), respectively. The SROC cure presents a global summary of test performance, and shows the tradeoff between SEN and SPE. In this meta-analysis, the area under the SROC curve was 0.8298, indicating a moderate and perfect level of overall accuracy, as shown in Figure 5.
Figure 4.
Sensitivity and specificity of CA19-9 in diagnosis of CCA assessed by Forest plots.
Figure 5.
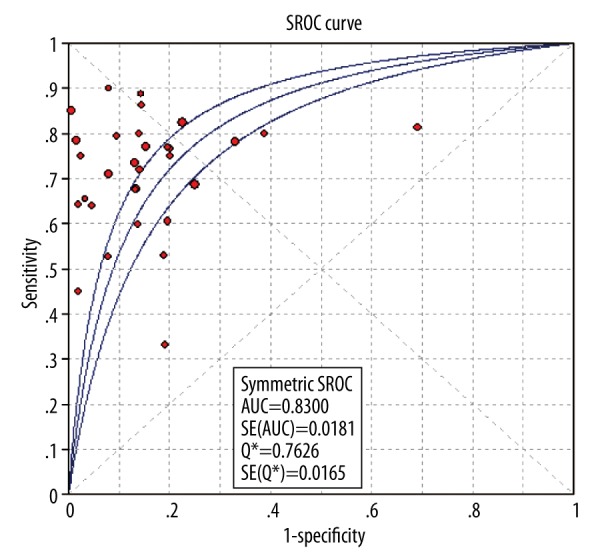
The summary receiver operating characteristic (SROC) curves of CA19-9 in diagnosis of CCA.
Heterogeneity assessment and subgroup analysis
All five performances showed high I2 values: SEN, 58.2%; SPE, 87.8%; PLR, 84.6%; NLR, 58.9%; and DOR, 61.8% (all P<0.01). This suggests substantial heterogeneity among the included studies. When heterogeneity of these 31 studies was tested, the Spearman correlation coefficient was 0.216 (P=0.236), which showed there must be factors other than threshold effect that results in the significant heterogeneity. Therefore, we performed subgroup analysis to investigate the possible sources of this heterogeneity according to geographical location, control group types, and sample size.
Subgroup analysis according to control group type showed that the type of control group (PSC group or Mixed group) had no noticeable effect on pooled SEN (0.73 [95% CI: 0.70–0.76] vs. 0.72 [95% CI: 0.70–0.75]), SPE (0.83 [95% CI: 0.81–0.85] vs. 0.83 [95% CI: 0.81–0.85]), PLR (4.69 [95% CI: 3.25–6.79] vs. 4.74 [95% CI: 3.33–6.76]), NLR (0.34 [95% CI: 0.29–0.40] vs. 0.35 [95% CI: 0.30–0.41]), DOR (14.21 [95% CI: 9.64–20.95] vs. 14.30 [95% CI: 9.90–20.66]), and AUC (0.8259 vs. 0.8271), as shown in Table 2. Subgroups analysis according to geographical location clearly showed a high degree of variability in SEN estimates, whereas SPE in all subgroups were similar. The SEN in European subgroup is lower (0.62, 95% CI: 0.54–0.69) than Asian subgroup (0.74, 95% CI: 0.71–0.77) and American group (0.71, 95% CI: 0.62–0.79). In addition, we conducted subgroup analyses stratified by the sample size. For sample size <100, the pooled SEN, SPE, PLR, NLR, DOR, and AUC were 0.69 (95% CI: 0.65–0.73), 0.79 (95% CI: 0.76–0.82), 4.33 (95% CI: 2.88–6.53), 0.40 (95% CI: 0.33–0.49), 12.34 (95% CI: 7.48–20.33), and 0.8207, respectively. The sample ≥100 improved the diagnostic power, with an increase in SEN of 0.75 (95% CI: 0.71–0.78), SPE of 0.84 (95% CI: 0.82–0.86), and DOR of 18.10 (95% CI: 11.00–29.78).
Table 2.
Summary of subgroup analysis of the included studies by different study characteristics.
| Variables | Number of studies | SEN (95%CI) | SPE (95%CI) | PLR (95%CI) | NLR (95%CI) | DOR (95%CI) | AUC |
|---|---|---|---|---|---|---|---|
| Overall | 31 | 0.72 (0.70–0.75) | 0.84 (0.82–0.85) | 5.00 (3.68–6.78) | 0.35 (0.30–0.41) | 15.29 (10.72–21.80) | 0.8300 |
| Control type | |||||||
| PSC | 8 | 0.73 (0.70–0.76) | 0.83 (0.81–0.85) | 4.69 (3.25–6.79) | 0.34 (0.29–0.40) | 14.21 (9.64–20.95) | 0.8259 |
| Mixed | 21 | 0.72 (0.70–0.75) | 0.83 (0.81–0.85) | 4.74 (3.33–6.76) | 0.35 (0.30–0.41) | 14.30 (9.90–20.66) | 0.8271 |
| Geographical location | |||||||
| Asian | 19 | 0.74 (0.71–0.77) | 0.83 (0.81–0.85) | 4.95 (3.28–7.46) | 0.33 (0.28–0.39) | 15.86 (10.34–24.32) | 0.8346 |
| American | 7 | 0.71 (0.62–0.79) | 0.84 (0.81–0.87) | 8.47 (3.31–21.69) | 0.31 (0.20–0.49) | 32.74 (10.81–99.15) | 0.8703 |
| European | 5 | 0.62 (0.54–0.69) | 0.83 (0.78–0.88) | 3.47 (2.43–4.94) | 0.50 (0.36–0.69) | 7.28 (3.95–13.44) | 0.8947 |
| Sample size | |||||||
| ≥100 | 11 | 0.75 (0.71–0.78) | 0.84 (0.82–0.86) | 5.43 (3.65–8.06) | 0.31 (0.26–0.37) | 18.10 (11.00–29.78) | 0.8189 |
| <100 | 20 | 0.69 (0.65–0.73) | 0.79 (0.76–0.82) | 4.33 (2.88–6.53) | 0.40 (0.33–0.49) | 12.34 (7.48–20.33) | 0.8207 |
SEN – sensitivity; SPE – specificity; PLR – positive likelihood ratio; NLR – negative likelihood ratio; DOR – diagnostic odds ratio; AUC – area under curve; CI– confidence interval; PSC – primary sclerosing cholangitis.
Publication bias
We tested potential publication bias using Deeks funnel plots. The funnel plots did not reveal any evidence of obvious asymmetry, which can be seen in Figure 6. The Deeks test also showed a statistically non-significant value (P=0.380), indicating that there was no potential publication bias.
Figure 6.
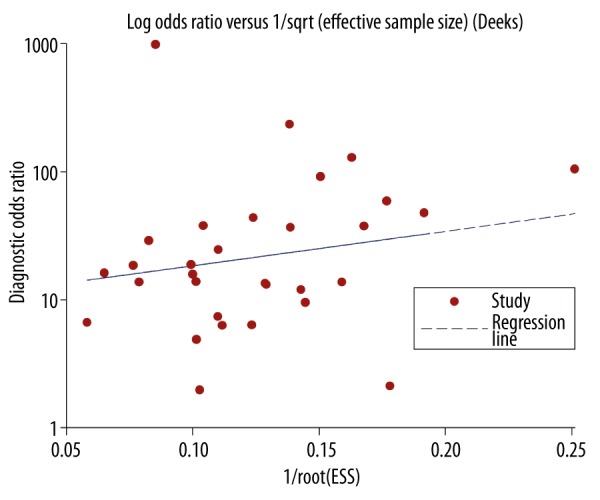
The funnel plot assessment of potential publication bias.
Discussion
CCA is regularly diagnosed at advanced stages due to the lack of early symptoms or reliable tumor biomarkers. Despite significant advances in molecular biology and diagnostic techniques, it remains one of the most frustrating diseases for gastroenterologists and surgeons. Reliable marker for diagnosis of CCA is crucial for treatment and prognosis. CA19-9, a member of the Lewis antigen family, has been studied intensively. Many studies evaluated the diagnostic role of CA 19-9 levels in patients with CCA, but the results from those studies were inconsistent. To derive a more precise estimate of the diagnostic significance of serum CA 19-9 in patients with CCA, we performed a meta-analysis of published studies. To the best of our knowledge, the present study is the first meta-analysis on the diagnostic role of serum CA 19-9 in patients with CCA, and the findings can provide valuable information for clinicians.
Thirty-one studies with a total of 3,303 subjects were finally included into the meta-analysis. Our data yields moderate diagnostic performances of CA19-9, in which the overall pooled sensitivity was 0.72 (0.70–0.75) and specificity was 0.84 (0.82–0.85). Moreover, the DOR is a single indicator of test accuracy that combines the sensitivity and specificity data into a single number. A DOR of 1.0 indicates inability to discriminate CCA patients from controls without it [41]. In the present meta-analysis, we find that the DOR values for CA19-9 was 15.10 (95% CI, 10.70–21.32), indicating that CA19-9 could be helpful in the diagnosis of CCA. SROC is usually used to summarize overall test performance, and AUC is calculated to evaluate accuracy of the selected marker [42].The AUROC value of 0.8300 indicates that CA19-9 could be a useful biomarker for CCA diagnosis. Overall, although the sensitivity is not as high as expected, CA19-9 has a good specificity in the diagnosis of CCA. Of note, 10% of individuals lack the Lewis antigen and do not produce CA 19-9, and occasionally tumor cells lose the ability to express a tumor marker [43].
Most diagnostic evaluation show considerable heterogeneity between the included studies due to different factors. Therefore, we performed subgroup analyses according to geographical location, control type, and sample size for further description of the results. Our data suggested that CA199 had a relatively lower sensitivity of 62% in European group than in Asian group (74%) and American groups (71%), while the specificity was similar for three groups. This might be explained by different living backgrounds and different genetic factors between the three races. Another important reason may be that there is different range of cut-off values for CA199 levels and different assay methods in the included studies. Moreover, the small-size group (<100) achieved low sensitivity and specificity than large-size group (≥100). Thus, well-designed studies with a large sample size that examine multiple ethnicities are required. In addition, some epidemiological data suggested that many studies involving different controls tend to show different sensitivity and specificity, and differ with those recruiting patients with clinically suspected disease, consecutively and prospectively in a representative clinical setting [44]. Therefore, the distinct type of negative control may also be a main source of heterogeneity. PSC is one of the strongest risk factors for CCA with a lifetime risk of 5–15%, and annual incidence of CCA in PSC is 0.5–1% [45,46]. We found that PSC control group displayed similar diagnostic performance with mixed control group; however, the conclusion was still consistent in the overall comparisons. This possible explanation could be the limited number of PSC patients included and different grade PSC-associated CCA studied. In addition, the subgroup analyses results showed that the above-mentioned factors do not significantly affect heterogeneity, suggesting that the influencing factors are complex. Therefore, more multi-center samples and empirical validations are still needed for a consensus on robust and accurate conclusion.
There are some limitations that need to be taken into account when interpreting the results of this study. First, the number of studies included in our meta-analysis, particularly the subgroup analysis according to control type, was limited, potentially limiting the comprehensive evaluation of diagnostic performance of CA19-9 in CCA and influencing the statistical power of results. Second, our analysis was not adjusted for confounding variables such as age, gender, life style, etc, due to incomplete information. Third, the relatively high heterogeneity presented in the 31 included studies is also the limitation of this study. Finally, only the published studies were collected and evaluated, and the unpublished studies with negative results were not included.
Conclusions
The present meta-analysis suggested that serum CA19-9 is a reliable biomarker with a moderate sensitivity and high specificity for detecting CCA. Besides, our subgroup analysis showed diagnostic performance of CA19-9 was no significant difference in different control types, but showed low sensitivity in European patients and small size group. Large-scale studies should be carried out to further validate the clinical application of CA19-9 as an effective tumor marker of CCA.
Footnotes
Source of support: Departmental sources
Conflicts of interest
The authors declare that they have no competing interests.
References
- 1.Pattanapairoj S, Silsirivanit A, Muisuk K, et al. Improve discrimination power of serum markers for diagnosis of cholangiocarcinoma using data mining-based approach. Clin Biochem. 2015;48(10–11):668–73. doi: 10.1016/j.clinbiochem.2015.03.022. [DOI] [PubMed] [Google Scholar]
- 2.Sirica AE, Almenara JA, Li C. Periostin in intrahepatic cholangiocarcinoma: pathobiological insights and clinical implications. Exp Mol Pathol. 2014;97:515–24. doi: 10.1016/j.yexmp.2014.10.007. [DOI] [PMC free article] [PubMed] [Google Scholar]
- 3.Tyson GL, El-Serag HB. Risk factors for cholangiocarcinoma. Hepatology. 2011;54:173–84. doi: 10.1002/hep.24351. [DOI] [PMC free article] [PubMed] [Google Scholar]
- 4.Charbel H, Al-Kawas FH. Cholangiocarcinoma: epidemiology, risk factors, pathogenesis, and diagnosis. Curr Gastroenterol Rep. 2011;13:182–87. doi: 10.1007/s11894-011-0178-8. [DOI] [PubMed] [Google Scholar]
- 5.Nehls O, Gregor M, Klump B. Serum and bile markers for cholangiocarcinoma. Semin Liver Dis. 2004;24:139–54. doi: 10.1055/s-2004-828891. [DOI] [PubMed] [Google Scholar]
- 6.Wongkham S, Silsirivanit A. State of serum markers for detection of cholangiocarcinoma. Asian Pac J Cancer Prev. 2012;13(Suppl):17–27. [PubMed] [Google Scholar]
- 7.Malaguarnera G, Paladina I, Giordano M, et al. Serum markers of intrahepatic cholangiocarcinoma. Dis Markers. 2013;34:219–28. doi: 10.3233/DMA-130964. [DOI] [PMC free article] [PubMed] [Google Scholar]
- 8.Reitsma JB, Glas AS, Rutjes AW, et al. Bivariate analysis of sensitivity and specificity produces informative summary measures in diagnostic reviews. J Clin Epidemiol. 2005;58:982–90. doi: 10.1016/j.jclinepi.2005.02.022. [DOI] [PubMed] [Google Scholar]
- 9.Deeks JJ, Macaskill P, Irwig L. The performance of tests of publication bias and other sample size effects in systematic reviews of diagnostic test accuracy was assessed. J Clin Epidemiol. 2005;58:882–93. doi: 10.1016/j.jclinepi.2005.01.016. [DOI] [PubMed] [Google Scholar]
- 10.Li Y, Li DJ, Chen J, et al. Application of joint detection of AFP, CA19-9, CA125 and CEA in identification and diagnosis of cholangiocarcinoma. Asian Pac J Cancer Prev. 2015;16:3451–55. doi: 10.7314/apjcp.2015.16.8.3451. [DOI] [PubMed] [Google Scholar]
- 11.Wang S, Yin J, Li T, et al. Upregulated circulating miR-150 is associated with the risk of intrahepatic cholangiocarcinoma. Oncol Rep. 2015;33:819–25. doi: 10.3892/or.2014.3641. [DOI] [PubMed] [Google Scholar]
- 12.Lumachi F, Lo Re G, Tozzoli R, et al. Measurement of serum carcinoembryonic antigen, carbohydrate antigen 19-9, cytokeratin-19 fragment and matrix metalloproteinase-7 for detecting cholangiocarcinoma: a preliminary case-control study. Anticancer Res. 2014;34:6663–67. [PubMed] [Google Scholar]
- 13.Voigtlander T, David S, Thamm K, et al. Angiopoietin-2 and biliary diseases: elevated serum, but not bile levels are associated with cholangiocarcinoma. PLoS One. 2014;9:e97046. doi: 10.1371/journal.pone.0097046. [DOI] [PMC free article] [PubMed] [Google Scholar]
- 14.Kraiklang R, Pairojkul C, Khuntikeo N, et al. A novel predictive equation for potential diagnosis of cholangiocarcinoma. PLoS One. 2014;9:e89337. doi: 10.1371/journal.pone.0089337. [DOI] [PMC free article] [PubMed] [Google Scholar]
- 15.Ma H, Huang T, Han F, et al. Clinical significance of combined detection of CA19-9, CA125 and CK19 in diagnosing cholangiocaroma. Chongqing Medicine. 2012;41:2602–3. [Google Scholar]
- 16.Leelawat K, Narong S, Wannaprasert J, Leelawat S. Serum NGAL to clinically distinguish cholangiocarcinoma from benign biliary tract diseases. Int J Hepatol. 2011;2011:873548. doi: 10.4061/2011/873548. [DOI] [PMC free article] [PubMed] [Google Scholar]
- 17.Jiang H, Liu P, Pan L. The diagnostic value of tumor marker CA19-9, CA242, CA125 and CEA in cholangiocarcinoma. J Hunan Normal Univ (Med Sci) 2011;8:59–61. [Google Scholar]
- 18.Leelawat K, Narong S, Wannaprasert J, Ratanashu-ek T. Prospective study of MMP7 serum levels in the diagnosis of cholangiocarcinoma. World J Gastroenterol. 2010;16:4697–703. doi: 10.3748/wjg.v16.i37.4697. [DOI] [PMC free article] [PubMed] [Google Scholar]
- 19.Li YG, Zhang N. Clinical significance of serum tumour M2-PK and CA19-9 detection in the diagnosis of cholangiocarcinoma. Dig Liver Dis. 2009;41:605–8. doi: 10.1016/j.dld.2008.11.010. [DOI] [PubMed] [Google Scholar]
- 20.Qin L, Shi Q, Liao W. The diagnostic value of combined detection of serum tumor markers CEA, CA19-9 and sICAM-1 for cholangiocarcinoma. J Clin Exp Med. 2009;8:7–8. [Google Scholar]
- 21.Liu L, Wang J, Liu B, et al. Serum levels of variants of transthyretin down-regulation in cholangiocarcinoma. J Cell Biochem. 2008;104:745–55. doi: 10.1002/jcb.21661. [DOI] [PubMed] [Google Scholar]
- 22.Chen J, Yi S, He D, et al. Study of relationship between cholangiocarcinoma with CEA, CA19-9 and CA242 in bile and blood. China Medical Herald. 2008;5:96–97. [Google Scholar]
- 23.Charatcharoenwitthaya P, Enders FB, Halling KC, Lindor KD. Utility of serum tumor markers, imaging, and biliary cytology for detecting cholangiocarcinoma in primary sclerosing cholangitis. Hepatology. 2008;48:1106–17. doi: 10.1002/hep.22441. [DOI] [PubMed] [Google Scholar]
- 24.Uenishi T, Yamazaki O, Tanaka H, et al. Serum cytokeratin 19 fragment (CYFRA21-1) as a prognostic factor in intrahepatic cholangiocarcinoma. Ann Surg Oncol. 2008;15:583–89. doi: 10.1245/s10434-007-9650-y. [DOI] [PubMed] [Google Scholar]
- 25.Sun H, Luo W, Wu X. Diagnostic value of combined detection of CEA, CA19-9 and CA50 on elderly patients with cholangiocarcinoma. J Chongqing Med Uni. 2007;32:287–89. [Google Scholar]
- 26.Leelawat K, Leelawat S, Ratanachu-Ek T, et al. Circulating hTERT mRNA as a tumor marker in cholangiocarcinoma patients. World J Gastroenterol. 2006;12:4195–98. doi: 10.3748/wjg.v12.i26.4195. [DOI] [PMC free article] [PubMed] [Google Scholar]
- 27.John AR, Haghighi KS, Taniere P, et al. Is a raised CA 19-9 level diagnostic for a cholangiocarcinoma in patients with no history of sclerosing cholangitis ? Dig Surg. 2006;23:319–24. doi: 10.1159/000098014. [DOI] [PubMed] [Google Scholar]
- 28.Qin X, Wang Z, Qiang Y, et al. The value of CA19-9, CEA and imaging in the diagnosis of extrahepatic cholangiocarcinoma. Chinese J Practical Surgery. 2005;25:94–96. [Google Scholar]
- 29.Levy C, Lymp J, Angulo P, et al. The value of serum CA 19-9 in predicting cholangiocarcinomas in patients with primary sclerosing cholangitis. Dig Dis Sci. 2005;50:1734–40. doi: 10.1007/s10620-005-2927-8. [DOI] [PubMed] [Google Scholar]
- 30.Furmanczyk PS, Grieco VS, Agoff SN. Biliary brush cytology and the detection of cholangiocarcinoma in primary sclerosing cholangitis: evaluation of specific cytomorphologic features and CA19-9 levels. Am J Clin Pathol. 2005;124:355–60. doi: 10.1309/J030-JYPW-KQTH-CLNJ. [DOI] [PubMed] [Google Scholar]
- 31.Tangkijvanich P, Thong-ngam D, Theamboonlers A, et al. Diagnostic role of serum interleukin 6 and CA 19-9 in patients with cholangiocarcinoma. Hepatogastroenterology. 2004;51:15–19. [PubMed] [Google Scholar]
- 32.Qin XL, Wang ZR, Shi JS, et al. Utility of serum CA19-9 in diagnosis of cholangiocarcinoma: in comparison with CEA. World J Gastroenterol. 2004;10:427–32. doi: 10.3748/wjg.v10.i3.427. [DOI] [PMC free article] [PubMed] [Google Scholar]
- 33.Wang Z, Meng X. Role of combined testing of serum tumor markers in the diagnosis and treatment of cholangiocarcinoma. J Hepatobiliary Surgery. 2003;11:187–88. [Google Scholar]
- 34.Siqueira E, Schoen RE, Silverman W, et al. Detecting cholangiocarcinoma in patients with primary sclerosing cholangitis. Gastrointest Endosc. 2002;56:40–47. doi: 10.1067/mge.2002.125105. [DOI] [PubMed] [Google Scholar]
- 35.Patel AH, Harnois DM, Klee GG, et al. The utility of CA 19-9 in the diagnoses of cholangiocarcinoma in patients without primary sclerosing cholangitis. Am J Gastroenterol. 2000;95:204–7. doi: 10.1111/j.1572-0241.2000.01685.x. [DOI] [PubMed] [Google Scholar]
- 36.Chalasani N, Baluyut A, Ismail A, et al. Cholangiocarcinoma in patients with primary sclerosing cholangitis: a multicenter case-control study. Hepatology. 2000;31:7–11. doi: 10.1002/hep.510310103. [DOI] [PubMed] [Google Scholar]
- 37.Bjornsson E, Kilander A, Olsson R. CA 19-9 and CEA are unreliable markers for cholangiocarcinoma in patients with primary sclerosing cholangitis. Liver. 1999;19:501–8. doi: 10.1111/j.1478-3231.1999.tb00083.x. [DOI] [PubMed] [Google Scholar]
- 38.Ramage JK, Donaghy A, Farrant JM, et al. Serum tumor markers for the diagnosis of cholangiocarcinoma in primary sclerosing cholangitis. Gastroenterology. 1995;108:865–69. doi: 10.1016/0016-5085(95)90462-x. [DOI] [PubMed] [Google Scholar]
- 39.Nichols JC, Gores GJ, LaRusso NF, et al. Diagnostic role of serum CA 19-9 for cholangiocarcinoma in patients with primary sclerosing cholangitis. Mayo Clin Proc. 1993;68:874–79. doi: 10.1016/s0025-6196(12)60696-x. [DOI] [PubMed] [Google Scholar]
- 40.Pungpak S, Akai PS, Longenecker BM, et al. Tumour markers in the detection of opisthorchiasis-associated cholangiocarcinoma. Trans R Soc Trop Med Hyg. 1991;85:277–79. doi: 10.1016/0035-9203(91)90055-4. [DOI] [PubMed] [Google Scholar]
- 41.Glas AS, Lijmer JG, Prins MH, et al. The diagnostic odds ratio: a single indicator of test performance. J Clin Epidemiol. 2003;56:1129–35. doi: 10.1016/s0895-4356(03)00177-x. [DOI] [PubMed] [Google Scholar]
- 42.Zeng Z, Wang J, Zhao L, et al. Potential role of microRNA-21 in the diagnosis of gastric cancer: a meta-analysis. PLoS One. 2013;8:e73278. doi: 10.1371/journal.pone.0073278. [DOI] [PMC free article] [PubMed] [Google Scholar]
- 43.Kajiwara H, Yasuda M, Kumaki N, et al. Expression of carbohydrate antigens (SSEA-1, sialyl-Lewis X, DU-PAN-2 and CA19-9) and E-selectin in urothelial carcinoma of the renal pelvis, ureter, and urinary bladder. Tokai J Exp Clin Med. 2005;30:177–82. [PubMed] [Google Scholar]
- 44.Zhang J, Xu Z, Yu L, et al. Assessment of the potential diagnostic value of serum p53 antibody for cancer: a meta-analysis. PLoS One. 2014;9:e99255. doi: 10.1371/journal.pone.0099255. [DOI] [PMC free article] [PubMed] [Google Scholar]
- 45.Chapman RW. Risk factors for biliary tract carcinogenesis. Ann Oncol. 1999;10(Suppl 4):308–11. [PubMed] [Google Scholar]
- 46.Broome U, Olsson R, Loof L, et al. Natural history and prognostic factors in 305 Swedish patients with primary sclerosing cholangitis. Gut. 1996;38:610–15. doi: 10.1136/gut.38.4.610. [DOI] [PMC free article] [PubMed] [Google Scholar]


