Abstract
Background
Use of a validated risk-assessment tool to identify individuals at high risk of developing type 2 diabetes is currently recommended. It is under-reported, however, whether a different risk tool alters the predicted risk of an individual.
Aim
This study explored any differences between commonly used validated risk-assessment tools for type 2 diabetes.
Design and setting
Cross-sectional analysis of individuals who participated in a workplace-based risk assessment in Carmarthenshire, South Wales.
Method
Retrospective analysis of 676 individuals (389 females and 287 males) who participated in a workplace-based diabetes risk-assessment initiative. Ten-year risk of type 2 diabetes was predicted using the validated QDiabetes®, Leicester Risk Assessment (LRA), FINDRISC, and Cambridge Risk Score (CRS) algorithms.
Results
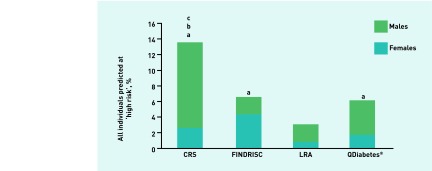
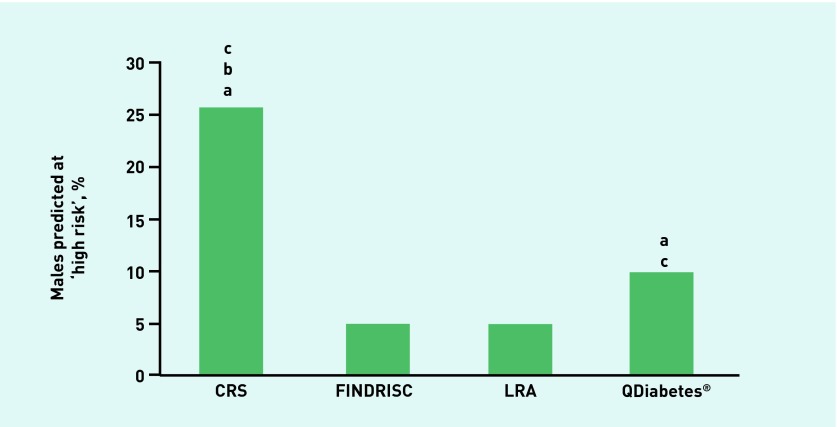
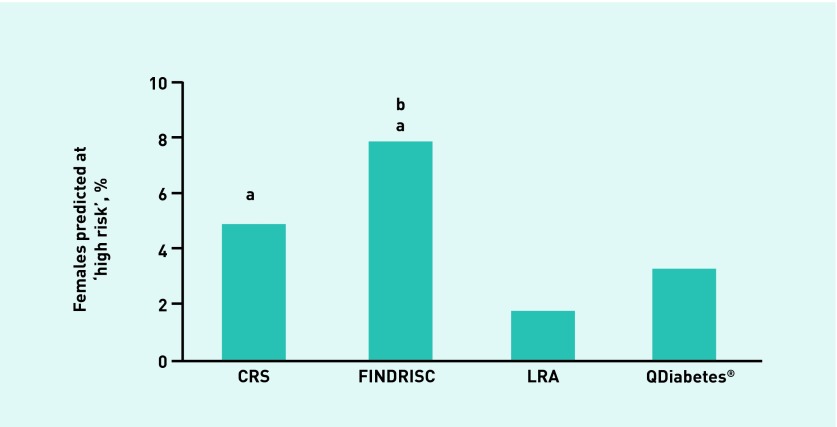
Differences between the risk-assessment tools were apparent following retrospective analysis of individuals. CRS categorised the highest proportion (13.6%) of individuals at ‘high risk’ followed by FINDRISC (6.6%), QDiabetes (6.1%), and, finally, the LRA was the most conservative risk tool (3.1%). Following further analysis by sex, over one-quarter of males were categorised at high risk using CRS (25.4%), whereas a greater percentage of females were categorised as high risk using FINDRISC (7.8%).
Conclusion
The adoption of a different valid risk-assessment tool can alter the predicted risk of an individual and caution should be used to identify those individuals who really are at high risk of type 2 diabetes.
Keywords: diabetes mellitus, type 2; general practice; primary health care; public health; risk; risk assessment
INTRODUCTION
The number of individuals estimated to be living with diabetes in the UK is projected to rise to 3 646 000 by the year 2030, which would see an average increase of 31 000 new cases annually.1 The National Institute for Health and Care Excellence (NICE) recently introduced guidelines to identify those individuals at ‘high risk’ of developing type 2 diabetes.2 These guidelines advocate the use of validated risk-assessment tools, equations, or self-assessment questionnaires to identify high risk individuals.2 The guidelines further recommend using validated risk scores that take account of routinely collected data in primary care such as the QDiabetes® risk calculator3 or the Cambridge Risk Score.4 The guidance also states that validated self-assessment questionnaires can be used to identify individuals at high risk, such as the most widely used and validated example, FINDRISC,5 or the Leicester Risk Assessment.6
Comparisons have been made between cardiovascular disease risk equations,7,8 which have highlighted that a different algorithm can estimate a different value for the 10-year cardiovascular disease (CVD) risk of an individual. To the authors’ knowledge no studies have examined whether adoption of a different validated risk-assessment tool can influence an individual’s predicted risk of developing type 2 diabetes. This is significant as those individuals predicted to be at high risk would be eligible for further clinical investigations.2 The prevention of type 2 diabetes from an economic standpoint in the UK is also a worthy consideration. In 2010–2011 the direct and indirect costs were £8.8 billion and £13.0 billion, which are projected to rise to £15.1 billion and £20.5 billion, respectively, by 2035–2036.9
Therefore, the aim of this study was to examine if there were any differences between four commonly used validated risk-assessment tools when applied to the same dataset.
METHOD
Study population
All participants in this study were employees of either the local health board or steel workers within the Welsh region of Carmarthenshire who had received a CVD risk assessment as part of the established Prosiect Sir Gâr workplace-based initiative.10 The initiative was introduced in 2009 and data collection for this study took place between 2009 and 2012. All current employees over the age of 40 years (if white), or 25 years (if South Asian) with no prior diagnosis of CVD or diabetes were invited to participate in the project. This study focuses on the 676 employees who accepted the invitation of a health assessment, of whom 389 were female and 287 male.
Baseline measurements
According to a standard operational policy (SOP) all recruited individuals attended a standardised health assessment that lasted 30–40 minutes. During the session, demographic (date of birth, sex, and postcode of residence) and anthropometric (body mass, height, and waist circumference) data, systolic and diastolic blood pressure, smoking status, family and medical histories were all recorded. Lifestyle questions were asked regarding dietary habits (fruit and vegetable intake), and current physical activity levels were assessed by the General Practice Physical Activity Questionnaire (GPPAQ11). Full details of the health assessment appointment, which took place during normal working hours at the employees’ workplace, have been published extensively elsewhere.10
How this fits in
Type 2 diabetes is one of the greatest public health challenges facing the UK, with an estimated 31 000 new cases being diagnosed each year. At present, however, there is no consensus on which risk assessment tool to use to identify individuals at ‘high risk’ of developing type 2 diabetes. This research compares four validated risk-assessment tools and examines the number of individuals predicted at high risk. Use of different valid risk-assessment tools can alter the predicted risk of an individual, hence caution should be taken in identification of who really is at high risk of type 2 diabetes.
Diabetes risk prediction equations
Risk of developing type 2 diabetes was calculated by entering the relevant variables as detailed in Table 1 into the Cambridge Risk Score, FINDRISC, Leicester Risk Assessment, and QDiabetes validated risk assessments. These four risk-prediction tools all feature in the current NICE guidelines,2 and are either based on routinely collected data (Cambridge Risk Score, QDiabetes) or from cohorts (FINDRISC, Leicester Risk Assessment). The QDiabetes online algorithm calculates a 10-year percentage (%) value of developing type 2 diabetes, whereas the Leicester Risk Assessment and FINDRISC model are questionnaires based on a scoring system that aligns the individual to a risk category and corresponding 10-year risk of developing type 2 diabetes. The Cambridge Risk Score is calculated using a logistic regression model and uses quintiles to express the likelihood of an individual having undiagnosed diabetes. Individuals calculated in the highest-risk quintile are 22 times more likely to develop type 2 diabetes compared with the bottom-risk quintile.12
Table 1.
Included variables of the four validated risk assessments
| Cambridge Risk Score | FINDRISC | Leicester Risk Assessment | QDiabetes® | |
|---|---|---|---|---|
| Age | Y | Y | Y | Y |
| Sex | Y | Y | Y | Y |
| Body mass index | Y | Y | Y | Y |
| Waist circumference | – | Y | Y | – |
| Ethnicity | – | – | Y | Y |
| Family history of diabetes | Y | Y | Y | Y |
| Smoking status | Y | – | – | Y |
| Antihypertensive medication | Y | Y | Y | Y |
| Current steroid treatment | Y | – | – | Y |
| Social deprivation | – | – | – | Y |
| Physical activity levels | – | Y | – | – |
| Fruit and vegetable intake | – | Y | – | – |
| History of high blood glucose | – | Y | – | – |
Variables entered into each of the four validated risk assessments. Y denotes variable entered into risk assessment.
Data analysis
The focus of the analysis within this study was to compare four validated and routinely used diabetes risk-assessment tools. Within the analysis, it was chosen to stratify the samples by age. Statistical analysis was performed using SPSS software (version 19) with significance set at P<0.05. Normality of data was assessed by one-sample Kolmogorov–Smirnov test. Homogeneity of variance was determined by Levene’s statistic and one-way analysis of variance (ANOVA) with post-hoc Bonferroni correction factor used to locate any differences within groups. χ2 analysis with α set at 0.05 was performed to analyse differences between the proportions of individuals predicted at high risk. Body mass, waist circumference, and diastolic blood pressure data are represented as mean ± SD. Height, body mass index (BMI), systolic blood pressure, and QDiabetes scores did not have a normal distribution. These datasets were consequently log transformed for analysis and represented as the geometric mean and approximate standard deviation. Age, FINDRISC, Leicester Risk Assessment, and Cambridge Risk Score data did not have a normal distribution after log transformation, and these data are represented as median and interquartile range. Kruskal–Wallis and Mann–Whitney tests were used to analyse FINDRISC, Leicester Risk Assessment, and Cambridge Risk Score data.
RESULTS
Baseline characteristics
Table 2 documents the baseline characteristics of the study population. As a result of the eligibility criteria, the median age of the workers was 49 years. Both the male and female cohorts of workers were found to be ‘overweight’ with mean BMI values of 28.3 ± 1.7 and 26.6 ± 1.9 kg/m2, respectively. The baseline characteristics also demonstrate evidence of ‘central obesity’ in the workforces, with the male and female average waist circumference values observed to be above the 94 cm and 80 cm thresholds.13 The risk prediction categories for the males and females were ‘Slightly Elevated’, ‘Increased’, and ‘Low’ using FINDRISC, Leicester Risk Assessment, and QDiabetes, respectively. The median values of male workers were calculated to be in the fourth quintile (second highest) and the women in the second quintile (second lowest) when entered into the Cambridge Risk Score.
Table 2.
Baseline characteristics of study population
| Males (n= 287) | Females (n= 389) | All individuals (n= 676) | |
|---|---|---|---|
| Age, yearsa | 49 (44–53) | 49 (44–54) | 49 (44–54) |
| Height, mb | 1.76 ± 0.02 | 1.61 ± 0.03 | 1.67 ± 0.04 |
| Body mass, kg | 88.6 ± 14.7 | 70.7 ± 13.3 | 78.3 ± 16.5 |
| Body mass index, kg/m2 b | 28.3 ± 1.7 | 26.6 ± 1.9 | 27.3 ± 1.9 |
| Waist circumference, cm | 100.9 ± 11.1 | 89.6 ± 12.5 | 94.4 ± 13.2 |
| Systolic blood pressure, mmHgb | 128 ± 5 | 126 ± 6 | 127 ± 6 |
| Diastolic blood pressure, mmHg | 85 ± 9 | 82 ± 9 | 83 ± 9 |
| Family history of diabetes, first degree | 69 (24.0) | 121 (31.1) | 190 (28.1) |
| Physically active or moderately active, GPPAQ | 247 (86.0) | 240 (61.7) | 487 (72.0) |
| Cambridge Risk Scorea | 0.215 (0.079–0.370) | 0.052 (0.023–0.160) | 0.105 (0.036–0.258) |
| FINDRISC, pointsa | 8 (6–11) | 9 (6–12) | 8 (6–11) |
| Leicester Risk Assessment, pointsa | 13 (9–18) | 9 (5–14) | 10 (5–15) |
| QDiabetes®, %b | 6.4 ± 2.4 | 3.4 ± 1.4 | 4.5 ± 1.9 |
Data represented as mean ± standard deviation [SD].
Data represented as median (interquartile range).
Data represented as geometric mean ± approximate SD. Discrete variables represented as numbers with percentages in brackets. GPPAQ = General Practice Physical Activity Questionnaire.
Risk prediction categories
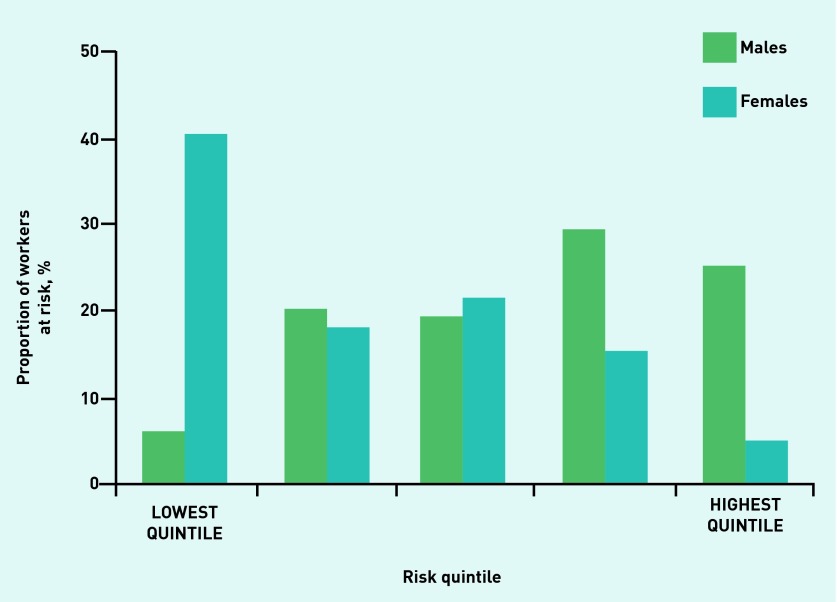
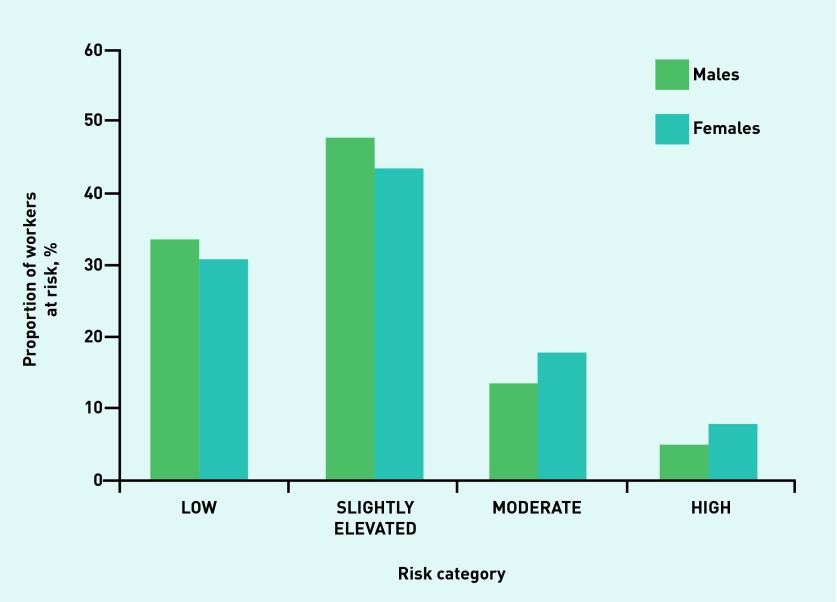
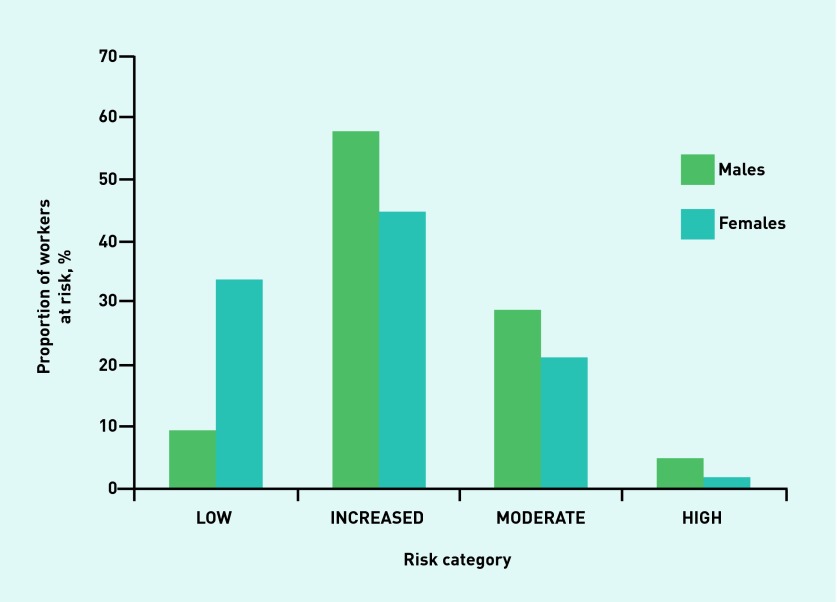
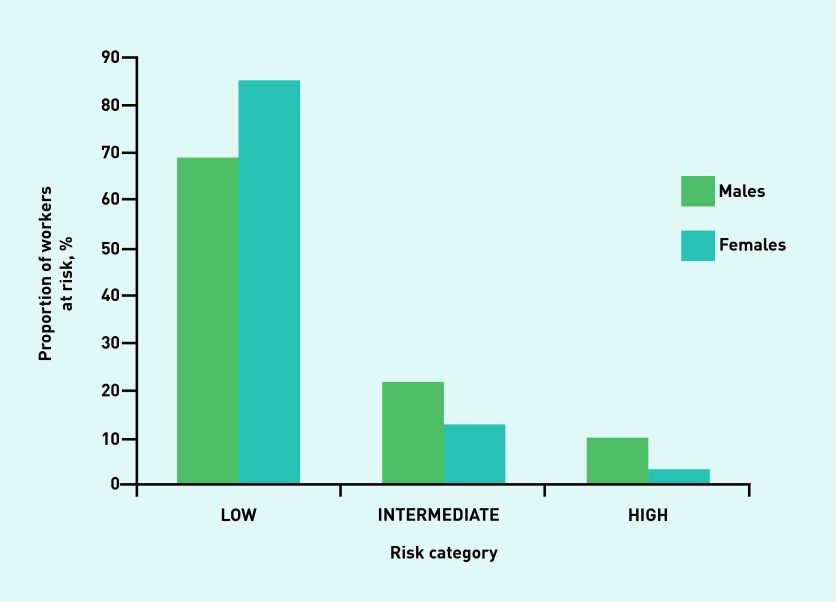
Figures 1–4 illustrate the proportion of sexes in each of the risk categories or quintiles after the adoption of the four validated risk assessments. Most males (54.7%) were predicted in the highest two risk quintiles, whereas most females (58.4%) were predicted in the lowest two risk quintiles when the Cambridge Risk Score was used (Figure 1). The FINDRISC tool predicted the highest proportion of males (47.7%) and females (43.5%) in the ‘Slightly Elevated’ prediction category (Figure 2). The greatest numbers of males and females again were calculated in the same category when the Leicester Risk Assessment was adopted, with proportions of 57.5% and 44.2%, respectively, in the ‘Increased’ risk category (Figure 3). Finally, the males (68.6%) and females (84.6%) were found to have the greatest proportions in the ‘Low’ risk category using the QDiabetes tool (Figure 4).
Figure 1.
Proportion of males and females in each associated risk quintile in the Cambridge Risk Score.
Figure 2.
Proportion of males and females in each associated risk category in the FINDRISC model.
Figure 3.
Proportion of males and females in each associated risk category in the Leicester Risk Assessment.
Figure 4.
Proportion of males and females in each associated risk category in the QDiabetes® model.
Individuals at high risk
In terms of the proportion of individuals predicted to be at high risk by each of the validated risk assessments, the Cambridge Risk Score categorised the highest proportion of all individuals (13.6%), followed by FINDRISC (6.6%), QDiabetes (6.1%), and, finally, the Leicester Risk Assessment, which was the most conservative risk tool (3.1%) (Figure 5). After further examination by sex analysis, it was found that more males (Figure 6) were categorised as high risk using either the Cambridge Risk Score (25.4%) or QDiabetes (9.8%) tools versus either the Leicester Risk Assessment (4.8%) or FINDRISC (4.9%) assessments. A greater percentage of females, however, were categorised as high risk using the FINDRISC assessment (7.8%) compared with QDiabetes (3.3%) or the Leicester Risk Assessment (1.8%) (Figure 7). In addition, all of the risk assessments other than FINDRISC predicted a greater proportion of males at high risk compared with their female counterparts.
Figure 5.
Proportion of individuals predicted to be at high risk of developing type 2 diabetes: all individuals. aDenotes higher proportion than Leicester Risk Assessment. bDenotes higher proportion than QDiabetes®. cDenotes higher proportion than FINDRISC (P < 0.05). CRS = Cambridge Risk Score. LRA = Leicester Risk Assessment.
Figure 6.
Proportion of individuals predicted to be at high risk of developing type 2 diabetes: male individuals. aDenotes higher proportion than Leicester Risk Assessment. bDenotes higher proportion than QDiabetes®. cDenotes higher proportion than FINDRISC (P < 0.05). CRS = Cambridge Risk Score. LRA = Leicester Risk Assessment.
Figure 7.
Proportion of individuals predicted to be at high risk of developing type 2 diabetes: female individuals. aDenotes higher proportion than Leicester Risk Assessment. bDenotes higher proportion than QDiabetes®. cDenotes higher proportion than FINDRISC (P < 0.05). CRS = Cambridge Risk Score. LRA = Leicester Risk Assessment.
Changes in risk score after age stratification
From the outset, it was decided to examine the cohorts by five predetermined age groups (<45 years, 45–49 years, 50–54 years, 55–59 years, ≥60 years; Table 3). Female predicted risk increased from 1.8 ± 0.7% to 6.1 ± 2.1% in the QDiabetes model where risk prediction was higher than <45 years in subsequent age groups and increased again in the ≥60 years group compared with the 45–49 years group. The female risk categories in the oldest age group were ‘moderate’ and ‘slightly elevated’ compared with the ‘low’ risk category of the <45 years age group in the Leicester Risk Assessment and FINDRISC questionnaires, respectively. The risk quintile of the Cambridge Risk Score increased from the lowest risk quintile in the <45 years age group to the middle quintile in the ≥60 years group. The predicted 10-year risk of the male employees increased from ‘low’ (3.8 ± 1.4%) to ‘intermediate’ (11.0 ± 3.0%) risk after adoption of the QDiabetes model. The risk quintiles of the male individuals increased from the middle quintile (<45 years) up to the highest-risk quintile in the Cambridge Risk Score, and the risk categories increased from ‘low’ to ‘slightly elevated’ in the FINDRISC model across the age groups. The Leicester Risk Assessment category was already at ‘increased’ risk in the youngest age group of the male cohorts and incremental rise in total points scored resulted in the oldest age group classified in the upper limits of the ‘moderate’ risk category.
Table 3.
Changes in diabetes risk prediction scores following age stratification
| <45 years | 45–49 years | 50–54 years | 55–59 years | ≥60 years | |
|---|---|---|---|---|---|
|
| |||||
| Females | n = 99 | n = 109 | n = 87 | n = 65 | n = 29 |
|
| |||||
| Cambridge Risk Scorea | 0.023 (0.014–0.102) | 0.057 (0.022–0.159)b | 0.092 (0.036–0.191)b,c | 0.052 (0.030–0.180)b | 0.167 (0.036–0.288)b,c,e |
|
| |||||
| FINDRISC, pointsa | 6 (4–9) | 9 (6–12)b | 9 (7–12)b | 9 (7–12)b | 10 (7–13)b |
|
| |||||
| Leicester Risk Assessment, pointsa | 5 (2–9) | 7 (0–12) | 12 (8–17)b,c | 10 (8–17)b,c,d | 16 (9–20)b,c,d,e |
|
| |||||
| QDiabetes®, % f | 1.8 ± 0.7 | 3.5 ± 1.5b | 4.7 ± 1.8b | 4.3 ± 1.5b | 6.1 ± 2.1b,c |
|
| |||||
| Males | n = 81 | n = 88 | n = 63 | n = 39 | n = 16 |
|
| |||||
| Cambridge Risk Scorea | 0.107 (0.048–0.228) | 0.220 (0.103–0.328)b | 0.223 (0.087–0.472)b | 0.318 (0.228–0.431)b,c | 0.361 (0.192–0.670)b,c,d |
|
| |||||
| FINDRISC, pointsa | 6 (3–8) | 9 (6–11)b | 9 (6–11)b | 10 (8–12)b,c | 10 (8–12)b |
|
| |||||
| Leicester Risk Assessment, pointsa | 10 (8–13) | 11 (8–15) | 15 (13–20)b,c | 17 (14–20)b,c | 21 (16–25)b,c,d |
|
| |||||
| QDiabetes®, %f | 3.8 ± 1.4 | 6.6 ± 2.3b | 7.9 ± 2.6b | 10.0 ± 3.0b | 11.0 ± 3.0b |
Data represented as median and interquartile range.
Denotes significantly different from < 45 years.
Denotes significantly different from 45–49 years.
Denotes significantly different from 50–54 years.
Denotes significantly different from 55–59 years (P< 0.05).
Data represented as geometric mean ± approximate SD.
DISCUSSION
Summary
This study examined whether the adoption of a different validated risk-assessment tool would alter an individual’s predicted risk of type 2 diabetes. The main findings from this study demonstrated that the risk of an individual developing type 2 diabetes was dependent on which risk-assessment tool was used. It was observed that over one-quarter of males were predicted to be in the highest-risk quintile when the Cambridge Risk Score was used. This value was a fivefold increase compared with the Leicester Risk Assessment and FINDRISC questionnaires, and more than double the amount of individuals categorised as high risk using the QDiabetes risk assessment. In the female cohort, double the amount of individuals were again categorised as high risk using the QDiabetes tool compared with the Leicester Risk Assessment. The FINDRISC model, however, predicted the greatest proportion of females at high risk (7.8%).
Strengths and limitations
One of the main strengths of this research is that the study population is representative of the current working demographic in Carmarthenshire, South Wales, who volunteered to participate in a workplace-based diabetes risk assessment. The details of these employees would not be routinely available if not for the Prosiect Sir Gâr initiative and therefore this information provides an insight into the current diabetes ‘risk’ of the workforce in Wales.
This study is also the first to compare directly the proportion of individuals that was predicted to be at high risk by four validated and routinely used risk assessments. The risk assessments were chosen in this study primarily because they feature in the NICE guidance,2 and also have five common risk variables (age, sex, BMI, family history of diabetes, and currently prescribed antihypertensive medication; Table 1) that make direct comparisons feasible.
One of the limitations to this study and also to the current literature is that, unlike in validated CVD risk prediction algorithms,8 no prospective studies have compared diabetes risk prediction models to measure the accuracy and false–positive rates of these current models. Thus, this admission from the current literature offers a suggestion for important future research.
Comparison with existing literature
It is acknowledged that in the development and validation stages of some of the risk assessment models included in this study some comparisons have been previously made between the risk-assessment tools. During the validation of the QDiabetes model, comparisons were made with the Cambridge Risk Score. This validation demonstrated that the QDiabetes model improved discrimination; however, because the Cambridge Risk Score does not give a prediction of absolute risk, calibration measures between the two risk scores could not be determined.3 The inclusion of ethnicity in the QDiabetes model could explain these differences, with previous research concluding that ethnic-specific cut points need to be established when using the Cambridge Risk Score in a multi-ethnic population.14 Ethnic group is an important consideration in the FINDRISC model, which was developed in a white population. There is a tendency for diabetes risk questionnaires developed in white populations to underperform in multi-ethnic populations,15 and this observation provided the rationale for the Leicester Risk Assessment, which was based on the FINDRISC example2 and validated for use in a multi-ethnic population in the UK.6 Interestingly, in comparison with the FINDRISC model, a score of ≥16 on the Leicester Risk Assessment increased the number of individuals identified with impaired glucose regulation rather than a score of ≥9, which was indicative of drug-treated diabetes using the FINDRISC questionnaire.2 This offers a suggestion of why differences were observed in the numbers of individuals predicted to be high risk between these two risk assessments.
Other previous research has established that the Cambridge Risk Score had no advantage in identifying diabetes risk compared with BMI alone.16 This finding demonstrates the importance of waist circumference in predicting diabetes risk, especially given that previously evidence has demonstrated a clear association between ‘central obesity’ (waist circumference of ≥102 cm in males and ≥88 cm in females) and diabetes risk, regardless of BMI values.17
Implications for research and practice
The findings from this study raise a question about the validated risk assessments currently advocated by NICE and the correct approaches to reduce the ever-increasing prevalence of type 2 diabetes in the UK.2 There are three apparent options in terms of risk-assessment tools that can be taken from the present observations. First, an aggressive approach could be taken by favouring the Cambridge Risk Score. Although the limitation of this model has been discussed, this approach potentially could benefit males who develop type 2 diabetes at a lower BMI value than their female counterparts.18,19 The second method could be taking a conservative approach by prioritising adoption of the Leicester Risk Assessment, which also allows layperson completion. This risk tool did predict the lowest proportion of males, females, and, subsequently, all participants at high risk of developing type 2 diabetes, however, which could overlook some at-risk individuals. The third, more practical, and cost-effective approach would be to use one of the two tools that predicted ∼6% of all participants at high risk, either FINDRISC or QDiabetes.
Interestingly, lifestyle intervention through exercise and diet has been proven to prevent type 2 diabetes in high-risk individuals,20 and has also been shown to be more effective than metformin at reducing the incidence of diabetes in a group of high-risk individuals with impaired glucose regulation.21 This intervention focused on weight loss of at least 7% and individuals partaking 150 minutes of physical activity per week.21 Impaired fasting glucose (IFG) where concentrations are ≥6.1 mmol/L1 have also shown strong associations with individuals developing type 2 diabetes compared with those individuals with fasting blood glucose below this threshold value.22,23 Only the FINDRISC tool accounts for physical activity and history of high blood glucose, both of which are positive aspects to the questionnaire. However as discussed previously, the FINDRISC tool does not account for ethnic group, which is fine if the population is Europid, but with a large South Asian population in the UK reservations should be given to prioritising this assessment. Moreover, since the introduction in 2011 of HbA1c as a diagnostic criterion for type 2 diabetes,24 the performance of FINDRISC has reduced.25
From a clinical standpoint, given the discrepancies in the numbers of predicted high risk individuals, a more practical approach would be to focus more on isolated risk factors (for example, adverse family histories, physical inactivity, elevated waist circumference), irrespective of diabetes risk prediction values. There is merit for everyone to benefit from lifestyle advice that reinforces the benefits of regular physical activity and a balanced diet, rather than wait for the individual to be deemed high risk. This strategy also has the potential to convert those individuals currently predicted at ‘intermediate’ or ‘increased’ risk to ‘low’ risk. Nevertheless, while diabetes risk assessments remain the recommended primary tool to identify individuals at high risk,2 the risk assessments that include waist circumference as a risk factor should be prioritised in primary care and prevention because of the overwhelming evidence of ‘central obesity’ being a better indicator of diabetes risk than BMI.17,26
A further finding was no significant concomitant relationship between age and changes in risk scores, with no apparent rise in diabetes risk prediction from 50 years old in males and females. This is somewhat surprising given the inclusion of age as a risk factor and the varying weightiness by coefficient in each of the diabetes risk assessments.3–6 This finding is important, however, as it provides additional evidence to the current targeted age groups as documented in current government guidelines,2 and potentially offers a suggestion to slightly amend this documentation to target those individuals aged ≥50 years instead, while still providing lifestyle advice to adults aged <50 years old. In addition, epidemiological research has previously reported that diabetes risk increases with age, with one explanation being that glycaemic control as reflected in HbA1c scores revealed a significant increase from 50 years onwards.27
Unfortunately, it seems that in the 10 years since the FINDRISC model was introduced, and despite new models for predicting risk of type 2 diabetes being introduced in great numbers globally and annually with an increase of focus on layperson completion (for a review, see Noble and colleagues28), discrepancies remain in numbers of individuals at high risk. The changes in diagnostic criteria for diabetes, which now incorporate HbA1c values, also have been shown to reduce performance in some of the more established diabetes prediction tools. Encouragingly, an emerging model has been developed recently that has accounted for these diagnostic changes involving HbA1c in its predictive capability.29 Differences were observed in predicted high risk individuals using the currently advocated risk assessments, and therefore caution should be addressed when categorising such individuals at high risk. In primary care, until a consensus is made on the diabetes risk prediction ‘model of choice’, more focus should be on isolated risk factors, especially regarding lifestyle choices and evidence of ‘central obesity’ irrespective of diabetes risk prediction score. Furthermore, with the change in diagnostic criteria, it is also important that any new risk prediction assessments allow for these in their respective algorithms.
Acknowledgments
The authors wish to express their gratitude to Dr Richard Tristham for providing his expertise regarding the primary care/general practice implications of this article. The Prosiect Sir Gâr Group is: Kerry Morgan, Chris Cottrell, Vanessa Davies, Liz Newbury-Davies, Michael Thomas, Enzo M Di Battista, Lesley Street, Fiona Judd, Cindy Evans, Jo James, Claire Jones, Carolyn Williams, Susan Smith, James Thornton, Sally P Williams, Rhys Williams, Sam Rice, Jeffrey W Stephens, and Meurig Williams.
Funding
This work was part-funded by the European Social Fund (ESF) through the European Union’s Convergence programme administered by the Welsh government and the corresponding author was also part-funded by the St David’s Medical Foundation. Prosiect Sir Gâr received funding contributions from Tata Steel, Hywel Dda Health Board (Diabetes Charitable Fund and Carmarthenshire Charitable Fund), Carmarthenshire County Council, and the following pharmaceutical companies: Takeda, Lilly, Sanofi-Aventis, Boehringer Ingelheim, Pfizer, and AstraZeneca.
Ethical approval
Prosiect Sir Gâr and this subsequent study were approved by Dyfed Powys local research ethics committee (reference number: 11/WA/0101).
Provenance
Freely submitted; externally peer reviewed.
Competing interests
The authors have declared no competing interests.
Discuss this article
Contribute and read comments about this article: bjgp.org/letters
REFERENCES
- 1.Whiting DR, Guariguata L, Weil LC, Shaw J. IDF diabetes atlas: global estimates of the prevalence of diabetes for 2011 and 2030. Diabetes Res Clin Pract. 2011;94(3):311–321. doi: 10.1016/j.diabres.2011.10.029. [DOI] [PubMed] [Google Scholar]
- 2.National Institute for Health and Care Excellence . Preventing type 2 diabetes: risk identification and interventions for individuals at high risk. PH 38. London: NICE; 2012. http://www.nice.org.uk/guidance/ph38 (accessed 24 Sep 2015). [Google Scholar]
- 3.Hippisley-Cox J, Coupland C, Robson J, et al. Predicting risk of type 2 diabetes in England and Wales: prospective derivation and validation of QDScore. BMJ. 2009;338:b880. doi: 10.1136/bmj.b880. [DOI] [PMC free article] [PubMed] [Google Scholar]
- 4.Griffin SJ, Little PS, Hales CN, et al. Diabetes risk score: towards earlier detection of type 2 diabetes in general practice. Diabetes Metab Res Rev. 2000;16(3):164–171. doi: 10.1002/1520-7560(200005/06)16:3<164::aid-dmrr103>3.0.co;2-r. [DOI] [PubMed] [Google Scholar]
- 5.Lindström J, Tuomilehto J. The diabetes risk score: a practical tool to predict type 2 diabetes risk. Diabetes Care. 2003;26(3):725–731. doi: 10.2337/diacare.26.3.725. [DOI] [PubMed] [Google Scholar]
- 6.Gray LJ, Taub NA, Khunti K, et al. The Leicester Risk Assessment score for detecting undiagnosed type 2 diabetes and impaired glucose regulation for use in a multi-ethnic UK setting. Diabet Med. 2010;27(8):887–895. doi: 10.1111/j.1464-5491.2010.03037.x. [DOI] [PubMed] [Google Scholar]
- 7.Stephens JW, Ambler G, Vallance P, et al. Cardiovascular risk and diabetes. Are the methods of risk prediction satisfactory? Eur J Cardiovasc Prev Rehabil. 2004;11(6):521–528. doi: 10.1097/01.hjr.0000136418.47640.bc. [DOI] [PubMed] [Google Scholar]
- 8.Simmonds MC, Wald NJ. Risk estimation versus screening performance: a comparison of six risk algorithms for cardiovascular disease. J Med Screen. 2012;19(4):201–205. doi: 10.1258/jms.2012.012076. [DOI] [PubMed] [Google Scholar]
- 9.Hex NC, Bartlett D, Wright M, et al. Estimating the current and future costs of type 1 and type 2 diabetes in the UK, including direct health costs and indirect societal and productivity costs. Diabet Med. 2012;29(7):855–862. doi: 10.1111/j.1464-5491.2012.03698.x. [DOI] [PubMed] [Google Scholar]
- 10.Gray BJ, Bracken RM, Thomas M, et al. ‘Prosiect Sir Gâr’: workplace-based cardiovascular disease and diabetes risk assessments. Occup Med (Lond) 2014;64(7):549–556. doi: 10.1093/occmed/kqu103. [DOI] [PubMed] [Google Scholar]
- 11.Department of Health . The General Practice Physical Activity Questionnaire (GPPAQ): a screening tool to assess adult physical activity levels, within primary care. London: DH; 2009. https://www.gov.uk/government/uploads/system/uploads/attachment_data/file/192453/GPPAQ_-_guidance.pdf (accessed 24 Sep 2015). [Google Scholar]
- 12.Rahman M, Simmons RK, Harding AH, et al. A simple risk score identifies individuals at high risk of developing type 2 diabetes: a prospective cohort study. Fam Pract. 2008;25(3):191–196. doi: 10.1093/fampra/cmn024. [DOI] [PubMed] [Google Scholar]
- 13.International Diabetes Federation . The IDF consensus worldwide definition of the metabolic syndrome. Brussels: IDF Communications; 2006. http://www.idf.org/webdata/docs/IDF_Meta_def_final.pdf (accessed 24 Sep 2015). [Google Scholar]
- 14.Spijkerman AMW, Yuyun MF, Griffin SJ, et al. The performance of a risk score as a screening test for undiagnosed hyperglycemia in ethnic minority groups: data from the 1999 health survey for England. Diabetes Care. 2004;27(1):116–122. doi: 10.2337/diacare.27.1.116. [DOI] [PubMed] [Google Scholar]
- 15.Glümer C, Vistisen D, Borch-Johnsen K, et al. on behalf of the DETECT-2 Collaboration Risk scores for type 2 diabetes can be applied in some populations but not all. Diabetes Care. 2006;29(2):410–414. doi: 10.2337/diacare.29.02.06.dc05-0945. [DOI] [PubMed] [Google Scholar]
- 16.Thomas C, Hyppönen E, Power C. Type 2 diabetes mellitus in midlife estimated from the Cambridge Risk Score and body mass index. Arch Intern Med. 2006;166(6):682–688. doi: 10.1001/archinte.166.6.682. [DOI] [PubMed] [Google Scholar]
- 17.Langenberg C, Sharp SJ, Schulze MB, et al. on behalf of the InterAct Consortium Long-term risk of incident type 2 diabetes and measures of overall and regional obesity: the EPIC-InterAct case-cohort study. PLoS Med. 2012;9(6):e1001230. doi: 10.1371/journal.pmed.1001230. [DOI] [PMC free article] [PubMed] [Google Scholar]
- 18.Logue J, Walker JJ, Colhoun HM, et al. Do men develop type 2 diabetes at lower body mass indices than women? Diabetologia. 2011;54(12):3003–3006. doi: 10.1007/s00125-011-2313-3. [DOI] [PMC free article] [PubMed] [Google Scholar]
- 19.Paul S, Thomas G, Majeed A, et al. Women develop type 2 diabetes at a higher body mass index than men. Diabetologia. 2012;55(5):1556–1557. doi: 10.1007/s00125-012-2496-2. [DOI] [PubMed] [Google Scholar]
- 20.Tuomilehto J, Lindström J, Eriksson JG, et al. Prevention of type 2 diabetes mellitus by changes in lifestyle among subjects with impaired glucose tolerance. N Eng J Med. 2001;344(18):1343–1350. doi: 10.1056/NEJM200105033441801. [DOI] [PubMed] [Google Scholar]
- 21.Knowler WC, Barrett-Connor E, Fowler SE, et al. Reduction in the incidence of type 2 diabetes with lifestyle intervention or metformin. N Eng J Med. 2002;346(6):393–403. doi: 10.1056/NEJMoa012512. [DOI] [PMC free article] [PubMed] [Google Scholar]
- 22.Forouhi NG, Luan J, Hennings S, et al. Incidence of type 2 diabetes in England and its association with baseline impaired fasting glucose: the Ely study 1990–2000. Diabet Med. 2007;24(2):200–207. doi: 10.1111/j.1464-5491.2007.02068.x. [DOI] [PubMed] [Google Scholar]
- 23.Cicero AF, Dormi A, Nascetti S, et al. Relative role of major risk factors for type 2 diabetes development in the historical cohort of the Brisighella Heart Study: an 8-year follow-up. Diabet Med. 2005;22(9):1263–1266. doi: 10.1111/j.1464-5491.2005.01485.x. [DOI] [PubMed] [Google Scholar]
- 24.World Health Organization . Use of glycated haemoglobin (HbA1c) in the diagnosis of diabetes mellitus. Geneva: WHO; 2011. http://www.who.int/diabetes/publications/report-hba1c_2011.pdf (accessed 24 Sep 2015). [PubMed] [Google Scholar]
- 25.Costa B, Barrio F, Piñol JL, et al. Shifting from glucose diagnosis to the new HbA1c diagnosis reduces the capability of the Finnish Diabetes Risk Score (FINDRISC) to screen for glucose abnormalities within a real-life primary healthcare preventive strategy. BMC Med. 2013;11:45. doi: 10.1186/1741-7015-11-45. [DOI] [PMC free article] [PubMed] [Google Scholar]
- 26.Freemantle N, Holmes J, Hockey A, et al. How strong is the association between abdominal obesity and the incidence of type 2 diabetes? Int J Clin Pract. 2008;62(9):1391–1396. doi: 10.1111/j.1742-1241.2008.01805.x. [DOI] [PMC free article] [PubMed] [Google Scholar]
- 27.Pani LN, Korenda L, Meigs JB, et al. Effect of aging on A1C levels in individuals without diabetes: evidence from the Framingham Offspring Study and the National Health and Nutrition Examination Survey 2001–2004. Diabetes Care. 2008;31(10):1991–1996. doi: 10.2337/dc08-0577. [DOI] [PMC free article] [PubMed] [Google Scholar]
- 28.Noble D, Mathur R, Dent T, et al. Risk models and scores for type 2 diabetes: systematic review. BMJ. 2011;343:d7163. doi: 10.1136/bmj.d7163. [DOI] [PMC free article] [PubMed] [Google Scholar]
- 29.Gray LJ, Khunti K, Edwardson C, et al. Implementation of the automated Leicester Practice Risk Score in two diabetes prevention trials provides a high yield of people with abnormal glucose tolerance. Diabetologia. 2012;55(12):3238–3244. doi: 10.1007/s00125-012-2725-8. [DOI] [PubMed] [Google Scholar]


