Abstract
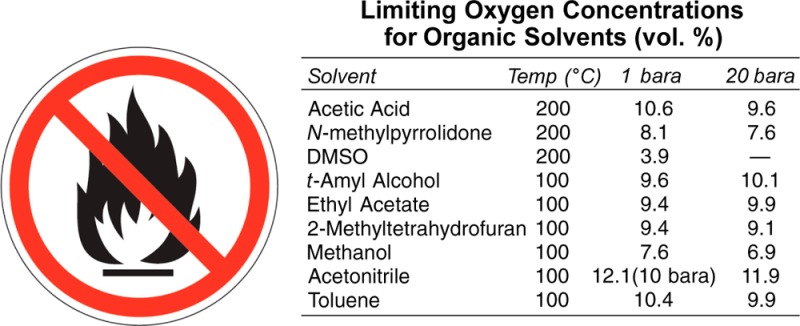
Applications of aerobic oxidation methods in pharmaceutical manufacturing are limited in part because mixtures of oxygen gas and organic solvents often create the potential for a flammable atmosphere. To address this issue, limiting oxygen concentration (LOC) values, which define the minimum partial pressure of oxygen that supports a combustible mixture, have been measured for nine commonly used organic solvents at elevated temperatures and pressures. The solvents include acetic acid, N-methylpyrrolidone, dimethyl sulfoxide, tert-amyl alcohol, ethyl acetate, 2-methyltetrahydrofuran, methanol, acetonitrile, and toluene. The data obtained from these studies help define safe operating conditions for the use of oxygen with organic solvents.
Introduction
Oxidation is common in organic synthesis, yet it is often avoided in the large-scale production of pharmaceuticals because many of the reagents and methods for oxidations have difficulties or limitations on a large scale.1 Toxic metals, halogenated solvents, difficult-to-handle byproducts, and poor atom economy remain the hallmarks of many existing oxidation methods, so the raw materials for the manufacture of pharmaceuticals are often bought at the required (or higher) oxidation state in order to avoid oxidations. The use of molecular oxygen would seem to be a natural solution to this problem, where aerobic oxidations could provide the benefit of atom economy from the use of oxygen and offer greater synthetic flexibility by expanding the scope of viable oxidations for pharmaceutical synthesis. Aerobic oxidations are employed in a number of commodity-scale chemical processes;2 however, they are rarely used in pharmaceutical synthesis.3 Recent advances in synthetic methodology are making the case for such reactions increasingly compelling.4 Nevertheless, large-scale applications of aerobic oxidation are still limited by at least two factors: (1) the combination of organic solvent and oxygen gas can represent a significant safety hazard, and (2) few aerobic oxidation catalysts or methods exhibit sufficient activity and selectivity to be considered for production of pharmaceutical compounds and intermediates.
In early 2012, a precompetitive collaboration among pharmaceutical companies and university researchers was initiated to promote the development and application of aerobic oxidations for process-scale synthesis and manufacturing.5 Research within this consortium has included the development of aerobic alcohol oxidation methods that show significant promise for pharmaceutical applications.6,7 In parallel with these efforts, it was necessary to establish relevant process parameters to achieve safe implementation of such reactions on scale.8
Aerobic oxidation reactions present unique process safety challenges. Chemical reactions in pharma usually require organic solvents, with vapors that are flammable in the presence of air or oxygen. In addition, most known aerobic oxidation methods require elevated temperatures and pressures to achieve reasonable reaction rates. These factors limit the range of conditions acceptable for both safe and practical aerobic oxidation of complex molecules in organic solvents.
A fuel/oxidizer (i.e., solvent vapor/oxygen) mixture is capable of combustion if sufficient fuel, oxidizer, and ignition energy are present (i.e., if the fire triangle is satisfied). Elimination of ignition sources alone is an inadequate basis to ensure safe operations, especially at elevated pressure and temperature, where minimum ignition energies are lower and reliable prevention of ignition sources is exceedingly difficult.9,10 Various safety measures may be considered when performing aerobic oxidations, but one of the most practical approaches is to operate below the limiting oxygen concentration (LOC) of the organic solvent and/or reagents used in a chemical reaction. Unfortunately, there is a paucity of published flammability data for common organic solvents, especially at the elevated temperatures and pressures anticipated for pharmaceutical processes,11−13 and this knowledge gap represents a significant impediment to the application of aerobic oxidations. Here we report the experimental determination of LOCs for nine organic solvents at elevated temperatures and pressures relevant to the performance of aerobic oxidations. The availability of these data should facilitate the safe use of oxygen as a green oxidant in pharmaceutical process research and manufacturing.
Experimental Section
General Considerations
Ultrahigh purity (UHP)-grade nitrogen (minimum purity 99.999%) and dry synthetic air, containing 20.95% oxygen and 79.05% nitrogen, were used in the gas preparation. All of the organic solvents tested had a minimum purity of 99.5% or higher. In order to ensure consistency between the data obtained here and other documented flammability data, the test methodology utilized guidelines established in ASTM E2079 (2013).14
Flammability Apparatus
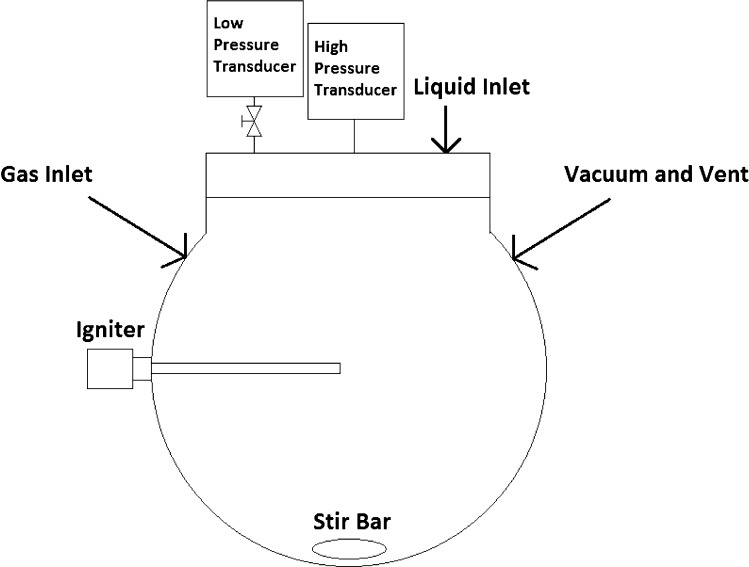
The testing was conducted using the apparatus depicted in Figure 1, which consists of a 5.3 L spherical vessel (rated to 5000 psi at 200 °C) equipped with two pressure transducers: a low-range pressure transducer used to prepare the gas mixtures by partial pressure (0.05% full-scale accuracy with a range of 0–25, 0–200, or 0–300 psia) and a high-accuracy, high-range pressure transducer used to monitor the pressure after ignition (0.05% full-scale accuracy with a range of 0–200 or 0–1000 psia). Two thermocouples were placed in the vessel to measure the temperature at the center and upper regions of the vessel. A stir bar was placed at the bottom of the vessel to mix the gases. The gas mixture was ignited using an exploding fuse wire positioned at the center of the vessel. The fuse wire was either 40 gauge tinned copper or nichrome, and the energy provided by the fuse wire was approximately 10 J (the 10 J ignition energy was chosen because it produces very little wire spatter and is above the 5 J/cm threshold needed to form a cylindrical shock wave upon vaporization of the wire).15 During the course of testing with acetic acid, some corrosion was observed on the tinned copper wire, leading to the formation of solid particulates and loss of connection with the electrodes. Consequently, nichrome fuse wire was used for collection of all LOC data for acetic acid, and the tinned copper fuse wire was used for all of the other solvents.
Figure 1.
Experimental 5.3 L testing apparatus for determining limiting oxygen concentrations.
Measurement of Limiting Oxygen Concentrations for Organic Solvents
The 10 mm, 40 gauge tinned copper (or nichrome) fuse wire was wrapped around the igniter electrodes, and the vessel was sealed and checked for leaks by pressurizing to 4–5 bara beyond the testing pressure. The vessel was then subjected to three to five vacuum/N2 purge cycles. The gas manifold and piping used to deliver the gases and solvent to the vessel were also evacuated and backfilled with the appropriate gas/solvent to minimize contamination by other gases and remove residual water vapor.
The concentrations of O2 and N2 gases and solvent vapors were calculated on the basis of an assumption of ideal behavior using partial pressure addition. Prior to filling, the vessel was evacuated to approximately 0.012 bara (0.2 psia) N2, after which the liquid solvent (quantity calculated to produce the desired solvent vapor pressure upon complete vaporization), air, and nitrogen were added to the vessel to achieve the desired concentrations of the three components (O2, N2, and solvent). During addition, there was a slight temperature rise due to compression of the gases. Therefore, after each gas addition, the mixture was allowed to reach equilibrium before the pressure was recorded.
Once the mixture was prepared, the magnetic stirrer was turned on to ensure a homogeneous mixture of the solvent vapor and the gases. After approximately 5 min, the stirrer was turned off to allow the mixture to relax prior to ignition, ensuring that a quiescent mixture was tested rather than a turbulent mixture. The low-pressure transducer valve was closed and the data collection started, followed by firing of the fuse wire (10 J). The pressure and temperature in the vessel were recorded continuously before and after (attempted) ignition. In accordance with standards established in ASTM E2079 (2013), the mixture was considered to be flammable if ignition led to a pressure rise of greater than or equal to 7%.
Control experiments carried out with the vessel filled with 1, 10, and 20 bara nitrogen showed that the 10 J ignition event contributes negligibly to pressure changes within the vessel (only a few millibar at 1 bara and no measurable pressure rise at 10 or 20 bara). As a result, no correction was needed to account for the ignition source. The LOC values for propane and hydrogen were determined to evaluate the experimental protocol and equipment. As shown in Table 1, the measured values compare favorably with reported literature values.
Table 1. Control experiments comparing measured LOC data for propane and hydrogen with literature dataa.
| LOC
(vol %) |
||
|---|---|---|
| gas | measured | lit.16 |
| propane | 10.4 | 10.7 |
| hydrogen | 4.6 | 4.6 |
Literature results were obtained in a 120 L spherical vessel with a capacitive spark ignition source (58 J) located in the center of the vessel. Because of inefficiencies in the transformer circuit, the actual energy in the spark gap was considerably lower. See ref (16) for details.
Results and Discussion
In the present study, the Consortium members selected nine organic solvents commonly used in pharmaceutical process research and manufacturing for systematic LOC testing: acetic acid (AcOH), N-methylpyrrolidone (NMP), dimethyl sulfoxide (DMSO), acetonitrile, tert-amyl alcohol, ethyl acetate (EtOAc), methanol, 2-methyltetrahydrofuran (2-MeTHF), and toluene.17 The LOC tests followed the approach recommended in ASTM E2079 (2013),14 as detailed in the Experimental Section. Briefly, liquid solvent was added to a temperature-controlled spherical pressure vessel, followed by addition of O2 and N2 gases to achieve the desired total pressure and ratio of gases above and below the estimated LOC of the solvent. Test temperatures were chosen to achieve solvent vapor pressures in excess of the fuel concentrations at the LOCs, thereby allowing fuel concentrations to be varied around the optimum values. The majority of the testing was carried out at 100 °C; however, AcOH, NMP, and DMSO were tested at 200 °C to achieve adequate solvent vapor pressure. Total pressures of 1 and 20 bara were evaluated for most solvents, as well as 10 bara with acetonitrile and toluene, to assess the influence of pressure on the LOC.
Historical data suggest that the LOC typically occurs at a fuel concentration near or slightly above the lower flammability limit (LFL) of the organic liquid solvent at an equivalence ratio (actual oxygen-to-fuel ratio/stoichiometric oxygen-to-fuel ratio) of 1–1.518 and at an oxygen concentration of approximately 10–12 vol %. This consideration was used to provide approximate starting values for the different solvent and oxygen concentrations in the flammability testing. The fuel and oxygen concentrations were then adjusted until the LOC was identified, as elaborated below.
The flammability of the gas mixtures was determined by monitoring the pressure in the vessel upon attempted ignition with a 10 J fuse wire. The resulting flammability/nonflammability data were mapped onto plots of vol % oxygen concentration versus vol % solvent concentration, and the LOC was estimated according to the calculation method given in ASTM E2079. The calculation is based on eq 1, where L is the lowest oxygen concentration for which flame propagation is possible and H is the highest oxygen concentration for which flame propagation is not possible at a given fuel concentration.14
| 1 |
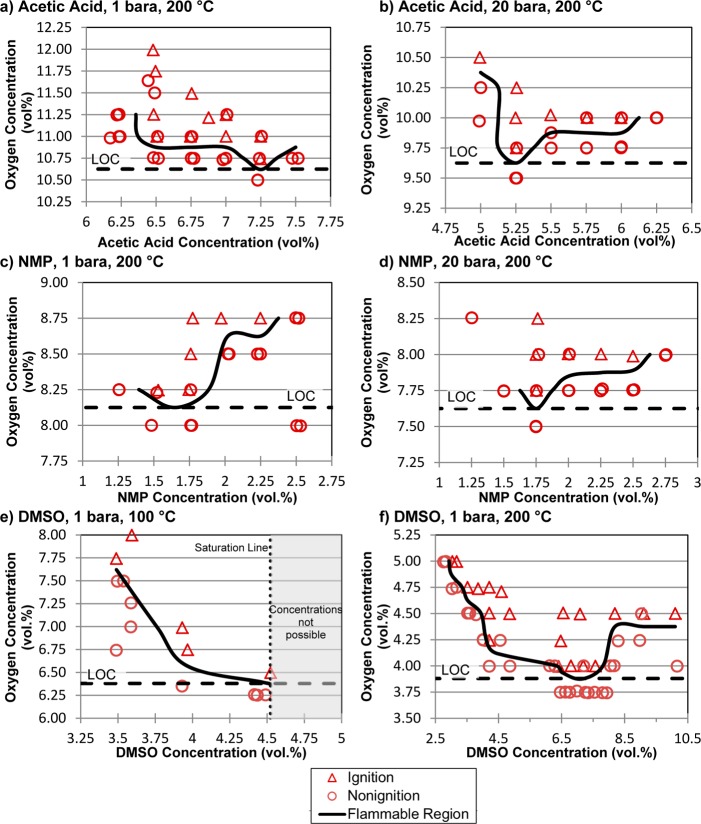
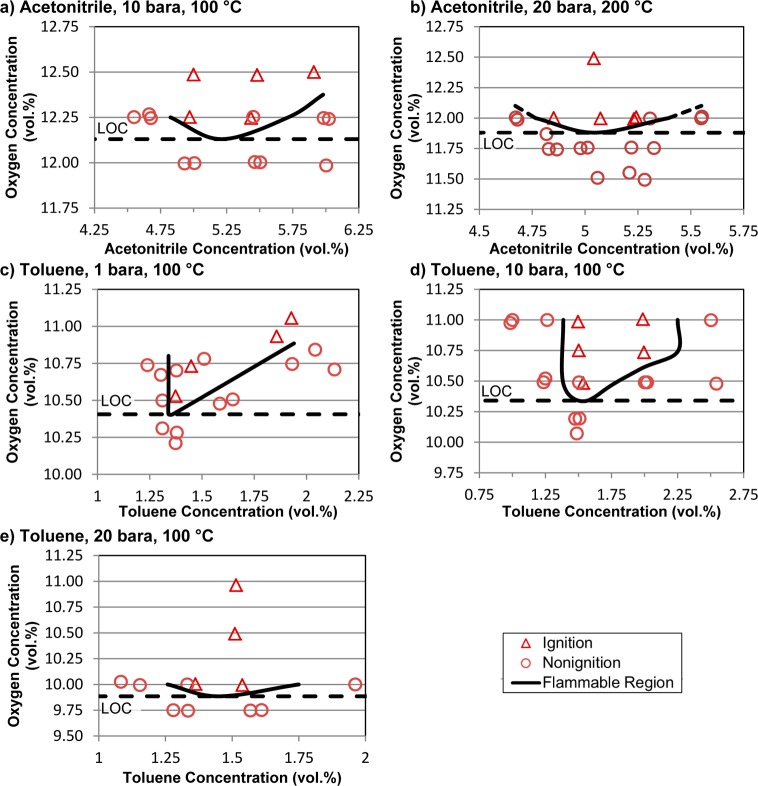
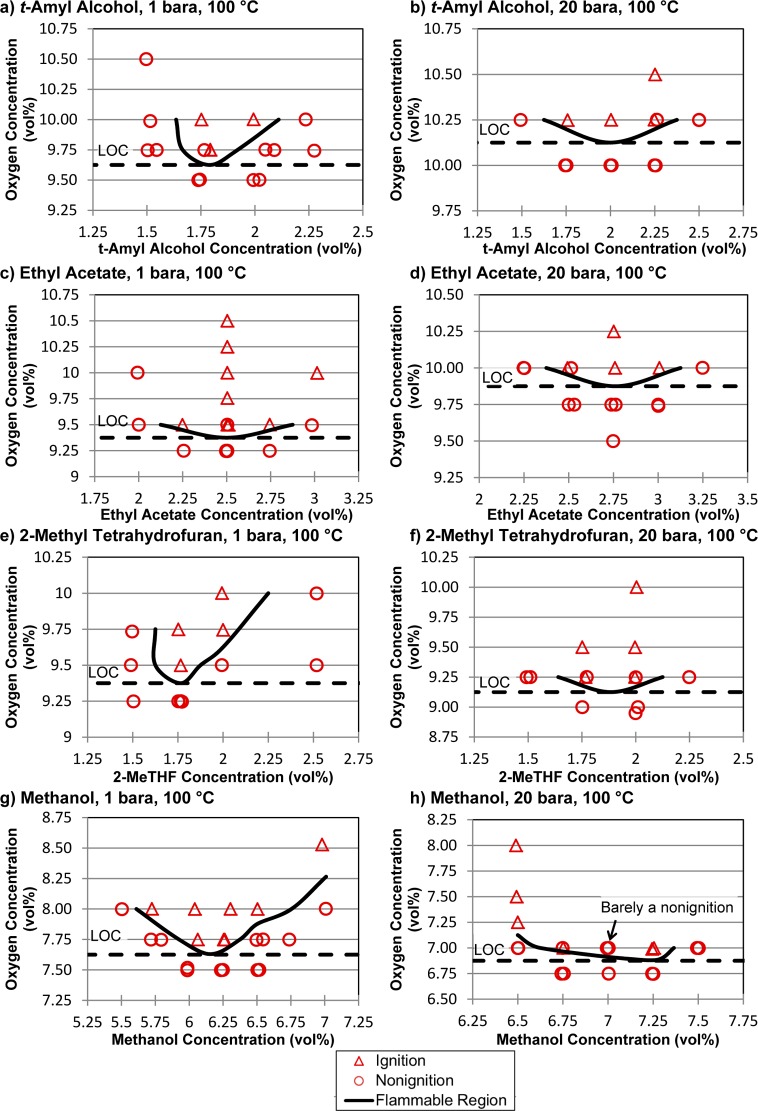
A brief summary of the data for the individual solvents follows, together with plots of the flammability results (Figures 2–4). In the figures, triangles are used to designate conditions that led to ignition of the solvent/gas mixtures, while circles designate conditions that did not lead to ignition. A line is included in the graphs to represent the approximate boundary between oxygen/solvent concentrations that lead to ignition and nonignition. Under conditions close to this boundary, variable ignition/nonignition outcomes can be observed because of the limits of accuracy in measuring the fuel and oxygen concentrations and total and final pressures as well as potential variability among the ignition and flame propagation of the fuel mixture. The LOC in each set of experiments is defined as the midpoint between the lowest oxygen concentration at which ignition occurs and the highest oxygen concentration at which ignition does not occur (cf. eq 1; also see ASTM E2079).
Figure 2.
Experimental determination of LOCs for acetic acid, NMP, and DMSO at 200 °C and at 1 and 20 bara pressure. DMSO was not tested at 20 bara pressure because of spontaneous decomposition/ignition of the solvent at elevated pressures.
Figure 4.
Experimental determination of LOCs for acetonitrile and toluene.
The LOC experiments for acetic acid, NMP, and DMSO were conducted at a temperature of 200 °C and at pressures of 1 and 20 bara (Figure 2). The results from attempted ignition of 35 individual AcOH/oxygen mixtures are depicted in Figure 2a. The variability in the ignition/nonignition outcomes near the flammability boundary is evident from the two circles at oxygen concentrations of 11.5–11.7 vol % in a region of mostly triangles. The LOC under these conditions (1 bara and 200 °C) was identified at an acetic acid concentration of 7.3% and corresponds to 10.6% oxygen (Figure 2a). A lower LOC of 9.6% oxygen was found for acetic acid at higher pressure of 20 bara (Figure 2b). The LOC for NMP was determined to be 8.1% oxygen at 1 bara, which was found over an NMP concentration range of 1.5–1.75% NMP, while the LOC at 20 bara is 7.6% oxygen at 1.75% NMP (Figure 2c,d).
Measurement of the LOC for DMSO was conducted at 100 and 200 °C at a pressure of 1 bara (Figure 2e,f), but a true LOC could not be determined at 100 °C because it was not possible to access DMSO concentrations higher than 4.5%.19 The LOC is almost certainly lower than the value of 6.4% oxygen shown in Figure 2e. The LOC at 200 °C is 3.9% oxygen, which was found over a DMSO concentration range of 6.25–7.50%.
Testing was attempted for DMSO at 20 bara, but it was discontinued because of experimental difficulties and uncertainty with the data. These tests were performed at a higher initial temperature of 230 °C in order to obtain the appropriate fuel concentrations needed to determine the LOC. Testing under these conditions, however, revealed spontaneous decomposition of the solvent, resulting in a gradual increase in the measured pressure prior to attempted ignition. Further testing revealed that mixtures with DMSO and air spontaneously ignite at elevated pressures in this temperature range. This observation is consistent with the reported autoignition temperature of 206 °C for DMSO in air.20
The solvents tert-amyl alcohol, ethyl acetate, 2-MeTHF, and methanol had adequate vapor pressure at 100 °C to test at this temperature, and LOC experiments were performed at pressures of 1 and 20 bara (Figure 3). The LOCs identified for tert-amyl alcohol, ethyl acetate, and 2-MeTHF ranged from 9.1 to 10.1%, with relatively small pressure effects (Figure 3a–f). The tert-amyl alcohol and ethyl acetate LOCs increased by 0.5% as the pressure increased from 1 to 20 bara, while that of 2-MeTHF decreased by 0.3% at higher pressure. Methanol exhibited significantly lower LOCs of 7.6 and 6.9% oxygen at pressures of 1 and 20 bara, respectively. These values may be compared to the previously reported LOC of 8.6% oxygen, determined by Brooks and Crowl11 under ambient conditions (25 °C and 1 bara pressure).
Figure 3.
Experimental determination of LOCs for tert-amyl alcohol, ethyl acetate, 2-methyltetrahydrofuran, and methanol.
Experiments with acetonitrile were conducted at a temperature of 100 °C and revealed relatively high LOCs of 12.1 and 11.9% oxygen at pressures of 10 and 20 bara (Figure 4a,b). These values are somewhat lower than the previously reported LOC of 12.7% determined at 25 °C and 1 bara pressure.11 Experiments with toluene were carried out at a temperature of 100 °C and pressures of 1, 10, and 20 bara. The LOCs decreased from 10.4 to 10.3 to 9.9% oxygen as the pressure increased (Figure 4c–e). The previously reported LOC determined at 25 °C and 1 bara pressure is 11.6%.11
A summary of the results obtained from these experiments is provided in Table 2. For most of the solvents, the LOC decreases by approximately 0.5–1% oxygen as the pressure increases from 1 to 20 bara; however, the values for tert-amyl alcohol and ethyl acetate increase by 0.5% when the pressure increases. Studies of other materials have indicated that the LOC typically decreases with increasing pressure,12 although early studies may have been influenced by wall quenching effects.18 Comparison of the results for three solvents analyzed by Brooks and Crowl11 at 1 atm and 25 °C (methanol, acetonitrile, and toluene) revealed that increased temperature and/or pressure resulted in a modest decrease in the LOC. The increase in flammability at higher temperature is expected (cf. the Burgess–Wheeler rule).12
Table 2. Summary of experimental and literature LOC data.
| limiting oxygen concentration (vol %) |
|||||
|---|---|---|---|---|---|
| measureda |
lit.11 | ||||
| solvent | T (°C) | 1 bara | 10 bara | 20 bara | 1 bara, 25 °C |
| acetic acid | 200 | 10.6 | – | 9.6 | |
| NMP | 200 | 8.1 | – | 7.6 | |
| DMSO | 200 | 3.9 | – | NDc | |
| DMSO | 100 | 6.4b | – | – | |
| tert-amyl alcohol | 100 | 9.6 | – | 10.1 | |
| ethyl acetate | 100 | 9.4 | – | 9.9 | |
| 2-MeTHF | 100 | 9.4 | – | 9.1 | |
| methanol | 100 | 7.6 | – | 6.9 | 8.6 |
| acetonitrile | 100 | – | 12.1 | 11.9 | 12.7 |
| toluene | 100 | 10.4 | 10.3 | 9.9 | 11.6 |
These values have a precision of ±0.2%, which considers the concentration interval of testing and the accuracy of the transducers.
Because of insufficient fuel concentration at this temperature, it was not possible to determine an LOC.
It was not possible to test DMSO at 200 °C at the optimum fuel concentration.
Various methods are available to estimate solvent LOCs.21 The calculated adiabatic flame temperature (CAFT) method has been used to estimate flammability properties of different materials. As a general rule, if the adiabatic flame temperature is calculated to be greater than or equal to 1200 K, the mixture is considered to be flammable.22 Flame temperatures were calculated according to this method for each solvent under different conditions using a commercially available software program,23 and the results were used to estimate LOC values. In general, the CAFT method based on 1200 K was found to significantly underestimate the LOCs for these solvents24 (except for DMSO), and the calculated LOC occurs at a different fuel concentration. Similar observations have been made by others,11 and the use of a higher temperature criterion based on LFL or other available information is more suitable.25 Nevertheless, the CAFT-based LOC values provide a conservative estimate that may be suitable for preliminary process safety assessment.
Statistical Analysis
The experimental data presented above were subjected to logistic regression analysis to determine the probability of ignition, P(o), for a given oxygen concentration, o, at a specific solvent concentration.26 The logistic regression function is given in eq 2, where β0 and β1 are coefficients estimated by maximizing the likelihood function, L, defined in eq 3, in which xi is the result for the ith test (ignition = 1 and nonignition = 0).
| 2 |
| 3 |
Analysis of the data set from ethyl acetate at 1 bara and 100 °C (cf. Figure 3c) is presented as an example in Figure 5. The analysis shows that for a concentration of 2.5 vol % ethyl acetate at 1 bara and 100 °C, the ignition probabilities are 10% and 50% for oxygen concentrations of 9.40 and 9.46 vol %, respectively. By applying analyses of this type to the other solvents, we obtained oxygen concentrations that lead to a <5% probability of ignition under the conditions tested (Table 3). These values are quite close to the experimental LOCs obtained by using eq 1 (cf. Table 2). When performing aerobic oxidations, an appropriate safety margin should be considered to account for process fluctuations. For processes where the oxygen concentration is continuously monitored, NFPA 6927 requires a minimum safety margin of 2 vol % below the LOC when the LOC is ≥5 vol %. Additional requirements are specified by NFPA 69 and should be consulted when applying LOCs in process operation design.
Figure 5.
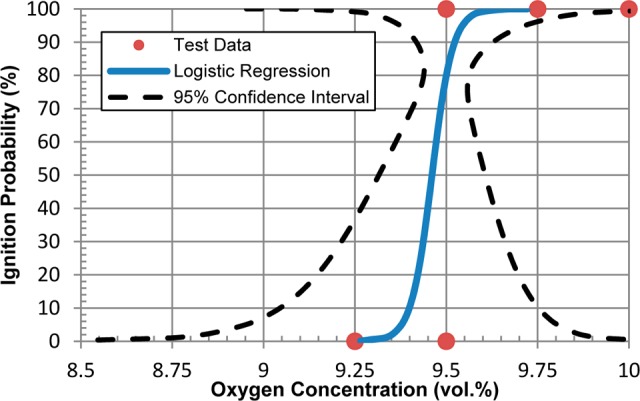
Logistical regression analysis of the data for ethyl acetate at 1 bara and 100 °C shown in Figure 3c.
Table 3. Oxygen concentrations at which there is a <5% probability of ignition for different solvents under the indicated conditionsa.
| oxygen
concentration with <5% probability of ignition (vol %)a |
||||
|---|---|---|---|---|
| solvent | T (°C) | 1 bara | 10 bara | 20 bara |
| acetic acid | 200 | 10.3 | – | 9.6 |
| NMP | 200 | 8.2b | – | 7.2 |
| DMSO | 200 | 3.9 | – | – |
| DMSO | 100 | 6.3 | – | – |
| tert-amyl alcohol | 100 | 9.7b | – | 10.0 |
| ethyl acetate | 100 | 9.3 | – | 9.8 |
| 2-MeTHF | 100 | 9.3 | – | 9.1 |
| methanol | 100 | 7.5 | – | 6.9 |
| acetonitrile | 100 | – | 12.0 | 11.8 |
| toluene | 100 | 10.1 | 10.3 | 9.8 |
Conclusion
Aerobic reactions requiring an organic solvent will be flammable if the oxygen concentration is sufficiently high and the solvent concentration is within the flammable limits at the selected oxygen concentration. Organic solvents (and other chemicals and/or fuels) are not flammable at any concentration when the oxygen concentration is below their limiting oxygen concentration (LOC). In this study, we have determined LOCs for a number of commonly used organic solvents, and the data presented above provide a valuable starting point for safe operation of aerobic oxidation reactions.
We anticipate that these data will be especially relevant to pharmaceutical and other research and process applications that involve short-term campaigns in nonspecialized, multipurpose batch or flow equipment, where available resources do not permit the design and implementation of automated operation protocols and other engineering optimizations to ensure safe operation. For such smaller and/or shorter-term processes, it will often be more practical and cost-effective to operate below the LOC by diluting the oxygen and solvent vapor with an inert gas such as N2. Of course, every system will need to be fully evaluated to achieve safe operation, and several layers of safety should be incorporated into any given process. For example, it will be important to ensure that the LOC is not exceeded anywhere in a process or production facility at any time, and additional attention will need to be given to certain solvents, such as ethers and amides, to avoid the buildup of solvent-derived peroxides under aerobic reaction conditions.28 Together with such additional considerations, the LOC data presented herein should facilitate research and applications of aerobic oxidation reactions for pharmaceutical development and manufacturing.
Acknowledgments
The authors thank T. J. Frawley (Fauske & Associates) for collecting much of the LOC data to complete this study. Funding for this work was provided by Merck (New Technologies Review and Licensing Committee), Eli Lilly (Small Molecule Design and Development Technology Council), and Pfizer. S.S.S. thanks the NIH (R01 GM067173 and R01 GM100143) and DOE (DE-FG02-05ER15690) for funding aerobic oxidation catalysis research related to this study.
The authors declare no competing financial interest.
Funding Statement
National Institutes of Health, United States
References
- a Constable D. J. C.; Dunn P. J.; Hayler J. D.; Humphrey G. R.; Leazer J. L.; Linderman R. J.; Lorenz K.; Manley J.; Pearlman B. A.; Wells A.; Zaks A.; Zhang T. Y. Green Chem. 2007, 9, 411–420. [Google Scholar]; b Carey J. S.; Laffan D.; Thomson C.; Williams M. T. Org. Biomol. Chem. 2006, 4, 2337–2347. [DOI] [PubMed] [Google Scholar]; c Caron S.; Dugger R. W.; Ruggeri S. G.; Ragan J. A.; Ripin D. H. B. Chem. Rev. 2006, 106, 2943–2989. [DOI] [PubMed] [Google Scholar]
- Cavani F.; Teles J. H. ChemSusChem 2009, 2, 508–534. [DOI] [PubMed] [Google Scholar]
- For published examples, see:; a LaPorte T. L.; Hamedi M.; DePue J. S.; Shen L. F.; Watson D.; Hsieh D. Org. Process Res. Dev. 2008, 12, 956–966. [Google Scholar]; b Witt A.; Teodorovic P.; Linderberg M.; Johansson P.; Minidis A. Org. Process Res. Dev. 2013, 17, 672–678. [Google Scholar]; c Bowman R. K.; Brown A. D.; Cobb J. H.; Eaddy J. F.; Hatcher M. A.; Leivers M. R.; Miller J. F.; Mitchell M. B.; Patterson D. E.; Toczko M. A.; Xie S. J. Org. Chem. 2013, 78, 11680–11690. [DOI] [PubMed] [Google Scholar]
- For recent developments in the area of aerobic oxidation methods, see the following reviews:; a Stahl S. S. Angew. Chem., Int. Ed. 2004, 43, 3400–3420. [DOI] [PubMed] [Google Scholar]; b Punniyamurthy T.; Velusamy S.; Iqbal J. Chem. Rev. 2005, 105, 2329–2363. [DOI] [PubMed] [Google Scholar]; c Gligorich K. M.; Sigman M. S. Chem. Commun. 2009, 3854–3867. [DOI] [PMC free article] [PubMed] [Google Scholar]; d Shi Z. Z.; Zhang C.; Tang C. H.; Jiao N. Chem. Soc. Rev. 2012, 41, 3381–3430. [DOI] [PubMed] [Google Scholar]; e Campbell A. N.; Stahl S. S. Acc. Chem. Res. 2012, 45, 851–863. [DOI] [PMC free article] [PubMed] [Google Scholar]
- The University of Wisconsin-Madison Oxidation Consortium (MadOx) was formed in April 2012 with member companies Eli Lilly and Co., Pfizer, and Merck. [Google Scholar]
- a Lauber M. B.; Stahl S. S. ACS Catal. 2013, 3, 2612–2616. [Google Scholar]; b Greene J. F.; Hoover J. M.; Mannel D. S.; Root T. W.; Stahl S. S. Org. Process Res. Dev. 2013, 17, 1247–1251. [Google Scholar]; c Steves J. E.; Stahl S. S. J. Am. Chem. Soc. 2013, 135, 15742–15745. [DOI] [PMC free article] [PubMed] [Google Scholar]; d Kim J.; Stahl S. S. ACS Catal. 2013, 3, 1652–1656. [DOI] [PMC free article] [PubMed] [Google Scholar]
- Also see:Hoover J. M.; Stahl S. S. J. Am. Chem. Soc. 2011, 133, 16901–16910. [DOI] [PMC free article] [PubMed] [Google Scholar]
- Early collaborative efforts focused on the development of continuous-flow methods suitable for scalable application of aerobic oxidation. See:Ye X.; Johnson M. D.; Diao T.; Yates M. H.; Stahl S. S. Green Chem. 2010, 12, 1180–1186. [DOI] [PMC free article] [PubMed] [Google Scholar]
- Kubota H.; Umekawa A.; Tanaka Y.; Makita T. Anzen Kogaku 1979, 18, 264–270. [Google Scholar]
- Lewis B.; von Elbe G.. Combustion, Flames and Explosions of Gases, 3rd ed.; Academic Press: New York, 1987; p 339. [Google Scholar]
- Brooks M. R.; Crowl D. A. J. Loss Prev. Process Ind. 2007, 20, 144–150. [Google Scholar]
- Zabetakis M. G.Flammability Characteristics of Combustible Gases and Vapors; Bulletin 627, Bureau of Mines, NTIS AD701576; U.S. Department of the Interior: Washington, DC, 1965. [Google Scholar]
- For an assessment of flammability hazards and safety considerations for biocatalytic aerobic oxidations that employ mixed organic/aqueous solvents, see:Schmid A.; Kollmer A.; Sonnleitner B.; Witholt B. Bioprocess Eng. 1999, 20, 91–100. [Google Scholar]
- ASTM E2079 Standard Test Methods for Limiting Oxygen (Oxidant) Concentration in Gases and Vapors; American Society for Testing and Materials: Philadelphia, PA, 2013. [Google Scholar]
- Mashuga C. V. Determination of the Combustion Behavior for Pure Components and Mixtures Using a 20-Liter Sphere. Ph.D. Thesis, Michigan Technological University, Houghton, MI, April 1999. [Google Scholar]
- Zlochower I. A.; Green G. M. J. Loss Prev. Process Ind. 2009, 22, 499–505. [Google Scholar]
- It would not be practical to test all possible solvents and conditions of potential relevance and interest. The nine solvents and the temperature/pressure conditions investigated in this study were selected as the representative cases of greatest interest to the Consortium members. Methodology similar to that described here could be applied to examples of specific interest as circumstances arise.
- Britton L. G. Process Saf. Prog. 2002, 21, 31–54. [Google Scholar]
- The vapor pressure of DMSO at 100 °C is approximately 0.0494 bar, which corresponds to a concentration of 4.9%. It is believed that the lower DMSO concentration of approximately 4.5% achieved at 100 °C is a result of the temperature being slightly below 100 °C. See:; Rowley R. L.; Wilding W. V.; Knotts T. A. IV; Giles N.. DIPPR Data Compilation of Pure Chemical Properties; Design Institute for Physical Properties/AIChE: New York, 2013. [Google Scholar]
- Babrauskas V.Ignition Handbook; Fire Science Publishers, Society of Fire Protection Engineers: Issaquah, WA, 2003. [Google Scholar]
- Examples include the calculated adiabatic flame temperature (CAFT) method (see refs (11)(23), and (25)) and Britton’s heats of oxidation method (see ref (18)).
- Mashuga C. V.; Crowl D. A. Process Saf. Prog. 1999, 18, 127–134. [Google Scholar]
- Gordon S.; McBride B. J.. Computer Program for Calculation of Complex Chemical Equilibrium Compositions and Applications; NASA Reference Publication 1311, 1996.
- LOCs derived from 1200 K-based CAFT analysis are as follows: acetic acid (6.0%), NMP (5.8%), DMSO (6.6% at 100 °C/1 bara), tert-amyl alcohol (6.7%), ethyl acetate (6.7%), 2-MeTHF (6.5%), methanol (6.1%), acetonitrile (6.1%), and toluene (6.7%).
- Razus D.; Molnarne M.; Fuß O. Chem. Eng. Process. 2004, 43, 775–784. [Google Scholar]
- For similar analyses used to determine the probability of ignition at different ignition energy levels, see:; a Bane S. Spark Ignition: Experimental and Numerical Investigation with Application to Aviation Safety. Ph.D. Thesis, California Institute of Technology, Pasadena, CA, May 2010. [Google Scholar]; b Eckhoff R. K.; Ngo M.; Olsen W. J. Hazard. Mater. 2010, 175, 293–297. [DOI] [PubMed] [Google Scholar]
- NFPA 69: Standard on Explosion Prevention Systems; National Fire Protection Association: Quincy, MA, 2014. [Google Scholar]
- Kelly R. J.Chem. Health Saf. 1996. (Sept/Oct), 26–36. [Google Scholar]


