

Abstract
The ability to recognize individuals is essential for many aspects of social interaction and social organization, yet we know relatively little about the neural mechanisms underlying this ability. Most laboratory studies of individual recognition in rodents have studied differential responses to familiar versus unfamiliar individuals rather than differential responses to equally well known individuals having different significance for the subject. In experiment 1, we use a new method for studying true individual recognition in which male hamsters first had different experiences with two stimulus males (exposures to one male across a wire-mesh barrier and fights with another male). One day later, losers of fights were tested in a Y-maze for reactions to one of the two familiar males. Subjects tested with the familiar winner avoided this stimulus male, but subjects tested with the familiar, neutral male were attracted to him. Immunohistochemistry for c-Fos and Egr-1 implicate several areas of the brain in individual recognition, particularly the anterior piriform cortex, the CA1 and CA3 regions of anterior dorsal hippocampus, anterior and posterior dentate gyrus, and perirhinal cortex. In experiment 2, temporary inactivation of the CA1 region of anterior dorsal hippocampus by microinfusion of lidocaine eliminated the avoidance of the familiar winner, but a saline control injection had no effect. These results are the first to use a rodent model to characterize neural circuits involved in the recognition of equally well known individuals and the corresponding emotional responses to them.
Keywords: individual recognition, social memory, olfaction, hippocampus, perirhinal cortex, basolateral amygdala, learned fear
Introduction
The ability to recognize individuals is crucial for establishing stable social relationships, including membership in a group, friendship, pair bonds, social status, dominance hierarchies, territorial networks, and numerous other aspects of social behavior and organization. Thus, some level of ability to discriminate and recognize individuals exists in a wide range of species (Halpin, 1980; Colgan, 1983).
Discrimination and recognition of individuals have been investigated in several mammalian species, including recognition of lambs in the context of nursing (Kendrick et al., 1997), mate recognition and mate preferences in rodents such as mice, voles, and hamsters (Bunnell et al., 1977; Brennan and Keverne, 1997; Johnston, 1998; Petrulis et al., 1999; Yamazaki et al., 2000; Ferguson et al., 2002; Young, 2002), and recognition of faces in sheep and primates (Rolls, 2000; Kendrick et al., 2001). A shortcoming of these studies, however, is that the tasks that were used do not show true individual recognition (i.e., different responses to equally familiar individuals with differing significance to the subject) but rather study a simpler process, recognition of categories of individuals (e.g., familiar vs novel). Although we have shown that hamsters have integrated, multicomponent representations of individuals (Johnston and Jernigan, 1994; Johnston and Bullock, 2001), these experiments did not show different functional responses to different individuals.
Despite the importance of individual recognition, its neural basis is not well understood. The most thoroughly investigated system is recognition of faces in humans and nonhuman primates, in which it has been shown that structures in the temporal lobe (e.g., the fusiform gyrus and hippocampus) are particularly important for the processing of facial stimuli and are involved in the recognition of faces (Fried et al., 1997, 2002). The extent to which the fusiform gyrus is dedicated primarily to the recognition of faces versus objects and faces, or visual expertise in general, has been hotly debated (Kanwisher, 2000; Tarr and Gauthier, 2000). In rodents, different neural structures have been implicated in individual recognition by odors in different contexts. Recognition of a mate by female mice, as measured by the pregnancy block effect caused by a novel male, is mediated in the olfactory bulbs (Brennan and Keverne, 1997), whereas recognition of a familiar mouse in the context of social investigation appears to be mediated in the medial amygdala (MeA) and associated structures (Young, 2002). In the juvenile recognition task in mice, the hippocampus has been implicated (Kogan et al., 2000). In all of these studies, however, the distinction being made is between a familiar individual and a novel individual.
Here we describe a change in a previous method (Lai and Johnston, 2002; Lai et al., 2004) that allows us to measure true individual recognition and to investigate the neural circuits underlying this process by use of staining for the neural activity markers, c-Fos and Egr-1. We also use microinfusion of lidocaine to investigate the role of one brain locus [the CA1 region of anterior dorsal hippocampus (ADHCA1)] to determine whether it is necessary for individual recognition.
Materials and Methods
Experiment 1
Animals and behavioral tests. Golden hamsters (Mesocricetus auratus) were bred and raised in our laboratory colony, which is derived from Charles River stock (Wilmington, MA). Twenty-four male hamsters, 4–11 months of age, were used as subjects; all were sexually and aggressively naive. Eight additional males that had previously won fights with other males were used as stimulus animals to increase the probability that subjects would lose fights with these males. All behavioral testing occurred under dim illumination in testing rooms separate from the animal colony. The Y-maze was constructed with a lid such that air was drawn through the arms (91 × 9 × 13.5 cm) and the stem (73 × 9 × 13.5 cm) of the maze and out through the start box (15 × 9 × 13.5 cm), where subjects were placed to begin a trial. A stimulus animal was placed in a stimulus chamber (15 × 9 × 13.5 cm) at the distal end of one arm of the Y; stimulus chambers were divided from the rest of the Y by an opaque barrier with holes drilled in it so that air could pass through this chamber and down through the stem and through the start chamber by means of a fan mounted just outside the start chamber. The details of the apparatus and behavioral testing procedures have been described previously (Lai and Johnston, 2002; Lai et al., 2004).
The experiment consisted of three phases separated by a 1 d interval between each phase: first, habituation to the Y-maze; second, an experience phase; and third, a test in the Y maze. For habituation to the Y-maze, each subject was placed in a clean Y-maze and allowed to investigate it freely for 5 min. One day later, subjects were randomly assigned to one of three groups (n = 8 in each group) that differed either in the experience they received or in the stimulus animal used in the test trial. In this second phase, the males in groups 1 and 2 had the same experiences. First, each subject was exposed three times for 3 min to a stimulus male across a wire-mesh barrier in a glass-topped cage (36 × 30 × 16 cm); there was a 3 min interval between exposure sessions. Males were returned to their home cages after each encounter. Two hours later, the stimulus males were switched for subjects in groups 1 and 2; subjects in both groups had a series of three interactions with the new stimulus male. The subject and the stimulus male were simultaneously released from plastic beakers in a clean cage (36 × 30 × 16 cm) containing clean bedding. The cage had no top, so that males could jump out of the cage. The two males were allowed to interact with each other until one (the loser) fled and jumped out of the arena or showed an obvious submissive posture (“on back”) (Johnston, 1985) after repeated failures to jump out of the arena. Both males were then returned to their home cages. This aggressive encounter procedure was repeated two more times with 3 min intervals between encounters. Males in group 3, the arena control group, experienced three, 3 min exposures to the arena with the wire mesh and three, 30 s exposures to the clean cage with clean bedding. All of these experiences took place in a room different from the one used for tests in the Y-maze.
One day after the experience phase, subjects were tested in the Y-maze in two, 3 min trials. The first trial (clean trial) was in a clean Y-maze. In the second trial (test trial), groups 1 and 2 had different test conditions. Males in group 1 were tested with the male that defeated them in three fights (the familiar winner); this male was placed in one arm of the Y. Males in group 2 were tested with the male that they had been exposed to across the wire-mesh barrier (the familiar neutral male). Males in group 3, the arena control group, were tested two times in a clean Y-maze.
The following behavioral measures were obtained. During aggressive encounters, we used a stopwatch to obtain the escape latency, defined as the time from initial contact until one male jumped out of the arena or surrendered (showed the on-back posture after repeated, unsuccessful attempts to jump out of the arena). During tests in the Y-maze, several measures were obtained by an observer who did not know the experience of the subjects. With the Observer 3.0 event-recorder program (Noldus Information Technology, Leesburg, VA), we recorded the following: (1) latency from the beginning of the trial until the subject was within 2 cm of each stimulus compartment; (2) the time spent in each of the six sections of the Y-maze (the start box, the stem of the Y, the basal part of each arm of the Y, and the distal part of each arm of the Y, not including the time spent sniffing the stimulus box); and (3) the time spent sniffing the stimulus box, defined as the subject's nose within 2 cm of the stimulus box. In previous papers, we used the time near the stimulus box (i.e., the sum of time spent in the distal part of the arm and the time sniffing the stimulus box) (Lai and Johnston, 2002; Lai et al., 2004), but here we used the time spent sniffing the stimulus box and the time spent in the rest of the distal part of the arm of the Y to describe each subject's behavior in more detail. We also recorded the amount of time spent in the three major parts of the Y (the two arms and the base of the Y), and, as a measure of general activity, we recorded the number of times that subjects crossed the lines between each of the eight sections of the Y-maze.
Sample preparation, immunohistochemistry, and neuron counting. One hour after the end of the second test in the Y-maze, all subjects were processed for immunohistochemistry. The three subjects in a cohort (one from each of the three groups, tested at approximately the same time) were killed at the same time, and a 1 ml blood sample was collected from trunk blood from the right atrium. The blood samples were sent to the Public and Client Services of the Animal Health Diagnostic Laboratory at Cornell Veterinary School for analysis of the concentrations of cortisol and testosterone. The brain section preparation, immunohistochemistry, and neuron counting procedures have been described previously (Lai et al., 2004). Briefly, after collection of blood samples, animals were perfused with Na-PBS through the left ventricle, followed by 4% paraformaldehyde. Immunohistochemistry was performed on free-floating, 40 μm, coronal frozen sections fixed with 4% paraformaldehyde and cryoprotected with 30% sucrose following avidin–biotin protocols (ABC Kit; Vector Laboratories, Burlingame, CA). Sections in a cohort went through exactly the same immunohistochemistry process at the same time. Primary incubation for the first and second of every three sections was performed with polyclonal rabbit antiserum raised against mouse c-Fos and Egr-1, respectively (diluted 1:1000; Santa Cruz Biotechnology, Santa Cruz, CA). The third sections were stained with cresyl violet or reserved for backup sections. Negative controls were performed with normal rabbit IgG antibody (Santa Cruz Biotechnology) and no primary antibody incubation. No staining was found in the examined areas in either the normal IgG control sections or those not treated with primary antibody (data not shown). Labeling was visualized with DAB (1 tablet of 10 mg/140 ml Tris buffer; Sigma, St. Louis, MO) solutions with 0.5 m nickel chloride for 5 min. The stained sections were mounted on coated slides, air dried, and coverslipped.
We analyzed 20 brain areas (Fig. 1) from all subjects (eight subjects per group in three groups). The areas were chosen based on results from our previous study (Lai et al., 2004) and from other publications that implicated areas of the brain in social memory, fear or learned fear, higher-order olfactory processing, or social behavior (Davis, 1994; Bunsey and Eichenbaum, 1995; Kollack-Walker et al., 1997; Gall et al., 1998; Petrulis et al., 1998, 2000; Adolphs, 2001). Anatomical landmarks for each area to be counted were determined with light microscopy (40× and 100× magnification; Nikon E800 microscope, Melville, NY) and the hamster brain atlas (Morin and Wood, 2001). Sections from a cohort of subjects (one from each of the three groups) were selected and photographed at 200× (Spot RT Camera; Diagnostic Instruments, Livingston, UK); the darkness of the background of the three sections from a cohort was adjusted to a similar level. To count the density of stained cells, we first selected what we considered the darkest and the lightest cells in a brain area that were clearly above background in males from group 1. We then used the NIH Image program to highlight the darkest 40% of these neurons and used this darkness as a threshold for that brain area. The same threshold was applied to the comparable sections from cohort males in groups 2 and 3. For each brain area, we selected the size and shape of the area to be counted based on the golden hamster brain atlas (Morin and Wood, 2001) and applied it to the images of the sections in the three groups. An experimenter who was blind to the animal's group counted the number of highlighted neurons (those above the threshold) within each area by using NIH Image.
Figure 1.
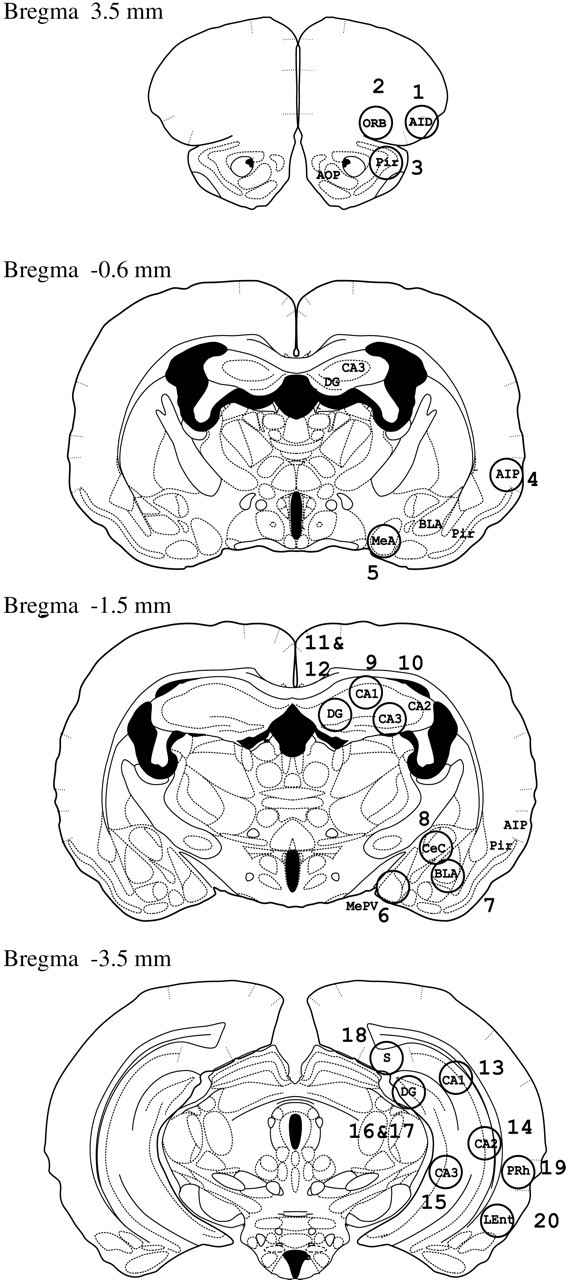
Locations (shown by numbered circles) of the 20 brain areas that we examined in four sections at different locations relative to Bregma, based on the hamster brain atlas of Morin and Wood (2001). The 20 brain areas and abbreviations are as follows: (1) AID, agranular insular cortex, anterior; (2) ORB, orbital cortex; (3) Pir, piriform cortex; (4) AIP, agranular insular cortex, posterior; (5) MeA, medial amygdala; (6) MePV, medial amygdala, posteroventral; (7) BLA, basolateral amygdala; (8) CeC, central amygdala nucleus, capsular; (9) ADHCA1, CA1 region of anterior dorsal hippocampus; (10) ADHCA3; (11) ADHCA4; (12) ADHDG, dentate gyrus of anterior dorsal hippocampus; (13) PDHCA1, CA1 region of posterior dorsal hippocampus; (14) PDHCA2;(15)PVHCA3, CA3 region in posterior ventral hippocampus; (16)PDHCA4; (17)PDHDG, dentate gyrus of posterior dorsal hippocampus; (18) PDS, posterior dorsal subiculum; (19) PRh, perirhinal cortex; and (20) LEnt, lateral entorhinal cortex.
Data analysis. Statistical evaluation of behavioral data and cell counts were performed with one-way ANOVA, two-sample Student's t tests, paired t tests, and correlations (Pearson's test). p < 0.05 was considered statistically significant.
Experiment 2
Animals. A total of nine 4- to 11-month-old male hamsters were used in this experiment. Six sexually and aggressively naive males were used as subjects. Three males that had previously won fights with other males were used as stimulus animals.
Surgery and microinfusion procedure. One week before behavioral testing, subjects were anesthetized with Nembutal (50 mg/kg, i.p.) and implanted unilaterally with a 26 gauge, stainless steel cannula in the ADHCA1 (2.3 mm posterior to Bregma, 2.08 mm lateral to the midline, and 1.65 mm below the dura). Dummy stylets were placed into the guide cannula to prevent debris from entering. On the contralateral side of the brain, a unilateral olfactory bulbectomy was performed via aspiration through a hole in the skull centered 5.9 mm anterior and 1.0 mm lateral to Bregma. This was done so that (1) olfactory information would be available on only one side of the brain and (2) we could therefore implant just one cannula on the side without a lesion. We took this approach because we had difficulty keeping two cannula secured to the skull during and after fights. All animals were allowed at least 7 d of recovery before behavioral testing. On the test day, subjects were gently restrained by hand and received a microinfusion of either saline or 2% lidocaine (0.5 μl) into the ADHCA1. A 32 gauge needle, attached to a 5 μl Hamilton syringe, was inserted into the guide cannula, and drug or saline was infused slowly over the course of 1 min. The needle was left in place for 1 min for additional diffusion before it was removed, and then subjects were returned to their home cages.
Behavioral testing. The apparatus and behavioral testing were the same as in experiment 1, with the exception that subjects had only one social experience (a series of three fights with one stimulus male). One day after the fights, subjects (all of which lost the fights to the stimulus males) were tested in the Y-maze in three, 3-min trials (one clean trial and two test trials). The clean trial was in a clean Y-maze with nothing in the stimulus compartments. Immediately after this control trial, subjects were microinfused with either saline or lidocaine and tested with their familiar winners 3 min later. Three hours later, the subjects were tested in the other injection condition with the familiar winners. The order of the two treatments was balanced across subjects. The same measures of behavior used in experiment 1 were used again.
Histology. At the end of the experiment, animals were killed and perfused transcardially, and their brains were fixed and sectioned coronally (40 μm). The sections were stained with cresyl violet and examined under the microscope to determine the position of the cannula.
Results
Experiment 1
Behavior during exposure phase
During encounters across the wire mesh, all males spent time investigating each other, often moving back and forth together, suggesting that they were aware of the presence of another animal. They also spent time sniffing at the wire mesh (presumably getting information about the other male) and grooming. Two hours after these encounters, each male in groups 1 and 2 fought with a second stimulus male. Encounters started with mutual sniffing, circling, and agonistic postures [including upright and sideways postures (Johnston, 1985)], and then the animals fought until a winner and loser became apparent. All subjects in both groups lost fights to the aggressively experienced stimulus males. Losers generally fled rapidly and jumped out of the arena. In encounters 2 and 3, losers fled immediately after noticing their opponents in the arena (supplemental video, available at www.jneurosci.org as supplemental material). Subjects escaped more quickly in successive encounters (F(2,21) = 82.96; p < 0.001). For males in group 1, the escape latency in encounter 1 (47.58 ± 3.70 s) was significantly longer than in encounter 2 (8.03 ± 1.40 s; t(7) = 12.42; p < 0.001) and encounter 3 (5.97 ± 0.62 s; t(7) = 10.88; p < 0.001). There was no difference in escape latency between encounters 2 and 3. The results for males in group 2 were similar. The escape latencies for encounters 1, 2, and 3 were 68.20 ± 11.4, 8.67 ± 1.06, and 7.39 ± 1.15 s, respectively. The escape latency for encounter 1 was significantly longer than in encounter 2 (t(7) = 5.14; p < 0.001) or encounter 3 (t(7) = 5.42; p < 0.001); again, there was no difference between the escape latency in encounters 2 and 3. There was also no significant difference in the escape latencies between groups 1 and 2 in any of the three encounters. Group 3 (arena control males) remained in the clean arena for the entire 30 s trials, showed no signs of fear, and did not jump out of the arena.
Behavior in the Y-maze tests
Males in group 1, tested with familiar winners as stimulus males, hesitated to move from the start box, avoided going into the arm with the stimulus male, and often sniffed the air coming from the stimulus male and retreated. Specifically, males in group 1 took a much longer time to reach the stimulus box containing the familiar winner than they took to reach the same stimulus box in the clean trial when there was no stimulus male present (Fig. 2A, left) (t(7) = 4.87; p < 0.01). One-way ANOVA revealed a significant group difference in the test trial (F(2,21) = 30.21; p < 0.001). Group 1 took much longer to reach the stimulus box than males in either group 2 (tested with the familiar neutral male; t(14) = 6.24; p < 0.001) or group 3 (tested in a clean maze; t(14) = 5.16; p < 0.001) (Fig. 2A). In addition, males in group 1 spent much less time sniffing at the screen of the stimulus box containing the familiar winner than they did in the clean trial when no hamster odor was present (Fig. 2B, left) (t(7) = 3.25; p < 0.05). They also spent less time in the distal part of the arm (not including time sniffing) with the familiar winner than they did in the clean trial (9.0 ± 3.6 vs 32.5 ± 3.0; t(7) = 4.17; p < 0.001). In contrast, males in group 2 approached the stimulus compartment containing the familiar neutral male with the same short latency as when they approached the end of this arm during the clean trial (Fig. 2A, center), and they spent significantly more time sniffing at the screen of the stimulus box containing the familiar, neutral male than they spent in this area in the clean trial (Fig. 2B, center) (t(7) = 6.96; p < 0.001). Males in group 2 did not show significant differences, however, in the time spent in the distal part of the arm in the clean trial versus the trial with the familiar neutral male (40.5 ± 4.7 vs 44.9 ± 8.3 s). The arena control males were tested two times in clean control trials; their behavior did not differ across trials (Fig. 2A,B).
Figure 2.

Behavior of the three experimental groups (n = 8 each) in experiment 1 during tests in the Y-maze when it was clean (Clean control) and when a stimulus male was present (groups 1 and 2) or again in a clean Y-maze (group 3). A, Comparisons of behavior across groups during the clean trial and test trial: the mean (± SEM) latency from the beginning of a trial until the males reached the screen at the end of the arm that was either the preferred arm (clean trial) or this same arm with a stimulus male (test trial). B, The mean (± SEM) amount of time sniffing at the screen of the stimulus box in the clean trial and test trial. C, The mean (± SEM) number of times that males in the three groups crossed the lines between the eight sections of the Y-maze during the clean trial and test trial: group 1 (left; tested with a familiar winner), group 2 (center; tested with a familiar neutral male), and group 3 (right; arena control group, tested in clean Y-maze; no stimulus male present). *p < 0.05.
Comparing across groups, one-way ANOVA revealed that there were significant differences in the time spent sniffing the stimulus box (F(2,21) = 19.83; p < 0.001). Males in group 1 spent significantly less time sniffing at the screen of the stimulus box containing the familiar winner than did the males in group 2 (t(14) = 8.46; p < 0.001) (Fig. 2B), and they also spent less time in this activity than males in group 3 spent sniffing a clean stimulus compartment (t(14) = 2.95; p < 0.05) (Fig. 2B). These comparisons are additional evidence for avoidance of the familiar winner. Group 2 males spent significantly more time sniffing at the screen of the stimulus box containing the familiar neutral males than the males in group 3 did sniffing at a clean stimulus compartment, indicating an attraction of group 2 males to the familiar neutral males (t(14) = 2.78; p < 0.05). In terms of general activity, there were no significant differences across groups in either the clean trial or the test trial and no differences for any group across stimulus conditions (Fig. 2C).
Another measure of interest was the total time spent in the three major parts of the Y-maze (stimulus arm, clean arm, and base of the Y) during the 3 min test trial. For group 1, the times spent in the stimulus arm, clean arm, and base of the Y were 27.3 ± 10.1, 82.7 ± 15.4, and 70.0 ± 14.6 s, respectively; for group 2, they were 108.7 ± 8.4, 40.3 ± 7.7, and 31.1 ± 3.6 s, respectively; for group 3, they were 81.9 ± 12.3, 50.2 ± 8.3, and 47.9 ± 7.9 s, respectively. Males in group 1 thus spent 15.2% of the total test time in the stimulus arm, whereas males in group 2 spent 60.4% of their time in the same area (group 1 vs group 2: t(14) = 6.21; p < 0.001). Consistent with this, males in group 1 spent more time than males in group 2 in the clean arm (t(14) = 2.45; p < 0.05) and in the base of the Y (t(14) = 2.59; p < 0.05), areas farthest away from the stimulus males. In contrast, males in group 3 (the control males) spent 45.5% of their time in the stimulus arm when no stimulus male was present, which is significantly more than males in group 1 did in the same area with the familiar winner (t(14) = 3.43; p < 0.01). All of these measures thus indicate that males in group 1 avoided the familiar winner, whereas males in group 2, tested with the familiar neutral male, were attracted to him and spent a greater percentage of the test period time close to him.
Together, these results show that males in groups 1 and 2, which had exactly the same experiences during the exposure phase, behaved very differently in the Y-maze when tested with either the familiar winner (group 1) or the familiar neutral male (group 2). Males tested with the familiar winner avoided him, whereas males tested with the familiar, neutral male were attracted to him. These results indicate different emotional reactions to two, equally familiar males based on different experiences with those males, thus showing true individual recognition. Comparisons of groups 1 and 2 with the behavior of group 3, which had no aggressive interactions and were tested in a clean maze, also provide evidence for avoidance of a familiar winner by males in group 1 and attraction to a familiar neutral male by males in group 2.
No differences in cortisol and testosterone concentration
Previous studies that used the conditioned defeat model have shown that cortisol concentrations were elevated immediately after defeat in both acutely and chronically defeated hamsters (Huhman et al., 1991, 1992; Kollack-Walker et al., 1997; Jasnow et al., 2001). In our experiment, 1 d after the exposure condition and 1 h after the Y-maze tests, no difference was found between the three groups (eight subjects per group) in levels of either cortisol or testosterone. The concentrations of cortisol for groups 1, 2, and 3 were 23.37 ± 8.5, 15.22 ± 2.6, and 17.4 ± 3.9 ng/ml, respectively. The concentrations of testosterone for groups 1, 2, and 3 were 2.198 ± 0.339, 2.184 ± 0.366, and 1.824 ± 0.241 ng/ml, respectively. The lack of significant differences is not surprising, given the interval between the end of the test and the collection of blood and the fact that the subjects were exposed only to cues from the stimulus males during this test. The fights that they engaged in occurred 25 h before the collection of blood samples, and we would not expect changes resulting from these three brief encounters to last for this amount of time.
Immunohistochemistry: correlations of brain activity with behavior.
To identify brain areas that might be involved in recognizing individuals and the emotional responses to these individuals, we compared the densities of cells stained for c-Fos and Egr-1 in the three groups of males when animals were killed 1 h after the recognition task. The brain areas that we examined and their abbreviations are illustrated in Figure 1. A summary of the statistical results is shown in Table 1, and a summary of mean densities of stained cells in each targeted brain area is shown in Table 2.
Table 1.
Summary of statistical results for each of the 20 examined brain areas
|
Area |
c-Fos |
Egr-1 |
r |
|---|---|---|---|
| AID | NS (0.16) | NS (0.764) | NS |
| ORB | NS (0.354) | NS (0.119) | NS |
| Pir | *(0.039) G1 > G3 | NS (0.752) | NS |
| G1G2 (0.17) *G1G3(0.035) G2G3 (0.29) | |||
| AIP | NS (0.823) | NS (0.679) | NS |
| MeA | NS (0.171) | NS (0.354) | * |
| G1G2 (0.82) G1G3 (0.074) G2G3 (0.11) | G1G2 (0.89) G1G3 (0.09) G2G3 (0.27) | ||
| MePV | NS (0.353) | *(0.037) G1 = G2 > G3 | NS |
| G1G2 (0.72) G1G3 (0.05) G2G3 (0.0016) | |||
| BLA | NS (0.094) | *(0.017) G1 = G2 > G3 | * |
| G1G2 (0.32) *G1G3 (0.047) G2G3 (0.20) | G1G2 (0.61) *G1G3 (0.017) *G2G3 (0.0036) | ||
| CeC | NS (0.36) | NS (0.879) | NS |
| ADHCA1 | *(0.001) G1 > G2 = G3 | NS (0.197) | * |
| *G1G2 (0.014) *G1G3 (0.0008) G2G3 (0.19) | G1G2 (0.86) *G1G3 (0.039) G2G3 (0.21) | ||
| ADHCA3 | *(0.002) G1 = G2 > G3 | *(0.001) G1 = G2 > G3 | * |
| G1G2 (0.61) *G1G3 (0.0002) *G2G3 (0.012) | G1G2 (0.15) *G1G3 (0.0001) *G2G3 (0.024) | ||
| ADHCA4 | NS (0.175) | NS (0.12) | NS |
| G1G2 (0.81) G1G3 (0.053) G2G3 (0.084) | |||
| ADHDG | NS (0.102) | *(0.014) G1 > G3 | NS |
| G1G2 (0.058) G1G3 (0.49) G2G3 (0.18) | G1G2 (0.095) *G1G3 (0.0073) G2G3 (0.15) | ||
| PDHCA1 | NS (0.335) | NS (0.345) | * |
| PDHCA2 | NS (0.254) | NS (0.226) | * |
| PVHCA3 | NS (0.342) | NS (0.552) | NS |
| PDHCA4 | NS (0.60) | NS (0.192) | NS |
| PDHDG | *(0.03) G1 > G3 | NS (0.771) | NS |
| G1G2 (0.15) *G1G3 (0.0096) G2G3 (0.22) | G1G2 (0.66) G1G3 (0.75) G2G3 (0.53) | ||
| PDS | NS (0.176) | NS (0.631) | NS |
| PRh | NS (0.728) | *(0.04) G2 > G1 = G3 | NS |
| *G1G2 (0.02) G1G3 (0.59) *G2G3 (0.034) | |||
| LEnt |
NS (0.694) |
NS (0.473) |
* |
First column on the left lists abbreviations of brain regions; second and third columns list results of statistical comparisons across groups for density of cells stained for c-Fos or Egr-1. In the first row in each cell are the p values (ANOVA) across all three groups, followed by differences between specific groups based on the t test. In the second row are the p values for the two-sample t test between the groups indicated. G1, Group 1; G2, group 2; G3, arena control group; NS, not significant. *p < 0.05. Fourth column indicates correlation between c-Fos and Egr-1 expression.
Table 2.
Summary of densities (mean number of cells per square millimeter ± SEM) in each of the 20 brain areas examined for c-Fos and Egr-1 expression in groups 1 (G1), 2 (G2), and 3 (G3)
|
Density area |
c-Fos |
Egr-1 |
||||||||
|---|---|---|---|---|---|---|---|---|---|---|
|
|
G1 |
G2 |
G3 |
G1 |
G2 |
G3 |
||||
| AID | 152 ± 62 | 302 ± 102 | 100 ± 47 | 349 ± 80 | 343 ± 129 | 258 ± 74 | ||||
| ORB | 121 ± 32 | 178 ± 72 | 78 ± 29 | 102 ± 23 | 288 ± 117 | 97 ± 30 | ||||
| Pir | 405 ± 99(b) | 220 ± 43 | 148 ± 48(b) | 361 ± 92 | 389 ± 125 | 270 ± 129 | ||||
| AIP | 84 ± 40 | 70 ± 16 | 59 ± 24 | 128 ± 31 | 129 ± 53 | 88 ± 23 | ||||
| MeA | 136 ± 22 | 145 ± 34 | 78 ± 21 | 179 ± 43 | 168 ± 63 | 92 ± 23 | ||||
| MePV | 117 ± 25 | 152 ± 37 | 88 ± 29 | 137 ± 53(b) | 160 ± 34(d) | 25 ± 4(b,d) | ||||
| BLA | 189 ± 38(b) | 140 ± 28 | 85 ± 29(b) | 169 ± 42(b) | 144 ± 23(d) | 45 ± 17(b,d) | ||||
| CeC | 65 ± 20 | 145 ± 46 | 79 ± 51 | 61 ± 10 | 71 ± 27 | 54 ± 31 | ||||
| ADHCA1 | 671 ± 93(a,b) | 317 ± 84(a) | 163 ± 74(b) | 529 ± 68(b) | 496 ± 167 | 233 ± 110(b) | ||||
| ADHCA3 | 750 ± 82(b) | 663 ± 144(d) | 181 ± 81(b,d) | 850 ± 104(b) | 581 ± 144(d) | 175 ± 73(b,d) | ||||
| ADHCA4 | 344 ± 56 | 452 ± 84 | 281 ± 41 | 263 ± 48 | 246 ± 47 | 142 ± 31 | ||||
| ADHDG | 175 ± 58 | 479 ± 135 | 250 ± 89 | 987 ± 160b | 625 ± 124 | 371 ± 114(b) | ||||
| PDHCA1 | 783 ± 142 | 475 ± 151 | 527 ± 166 | 942 ± 163 | 845 ± 153 | 620 ± 154 | ||||
| PDHCA2 | 1179 ± 211 | 1250 ± 323 | 662 ± 250 | 983 ± 155 | 1350 ± 326 | 704 ± 258 | ||||
| PVHCA3 | 858 ± 149 | 921 ± 233 | 517 ± 222 | 700 ± 153 | 1079 ± 214 | 971 ± 343 | ||||
| PDHCA4 | 531 ± 96 | 403 ± 123 | 366 ± 137 | 444 ± 91 | 516 ± 138 | 263 ± 38 | ||||
| PDHDG | 896 ± 156(b) | 563 ± 151 | 325 ± 109(b) | 900 ± 132 | 1017 ± 223 | 821 ± 208 | ||||
| PDS | 819 ± 185 | 770 ± 166 | 423 ± 109 | 714 ± 87 | 737 ± 170 | 558 ± 157 | ||||
| PRh | 738 ± 68 | 592 ± 176 | 630 ± 133 | 550 ± 67(c) | 817 ± 76(c,d) | 471 ± 125(d) | ||||
| LEnt |
524 ± 107 |
517 ± 137 |
386 ± 135 |
504 ± 97 |
635 ± 113 |
460 ± 100 |
||||
Codes for significant differences are as follows: (a), G1 > G2; (b), G1 > G3; (c), G2 > G1; and (d), G2 > G3.
We found significant differences between groups 1 and 2 in two brain areas, the ADHCA1 and the perirhinal cortex (PRh). In the ADHCA1, significantly more cells were stained for c-Fos in group 1 than in either group 2 or 3 (Fig. 3, top). In the PRh, more cells were stained for Egr-1 in group 2 than in group 1 or 3 (Fig. 3, bottom). These differences in the ADHCA1 and PRh may reflect cell activity that is related to the recognition of two equally familiar individuals or to the differences in the emotions aroused by a familiar winner (group 1) versus a familiar neutral male (group 2).
Figure 3.

Representative photomicrographs and mean (± SEM) density of cells stained for c-Fos or Egr-1 in the three experimental groups. Top row, c-Fos in the ADHCA1; bottom row, Egr-1 in the PRh. *p < 0.05.
The density of stained cells in groups 1 and 2 was similar and greater in both of these groups than in the arena control group (group 3, tested in a clean Y-maze). For Egr-1, these areas were the posteroventral medial amygdala, the anterior basolateral amygdala (BLA), and the ADHCA3 (Table 1). For c-Fos, the one difference observed was in the ADHCA3 (Table 1). These results either may reflect differences in arousal caused by odor and other cues from males versus no cues from males, or they may indicate areas involved in the recognition process in groups 1 and 2, both of which were exposed to familiar stimulus males.
Additional differences were observed between group 1 and the control group. A significantly greater density of cells were stained for c-Fos in group 1 than in group 3 in the piriform cortex (Pir) and dentate gyrus of posterior dorsal hippocampus (PDHDG) (Table 1). For Egr-1, a greater density of cells were stained in group 1 than in Group 3 in the dentate gyrus of anterior dorsal hippocampus (ADHDG) (Table 1). Activity in these areas may reflect responses to a highly salient, fearful social stimulus compared with the responses to a clean Y-maze. No other differences were found between the three groups for either c-Fos or Egr-1 (Table 1).
The relationship between expression of c-Fos and Egr-1
The overall correlation (Pearson's test) between c-Fos and Egr-1 expression was 0.533. We found a high degree of correlation (R > 0.4) between c-Fos and Egr-1 expression in adjacent sections of seven areas, namely the MeA, BLA, ADHCA1, ADHCA3, PDHCA1, PDHCA2, and lateral entorhinal cortex (LEnt) (Table 1). The lack of consistent correlation between expression of c-Fos and Egr-1 in the other areas that we examined suggests that the expression of c-Fos or Egr-1 are specific to particular areas and that they are functionally independent. It is not surprising that c-Fos and Egr-1 yielded different results; there is only a moderate correlation between these two measures across different brain regions (Lai et al., 2004), presumably because different immediate early genes (e.g., c-fos and egr-1) may trigger different downstream genes that regulate different cellular processes, including those that may be involved in memory formation (Tischmeyer and Grimm, 1999). In addition, different genes may have different expression thresholds in different brain areas.
Experiment 2
Behavior during exposure phase
As in experiment 1, all of the subjects lost fights to the aggressively experienced stimulus males, fled rapidly, and jumped out of the arena. Subjects also escaped more quickly in successive encounters (F(2,10) = 9.65; p < 0.01). The escape latency in encounter 1 (75.83 ± 9.87 s) was significantly longer than in both encounter 2 (27 ± 9.6 s; t(5) = 2.71; p < 0.05) and encounter 3 (19.17 ± 5.95 s; t(5) = 4.51; p < 0.01). There was no significant difference in escape latency between encounters 2 and 3.
Behavior in the Y-maze tests
Subjects spent much less time sniffing the familiar winner in the saline condition than in the lidocaine condition (Fig. 4A)(t(5) = 4.54; p < 0.01), indicating that when the ADHCA1 was inactivated, the subjects did not avoid the familiar winner. There was also a strong tendency for lidocaine-treated males to approach the familiar winner more quickly (mean latency, 11.5 s) than the same animals did in the saline condition (41.3 s), but this difference was not statistically significant because of one outlier. There were no significant differences in the time spent in other parts of the Y-maze across treatment conditions. There were also no significant differences in overall activity across treatment conditions (Fig. 4B). These results show that transient inactivation of the ADHCA1 eliminated the fearful response to the familiar winner. This could be because lidocaine blocked memory processes or because it blocked access to information about the significance of the familiar winner to the subject during tests in the Y-maze; however, this treatment did not reduce overall activity. Thus, this region of hippocampus may play a crucial role in social memory processes.
Figure 4.

Behavioral performance in the Y-maze by males microinfused with saline (open bars) or lidocaine (hatched bars) or in tests before any treatment (black bar). A, The mean (± SEM) number of seconds spent sniffing at the screen of the stimulus box containing the familiar winner (left) or the clean stimulus box (right). B, The mean (±SEM) number of times that subjects crossed the lines between the eight sections of the Y-maze during the clean trial (no stimulus present), the saline trial, and the lidocaine trial (both with a familiar winner in one stimulus box). *p < 0.05.
Compared with subjects in groups 1 and 2 in experiment 1, the subjects in experiment 2 showed longer latencies to escape during fights (F(1,40) = 15.650; p < 0.001), and their avoidance of the familiar winner in the Y-maze was not as dramatic as that shown by the males in experiment 1. Several differences between the experiments might explain these results. First, subjects in experiment 2 had only one social experience (a fight) instead of 2 experiences, as in experiment 1 (an encounter across a wire mesh and then a fight). Mere exposure across a wire mesh in experiment 1 could have had a priming effect, increasing arousal or aggressive motivation (Potegal and Coombes, 1995). Second, subjects in experiment 2 had two tests with stimulus males in the Y-maze separated by 3 h, whereas subjects in experiment 1 had just one exposure to the stimulus male. Thus, in experiment 2, males might have been less fearful on the second test trial in the Y-maze because some of that fear was extinguished in the first trial when they were not chased or attacked by the stimulus animal. Third, removal of one olfactory bulb could result in a reduced level of arousal because of less sensory input. Finally, the presence of a cannula on the skull could have made the fights less intense than the fights in experiment 1, either because males with a cannula were more tentative or because the unusual appearance of the subject with a cannula caused the stimulus male to be more tentative.
Histology
In five of the six animals, the cannula was centered over the ADHCA1. In the sixth animal it was over the border between CA1 and CA2; the behavior of this animal was similar to that of the other animals.
Discussion
In experiment 1, subjects avoided the familiar winners but were attracted to the familiar, neutral males, suggesting that they learned to fear the familiar winner but had no fear of other males. This finding is consistent with previous results showing that male hamsters avoid a familiar winner but do not avoid an unfamiliar winner (Lai and Johnston, 2002). Thus, the behavioral results show true individual recognition, i.e., different responses to individuals based on the types of experiences with them. In contrast, virtually all other laboratory studies investigating individual recognition in rodents provide evidence for recognition of categories of individuals (familiar vs novel). These studies include, for example, experiments that used the juvenile recognition test with mice and rats (Kogan et al., 2000; Ferguson et al., 2002), the partner-preference test in prairie voles (Pitkow et al., 2001), the pregnancy-block effect (Brennan and Keverne, 1997), and the Coolidge effect (Bunnell et al., 1977).
Another noteworthy aspect of our experimental design is that the acquisition of information about individuals during the exposure phase took place in a context that was completely different from the Y-maze used for the recognition tests. Thus, there was no confound between individual recognition and learned responses to particular locations, environmental situations, or contexts (Insley, 2000).
Our behavioral results also differ from those that used the conditioned defeat method, in which subjects are repeatedly defeated during long interactions by a male in his own cage. Such subjects are afraid of any other male, even males that are not aggressive (Huhman et al., 1991, 1992; Potegal et al., 1993). Interactions in our experiments were quite brief and apparently less stressful. Our method was designed to mimic the kind of brief aggressive interactions experienced by golden hamsters in their natural environment (R. E. Johnston, unpublished observations) and thus should be a realistic model for social learning under ordinary conditions.
The patterns of staining for c-Fos and Egr-1 suggest that several brain areas are involved in the recognition of individuals and the specific type of emotional arousal associated with different stimulus animals. These areas include Pir, ADHCA1, ADHCA3, ADHDG, PDHDG, PRh, and BLA. One area, the ADHCA1, showed a greater density of stained cells in group 1 than group 2 or 3, suggesting that this area is important for responses to the familiar winner as opposed to a familiar male with a different, less compelling significance. In experiment 2, transient inactivation of ADHCA1 with lidocaine eliminated the avoidance of a familiar winner, providing further evidence for its role in social memory. The adjacent CA3 region of hippocampus showed a greater density of cells stained for c-Fos and Egr-1 in groups 1 and 2 compared with group 3, suggesting a general role in memory for familiar individuals. Three other areas, the ADHDG, PDHDG, and Pir, showed significantly higher densities of stained cells in group 1 than in the control group, indicating a role for these areas in processing information or mediating responses to a familiar winner. Finally, there was a significantly greater density of cells stained for Egr-1 in groups 1 and 2 in the BLA than in the control group, suggesting a role for the BLA in the recognition of a familiar opponent, perhaps specifically in the fear caused by cues from a familiar winner. This same area showed high levels of Fos in response to a familiar winner in a previous experiment (Lai et al., 2004).
Anatomical evidence indicates that CA1, CA3, and DG receive inputs from the lateral entorhinal cortex (Johnston and Amaral, 1998) and that CA1 sends information back to the lateral entorhinal cortex. This circuit and associated collaterals may be involved in comparing new sensory input with previously stored representations of similar sensory input (Lee and Kesner, 2002, 2004), suggesting that one role of CA1 could be to recognize complex, social stimuli. The ADHCA1 has been implicated in various other types of learning, including trained odor discriminations (Eichenbaum, 1998; Gall et al., 1998), social memory consolidation (Kogan et al., 2000), and socially mediated learning about food (Eichenbaum, 1998). Mice lacking NMDA receptors in the CA1 region are profoundly impaired in object recognition, olfactory discrimination, contextual fear memory, and social transmission of food preferences (Rampon et al., 2000). Indeed, in experiment 2, transient inactivation of the ADHCA1 eliminated the avoidance of the familiar winner, indicating the necessity of this area for memory of individuals. Although the hippocampus is not often a focus for research on recognition of individuals, it has been implicated in the juvenile recognition task in mice (Kogan et al., 2000) and in the recognition of famous faces in humans (Bernard et al., 2004). Recordings of single cells in humans also implicate the hippocampus in recognition of faces (Fried et al., 2002). We did not find differences across groups in the lateral entorhinal cortex, but lesion studies in hamsters suggest that it is important for discrimination of individual odors (Petrulis et al., 2000; Mayeaux and Johnston, 2004). Thus, the ADHCA1 and lateral entorhinal cortex may have important roles in the learning of individually distinctive odors and the storage of this information over an interval of at least 24 h.
The PRh was the only brain area in our experiment that showed a greater density of Egr-1 expression in group 2 compared with the other two groups. The PRh receives higher-order input from all sensory modalities and provides a major input to the hippocampus (Eichenbaum, 1998; Burwell, 2000). Of particular relevance, the PRh receives a substantial olfactory input from the Pir as well as projections from ventral and temporal association cortex (Burwell, 2000). This connectivity suggests that PRh is involved in memory for complex, multisensory stimuli (Bucci et al., 2002). Indeed, lesions of PRh impair contextual fear conditioning (Corodimas and LeDoux, 1995; Bucci et al., 2000), contextual fear discrimination (Bucci et al., 2002), and memory performance in a delayed non-matching-to-position task (Kjesten and Burwell, 1998). The role of this area in our task is not entirely clear, but it may be involved in recognition of the five distinct complex odors in hamsters that contain individually distinctive information (Johnston et al., 1993; Johnston and Jernigan, 1994; Johnston and Bullock, 2001). It could be argued that, in the current experiment, exposure across a wire-mesh barrier leads to mere familiarity with the cues from an individual, whereas the experience of defeat leads to retrieval of qualitative information about a learned event (i.e., recollection). Thus, our results showing elevated immediate early gene expression in the PRh and ADHCA1 may support the claim of process dissociation between familiarity and recollection in the medial temporal lobe in studies of humans and nonhuman primates (Brown and Aggleton, 2001; Weis et al., 2004; Yonelinas et al., 2005). On the other hand, exposure across a wire-mesh barrier is sufficient for the development of multicomponent representations of individual hamsters, suggesting an integrated memory of individuals and recollection of these individuals (Johnston and Jernigan, 1994; Johnston and Bullock, 2001).
The activation of the BLA in males in groups 1 and 2 compared with the control group is partially consistent with previous experiments in which we found that males exposed to the odor of a familiar winner had an elevated density of cells stained for c-Fos in the BLA (Lai et al., 2004). The results of both studies are consistent with the interpretation that the BLA is involved in regulating social anxiety or fear and that it is involved in the learned fear of individuals. The BLA is known for its role in the emotional aspects of learning and memory (LeDoux, 2000), especially in the acquisition of Pavlovian fear conditioning and memory consolidation in inhibitory avoidance tests (Fanselow and LeDoux, 1999; Maren, 2001), but it has not been implicated previously in learned fear of individuals. Other areas of the amygdala [MeA and central nucleus of the amygdala, capsular (CeC)] did not show differences in either c-Fos or Egr-1 expression across groups, which is also consistent with previous findings (Lai et al., 2004). Our results suggest a role for BLA in social anxiety associated with fighting, although they do not prove that this area is necessary for the fear of the winner. Representations of individuals are likely to be complex, and many different areas may be necessary for such memories.
These studies are the first that we are aware of in rodents that compare the activity in different areas of the brain during a task in which the subjects used odors to recognize one of two familiar individuals, each with a different emotional significance. Although much is known about the central mechanisms involved in the recognition of faces in humans and nonhuman primates, much less is known about the brain areas involved in individual recognition by other sensory systems, especially in rodents. This study provides a new behavioral method to study true individual recognition and indicates some of the brain areas that may be essential for this process and for the closely linked emotional responses to individuals.
Footnotes
This research was supported by National Institute of Mental Health Grants R01MH58001-01H1 and R01 MH058001-06A2. We thank Aiyin Chen and Elina Maymind for assistance with the research, Dr. Sarah W. Newman for valuable advice and comments, and Joan E. Johnston for assistance with the research and graphics.
Correspondence should be addressed to Robert E. Johnston, Department of Psychology, 286 Uris Hall, Cornell University, Ithaca, NY 14853. E-mail: rej1@cornell.edu.
DOI:10.1523/JNEUROSCI.2124-05.2005
Copyright © 2005 Society for Neuroscience 0270-6474/05/2511239-09$15.00/0
References
- Adolphs R (2001) The neurobiology of social cognition. Curr Opin Neurobiol 11: 231–239. [DOI] [PubMed] [Google Scholar]
- Bernard FA, Bullmore ET, Graham KS, Thompson SA, Hodges JR, Fletcher PC (2004) The hippocampal region is involved in successful recognition of both remote and recent famous faces. NeuroImage 22: 1704–1714. [DOI] [PubMed] [Google Scholar]
- Brennan PA, Keverne EB (1997) Neural mechanisms of mammalian olfactory learning. Prog Neurobiol 51: 457–481. [DOI] [PubMed] [Google Scholar]
- Brown MW, Aggleton JP (2001) Recognition memory: what are the roles of the perirhinal cortex and hippocampus? Nat Rev Neurosci 2: 51–61. [DOI] [PubMed] [Google Scholar]
- Bucci DJ, Phillips RG, Burwell RD (2000) Contributions of postrhinal and perirhinal cortex to contextual information processing. Behav Neurosci 114: 882–894. [DOI] [PubMed] [Google Scholar]
- Bucci DJ, Saddoris MP, Burwell RD (2002) Contextual fear discrimination is impaired by damage to the postrhinal or perirhinal cortex. Behav Neurosci 116: 479–488. [PubMed] [Google Scholar]
- Bunnell BN, Boland BD, Dewsbury DA (1977) Copulatory behaviour of golden hamsters (Mesocricetus auratus). Behaviour 61: 180–206. [Google Scholar]
- Bunsey M, Eichenbaum H (1995) Selective damage to the hippocampal region blocks long-term retention of a natural and non-spatial stimulus-stimulus association. Hippocampus 5: 546–556. [DOI] [PubMed] [Google Scholar]
- Burwell RD (2000) The parahippocampal region: corticocortical connectivity. Ann NY Acad Sci 911: 25–42. [DOI] [PubMed] [Google Scholar]
- Colgan P (1983) Comparative social recognition. New York: Wiley.
- Corodimas KP, LeDoux JE (1995) Disruptive effects of posttraining perirhinal cortex lesions on conditioned fear: contributions of contextual cues. Behav Neurosci 109: 613–619. [DOI] [PubMed] [Google Scholar]
- Davis M (1994) The role of the amygdala in emotional learning. Int Rev Neurobiol 36: 225–266. [DOI] [PubMed] [Google Scholar]
- Eichenbaum H (1998) Using olfaction to study memory. Ann NY Acad Sci 855: 657–669. [DOI] [PubMed] [Google Scholar]
- Fanselow MS, LeDoux JE (1999) Why we think plasticity underlying Pavlovian fear conditioning occurs in the basolateral amygdala. Neuron 23: 229–232. [DOI] [PubMed] [Google Scholar]
- Ferguson JN, Young LJ, Insel TR (2002) The neuroendocrine basis of social recognition. Front Neuroendocrinol 23: 200–224. [DOI] [PubMed] [Google Scholar]
- Fried I, MacDonald KA, Wilson CL (1997) Single neuron activity in human hippocampus and amygdala during recognition of faces and objects. Neuron 18: 753–765. [DOI] [PubMed] [Google Scholar]
- Fried I, Cameron KA, Yashar S, Fong R, Morrow JW (2002) Inhibitory and excitatory responses of single neurons in the human medial temporal lobe during recognition of faces and objects. Cereb Cortex 12: 575–584. [DOI] [PubMed] [Google Scholar]
- Gall CM, Hess US, Lynch G (1998) Mapping brain networks engaged by, and changed by, learning. Neurobiol Learn Mem 70: 14–36. [DOI] [PubMed] [Google Scholar]
- Halpin ZT (1980) Individual odors and individual recognition: review and commentary. Biol Rev 5: 233–248. [Google Scholar]
- Huhman KL, Moore TO, Ferris CF, Mougey EH, Meyerhoff JL (1991) Acute and repeated exposure to social conflict in male golden hamsters: increases in plasma POMC-peptides and cortisol and decreases in plasma testosterone. Horm Behav 25: 206–216. [DOI] [PubMed] [Google Scholar]
- Huhman KL, Moore TO, Mougey EH, Meyerhoff JL (1992) Hormonal responses to fighting in hamsters: separation of physical and psychological causes. Physiol Behav 51: 1083–1086. [DOI] [PubMed] [Google Scholar]
- Insley SJ (2000) Long-term vocal recognition in the northern fur seal. Nature 406: 404–405. [DOI] [PubMed] [Google Scholar]
- Jasnow AM, Drazen DL, Huhman KL, Nelson RJ, Demas GE (2001) Acute and chronic social defeat suppresses humoral immunity of male Syrian hamsters (Mesocricetus auratus). Horm Behav 40: 428–433. [DOI] [PubMed] [Google Scholar]
- Johnston D, Amaral DG (1998) Hippocampus. In: The synaptic organization of the brain (Shepard GM, ed.), pp 417–458. New York: Oxford UP.
- Johnston RE (1985) Communication. In: The hamster: reproduction and behavior (Siegel HI, ed.), pp 121–154. New York: Plenum.
- Johnston RE (1998) Pheromones, the vomeronasal system, and communication: from hormonal responses to individual recognition. Ann NY Acad Sci 855: 333–348. [DOI] [PubMed] [Google Scholar]
- Johnston RE, Bullock TA (2001) Individual recognition by use of odours in golden hamsters: the nature of individual representations. Anim Behav 61: 545–557. [Google Scholar]
- Johnston RE, Jernigan P (1994) Golden hamsters recognize individuals, not just individual scents. Anim Behav 48: 129–136. [Google Scholar]
- Johnston RE, Derzie A, Chiang G, Jernigan P, Lee HC (1993) Individual scent signatures in golden hamsters: evidence for specialization of function. Anim Behav 45: 1061–1070. [Google Scholar]
- Kanwisher N (2000) Domain specificity in face perception. Nat Neurosci 3: 759–763. [DOI] [PubMed] [Google Scholar]
- Kendrick KM, da Costa AP, Broad KD, Ohkura S, Guevara R, Levy F, Keverne EB (1997) Neural control of maternal behaviour and olfactory recognition of offspring. Brain Res Bull 44: 383–395. [DOI] [PubMed] [Google Scholar]
- Kendrick KM, da Costa AP, Leigh AE, Hinton MR, Peirce JW (2001) Sheep don't forget a face. Nature 414: 165–166. [DOI] [PubMed] [Google Scholar]
- Kjesten AW, Burwell RD (1998) Memory impairment on a delayed non-matching-to-position task after lesions of the perirhinal cortex in the rat. Behav Neurosci 112: 827–838. [DOI] [PubMed] [Google Scholar]
- Kogan JH, Frankland PW, Silva AJ (2000) Long-term memory underlying hippocampus-dependent social recognition in mice. Hippocampus 10: 47–56. [DOI] [PubMed] [Google Scholar]
- Kollack-Walker S, Watson SJ, Akil H (1997) Social stress in hamsters: defeat activates specific neurocircuits within the brain. J Neurosci 17: 8842–8855. [DOI] [PMC free article] [PubMed] [Google Scholar]
- Lai WS, Johnston RE (2002) Memory of individual recognition after fighting by male hamsters: a new method. Physiol Behav 76: 225–239. [DOI] [PubMed] [Google Scholar]
- Lai WS, Chen A, Johnston RE (2004) Patterns of neural activation associated with exposure to odors from a familiar winner in male golden hamsters. Horm Behav 46: 319–329. [DOI] [PubMed] [Google Scholar]
- LeDoux JE (2000) Emotion circuits in the brain. Annu Rev Neurosci 23: 155–184. [DOI] [PubMed] [Google Scholar]
- Lee I, Kesner RP (2002) Differential contribution of NMDA receptors in hippocampal subregions to spatial working memory. Nat Neurosci 5: 162–168. [DOI] [PubMed] [Google Scholar]
- Lee I, Kesner RP (2004) Differential contributions of dorsal hippocampal subregions to memory acquisition and retrieval in contextual fear-conditioning. Hippocampus 14: 301–310. [DOI] [PubMed] [Google Scholar]
- Maren S (2001) Neurobiology of Pavlovian fear conditioning. Annu Rev Neurosci 24: 897–931. [DOI] [PubMed] [Google Scholar]
- Mayeaux DJ, Johnston RE (2004) Discrimination of social odors and their locations: role of lateral entorhinal area. Physiol Behav 82: 653–662. [DOI] [PubMed] [Google Scholar]
- Morin LP, Wood RI (2001) A stereotaxic atlas of the golden hamster brain. New York: Academic.
- Petrulis A, DeSouza I, Schiller M, Johnston RE (1998) Role of frontal cortex in social odor discrimination and scent-marking in female golden hamsters (Mesocricetus auratus). Behav Neurosci 112: 199–212. [DOI] [PubMed] [Google Scholar]
- Petrulis A, Peng M, Johnston RE (1999) Effects of vomeronasal organ removal on individual odor discrimination, sex-odor preference, and scent marking by female hamsters. Physiol Behav 66: 73–83. [DOI] [PubMed] [Google Scholar]
- Petrulis A, Peng M, Johnston RE (2000) The role of the hippocampal system in social odor discrimination and scent-marking in female golden hamsters (Mesocricetus auratus). Behav Neurosci 114: 184–195. [PubMed] [Google Scholar]
- Pitkow LJ, Sharer CA, Ren X, Insel TR, Terwilliger EF, Young LJ (2001) Facilitation of affiliation and pair-bond formation by vasopressin receptor gene transfer into the ventral forebrain of a monogamous vole. J Neurosci 21: 7392–7396. [DOI] [PMC free article] [PubMed] [Google Scholar]
- Potegal M, Coombes K (1995) Attack priming and aggressive arousal in female Syrian golden hamsters (Mesocricetus auratus). Anim Behav 49: 931–947. [Google Scholar]
- Potegal M, Huhman K, Moore T, Meyerhoff J (1993) Conditioned defeat in the Syrian golden hamster (Mesocricetus auratus). Behav Neural Biol 60: 93–102. [DOI] [PubMed] [Google Scholar]
- Rampon C, Tang YP, Goodhouse J, Shimizu E, Kyin M, Tsien JZ (2000) Enrichment induces structural changes and recovery from nonspatial memory deficits in CA1 NMDAR1-knockout mice. Nat Neurosci 3: 238–244. [DOI] [PubMed] [Google Scholar]
- Rolls ET (2000) Functions of the primate temporal lobe cortical visual areas in invariant visual object and face perception. Neuron 27: 205–218. [DOI] [PubMed] [Google Scholar]
- Tarr MJ, Gauthier I (2000) FFA: a flexible fusiform area for subordinate-level visual processing automatized by expertise. Nat Neurosci 3: 764–769. [DOI] [PubMed] [Google Scholar]
- Tischmeyer W, Grimm R (1999) Activation of immediate early genes and memory formation. Cell Mol Life Sci 55: 564–574. [DOI] [PMC free article] [PubMed] [Google Scholar]
- Weis S, Specht K, Klaver P, Tendolkar I, Willmes K, Ruhlmann J, Elger CE, Fernandez G (2004) Process dissociation between contextual retrieval and item recognition. NeuroReport 15: 2729–2733. [PubMed] [Google Scholar]
- Yamazaki K, Beauchamp GK, Curran M, Bard J, Boyse EA (2000) Parent-progeny recognition as a function of MHC odor type identity. Proc Natl Acad Sci USA 97: 10500–10502. [DOI] [PMC free article] [PubMed] [Google Scholar]
- Yonelinas AP, Otten LJ, Shaw KN, Rugg MD (2005) Separating the brain regions involved in recollection and familiarity in recognition memory. J Neurosci 25: 3002–3008. [DOI] [PMC free article] [PubMed] [Google Scholar]
- Young LJ (2002) The neurobiology of social recognition, approach, and avoidance. Biol Psychiatry 51: 18–26. [DOI] [PubMed] [Google Scholar]