

Abstract
In this study, PM2.5 and PM0.18 (particles with dp < 2.5μm and dp < 0.18μm, respectively) were collected during 2012-2013 in Central Los Angeles (LA) and 2013-2014 in Anaheim. Samples were chemically analyzed for carbonaceous species (elemental and organic carbon) and individual organic compounds. Concentrations of organic compounds were reported and compared with many previous studies in Central LA to quantify the impact of emissions control measurements that have been implemented for vehicular emissions over the past decades in this area. Moreover, a novel hybrid approach of molecular marker-based chemical mass balance (MM-CMB) analysis was conducted, in which a combination of source profiles that were previously obtained from a Positive Matrix Factorization (PMF) model in Central LA, were combined with some traditional source profiles. The model estimated the relative contributions from mobile sources (including gasoline, diesel, and smoking vehicles), wood smoke, primary biogenic sources (including emissions from vegetative detritus, food cooking, and re-suspended soil dust), and anthropogenic secondary organic carbon (SOC). Mobile sources contributed to 0.65±0.25 μg/m3 and 0.32±0.25 μg/m3 of PM2.5 OC in Central LA and Anaheim, respectively. Primary biogenic and anthropogenic SOC sources were major contributors to OC concentrations in both size fractions and sites. Un-apportioned OC (“other OC”) accounted for an average 8.0 and 26 % of PM2.5 OC concentration in Central LA and Anaheim, respectively. A comparison with previous studies in Central LA revealed considerable reduction of EC and OC, along with tracers of mobile sources (e.g. PAHs, hopanes and steranes) as a result of implemented regulations on vehicular emissions. Given the significant reduction of the impacts of mobile sources in the past decade in the LA Basin, the impact of SOC and primary biogenic emissions have a larger relative impact and the new hybrid model allows the impact of these sources to be better quantified.
Keywords: Particulate matter, organic compounds, source apportionment, fine and ultrafine particles, vehicular emissions
Graphical abstract
1. Introduction
Over the past few decades, air pollution and exposure to airborne particulate matter (PM) have received considerable attention from the health science community. A number of epidemiological and toxicological studies have investigated the short term and long term effects of PM exposure especially on the cardiovascular and respiratory systems (Delfino et al., 2010a, 2010b; Gauderman et al., 2007; Pope and Dockery, 2006), neurodegenerative issues (Campbell et al., 2005; Morgan et al., 2011) and gastrointestinal disorders (Li et al., 2015). Moreover, secondary species such as sulfate, nitrate and/or organics were found to be associated with myocardial infarction (Rich et al., 2013). PM size plays a significant role on the type and severity of the health effects caused. Studies have shown an increase in morbidity and mortality due to exposure to ambient PM2.5 (Urch et al., 2004). In comparison to larger particles, ultrafine particles (UFPs, traditionally defined as particles with an aerodynamic diameter smaller than approximately 0.1 – 0.2 μm) have higher number concentration and surface area and therefore larger concentrations of adsorbed or condensed toxic air pollutants per unit mass (Sioutas et al., 2005). UFPs are strongly linked to systemic oxidative stress and atherosclerotic plaque formation in experimental animal models (Araujo et al., 2008). UFPs likely act as the most efficient particle delivery vehicles for toxic chemicals to the respiratory system and systemic circulation resulting in adverse health outcomes (Delfino et al., 2005).
Several studies have postulated that organic components may play an important role in PM toxicity (Moller et al., 2014; Verma et al., 2010; Wu et al., 2014). Accordingly, intrinsic toxicity appears to be correlated with the organic content of ambient PM, particularly with species such as polycyclic aromatic hydrocarbons (PAHs), hopanes and steranes (Cho et al., 2005; Hu et al., 2008; Li et al., 2003; McDonald et al., 2004). Given the importance of organic constituents of ambient PM, several studies have been conducted in the Los Angeles (LA) Basin within the past decade with the aim of quantifying the sources of particulate organic compounds (Arhami et al., 2009; Hasheminassab et al., 2013; Heo et al., 2013; Minguillón et al., 2008).
In many urban areas in developed countries, the majority of primary ultrafine and fine PM in ambient air originate from vehicular emissions (Hasheminassab et al., 2013; Shi et al., 1999; Westerdahl et al., 2005). Over the past decade, several major regulations have been implemented on motor vehicles in the US and California, as exposure to PM from these sources has found to be one of the major drivers of the associated health outcomes (de Kok et al., 2006; Delfino et al., 2005; Ostro et al., 2011). Years after diesel exhaust had been acknowledged as one of the major sources of pollution by California Air Resource Board (CARB) in 1998, starting in 2007, the United States Environmental Protection Agency (EPA) mandated all 2007 model year (MY) diesel trucks to reduce their PM emission by 90%, and 50% of total sales of diesel trucks to reduce their nitrogen oxides (NOx) emissions by 95%. The NOx regulation was further amended in 2010 when the EPA mandated 100% of the newly-manufactured trucks to reduce their NOx emissions (U.S. EPA Regulatory Announcement, 2000). Following EPA's 2007 emissions standards, further restrictions on heavy-duty diesel trucks were implemented in the following years and all of the vehicles with 1989-1993 MY engines along with 1994-2003 MY engines were required to be retrofitted. Moreover, in January 2012 CARB's Truck and Bus regulation required heavy diesel trucks to use diesel particulate filters (DPFs) (California code of regulations, 2008).
Despite a 38% increase in regional motor vehicle activity, PM2.5 and PM10 decreased by 21%, and 15%, respectively, during a 20-year time period in Southern California (Lurmann et al., 2015). Emission control strategies in California have achieved dramatic reductions in ambient PM2.5 and PM10. However, additional reductions will still be needed to achieve current health-based clean air standards (Lurmann et al., 2015). Some other studies, using various techniques, have also verified PM emission reductions of vehicular sources, particularly from diesel trucks, in different locations of California, with a particular focus on the south coast air basin (Bishop et al., 2013; Hasheminassab et al., 2014a; Kozawa et al., 2014; Kuwayama et al., 2013; Lurmann et al., 2015; McDonald et al., 2015).
In this study, size-segregated ambient PM was collected at two different locations of the LA Basin (i.e. Central LA and Anaheim) as part of the Cardiovascular Health and Air Pollution Study (CHAPS), a cohort panel study investigating the pathophysiological responses to particle exposures in elderly people. Spatial and temporal variability of the organic compounds are discussed and the levels are compared to a comprehensive data set obtained over the past decade in Central LA. Historically, a limitation for molecular marker CMB models is the ability to directly quantify SOA and to have a more robust estimate of primary biogenic organic carbon concentrations that result from food cooking, vegetative detritus, and other natural sources. To this end, the current study uses a novel approach of hybrid molecular marker-based chemical mass balance (MM-CMB) model; the contributions from a variety of sources were estimated and the results were compared to the previous studies in Central LA, with a particular focus on the emission reduction from vehicular sources.
2. Methodology
2.1 Sampling sites and meteorology
Size-segregated PM samples were collected at two locations in the LA basin. One site was located in “Central LA” at the Particle Instrumentation Unit (PIU) of the University of Southern California, about 3 km south of downtown Los Angeles. This site is situated approximately 150 m to the east and downwind of a major freeway (I-110), and thus represents the urban mixed particles, emitted mostly from vehicular sources. The other sampling site was located in Anaheim, about 40 km southeast of downtown LA. This is a suburban site, situated in a residential area and about 500 m upwind of freeway I-5. The sampling site locations are presented in Figure S1.
Table S1 presents the monthly average of selected meteorological parameters at both sites. As expected at both sampling sites highest temperature was observed in summer (19.9-23.5 °C), whereas minimum in winter (12.9-20.2°C). Wind speed was overall higher in warmer months at both sites with predominantly westerly direction.
2.2 Sampling schedule and method
Five-day time-integrated samples were collected every week from Monday to Friday, between July 2012 and February 2013 in Central LA, and from Sunday to Thursday, between July 2013 and February 2014 in Anaheim. PM sampling in Anaheim was discontinued in December 2013 and resumed in January 2014. Throughout this manuscript, “warmer months” refer to period of July- September, while “colder months” refers to the October- February period.
Two collocated Micro-Orifice Uniform Deposit Impactors (MOUDIs, Model 110 MSP Corporation), each operating at 30 L/min, were used at each sampling site to collect ambient PM in three size ranges: <0.18 μm (ultrafine), 0.18-2.5 μm (accumulation), and 2.5-10 μm (coarse). The present study focuses on ultrafine and fine (accumulation + ultrafine) size fractions. For the purpose of chemical speciation, one MOUDI was loaded with Teflon filters (Pall Life Sciences, Ann Arbor, MI) only, while the other one with aluminum-foil substrates in the coarse and accumulation stages and quartz microfiber filters (Whatman International Ltd, Maidstone, England) in the ultrafine stage.
Although there might be a possibility of evaporation of organic compounds during the sampling, it should be noted that the measured pressure drop across the MOUDI operating with these two stages (i.e. 2.5 and 0.18 μm) was approximately 17 kPa, while the nominal pressure drop across MOUDI with all of the stages is 30 kPa (Marple et al., 1991). This lower pressure drop likely reduces the chances of evaporation of organic compounds. To further examine the possibility of evaporative losses or particle bouncing in the impactor stages, PM2.5 and PM0.18 mass concentrations obtained from the MOUDI were compared to parallel continuous measurements of PM2.5 by a Beta Attenuation Monitor (BAM) and PM0.18 by a Scanning Mobility Particle Sizer (SMPS), respectively. Comparison of median values indicated that PM0.18 mass concentrations from the two sampling methods were comparable (2.3 and 2.5 μg/m3 for MOUDI's PM0.18 and SMPS-derived PM0.18, respectively) with no statistically significant difference (p = 0.7). The median PM2.5 mass concentration measured by MOUDI was lower by about 15% than that measured by BAM (11.7 and 13.9 μg/m3 for MOUDI and BAM, respectively), and the difference between the concentrations measured by the two instruments approached significance (p = 0.08). Part of the lower PM2.5 MOUDI concentrations can be attributed to internal wall losses inside the impactor (of at least 5-10%, as reported by Marple et al. (1991) and by Cabada et al. (2004)) while the rest is probably a result of some volatilization of labile species from the MOUDI stages. These relatively small losses do not affect the results, considering that only chemicals that should be mostly or completely in the particle phase were used in the source apportionment analysis. Moreover, the relatively lower PM2.5 MOUDI concentrations probably rule out substantial particle bouncing from the upper MOUDI stages, as this process would increase rather than decrease the PM2.5 concentrations. Detailed discussions on these comparisons and the pertinent data analysis have been provided in the supplementary materials (Figures S7 and S8).
There have been a number of laboratory studies that have suggested that some of the tracers used in the current model are semi-volatile and reactive and may not be suitable for use as source tracers (May et al., 2012; Ruehl et al., 2011). However, a comparison of source apportionment methods using real world data sets have shown good agreement across CMB, PMF, and UNMIX, which would not be expected if the key tracers for these sources (i.e. hopanes, steranes, PAHs, and levoglucosan) had significant losses due to oxidation or partitioning into the gas phase (Heo et al., 2013). Recent work by Zhou et al. (2013), Arangio et al. (2015), and the included references have demonstrated the importance of organic aerosol viscosity on the kinetic limitations of organic compounds repartitioning amongst the gas and particle phase. These results provide a reasonable explanation of why the volatility of these tracers that have been observed in the dry chamber and possible thermodenuder studies do not appear to be representative for real world aerosols. Although more work is needed to understand the behavior of these tracers in the real atmosphere, evidence suggests that these tracers are sufficiently stable and non-volatile to be used for source apportionment studies.
2.3 Gravimetric and chemical analysis
Weekly samples were analyzed to quantify the mass concentrations of PM and its chemical constituents. The PM mass concentrations were determined by pre- and post-weighting the Teflon filters, using a highly precise (± 0.001 mg) microbalance (Mettler Toledo Inc., Columbus, OH, USA), after equilibration under controlled temperature (22–24°C) and relative humidity (40-50%). In order to quantify the elemental carbon (EC) and organic carbon (OC) content of the samples, a 1.5 cm2 punch of the quartz/aluminum filters was analyzed by NIOSH Thermal Optical Transmission method (Birch and Cary, 1996). Organic specification was conducted using the gas chromatography mass spectrometry (GC-MS). In this analysis, each solvent extracted sample was spiked with the isotopically-labled internal recovery standards for quantification purposes. Methylene chloride (DCM) and acetone were examined as the mixed solvent to assure improved polar compound recoveries for molecular marker analysis. After extraction, the samples were concentrated first by rotary evaporation and then blown down under high-purity nitrogen gas. Further details on this method can be found elsewhere (Stone et al., 2008).
2.4 Source apportionment
A novel hybrid approach of molecular marker-based chemical mass balance (MM-CMB) model has been exploited in order to assess the contribution of different sources to OC in two size fractions; PM0.18 and PM2.5. The model was mathematically solved with an effective-variance-least-squares solution (Watson et al., 1984), using the U.S. Environmental Protection Agency's CMB software (EPA-CMB 8.2).
With the exception of vehicular emissions, source profiles were adopted from Heo et al. (2013) who performed a positive matrix factorization (PMF) analysis on a unique data set of ambient organic molecular markers, measured in Central LA between 2009 and 2010, to identify and quantify sources of ambient PM2.5 OC. Heo et al. (2013) identified five major sources of PM2.5 OC, including mobile emissions, wood smoke, primary biogenic (vegetative detritus, food cooking, and re-suspended soil dust), and two types of secondary organic carbon (SOC-1 and SOC-2, corresponding to anthropogenic and biogenic origins, respectively). The uncertainties of the PMF-derived source profiles were estimated by PMF2 model performed by Heo et al. (2013) and were directly used along with the source profiles in our hybrid MM-CMB model. Heo et al. (2013) have rigorously quantified the uncertainties of the PMF input data by accounting for instrument analysis uncertainties and field blanks. In addition, Heo et al. (2013) screened the PMF input data for species with weak signal-to-noise ratio and did not find any species in this category to protect against adding noise to the PMF analysis. Moreover, they did control for rotational ambiguity and explored different pseudorandom number of factors and robust mode, as well as FPEAK and FKEY values to reach to the most stable and optimal results from the PMF model. The reasonable uncertainties that were produced by the PMF2 model for the PMF-derived source profiles (Table S7) are consistent with the error structure commonly used for MM-CMB models with uncertainties of around 10-20 percent for key tracers for each profile and much higher relative uncertainties for compounds that are dominated by other sources (Pant et al., 2014; Stone et al., 2008).
The PMF-derived source profiles from Heo et al. (2013), except for mobile sources, were used as input data into our MM-CMB model to apportion PM2.5 and PM0.18 OC. Heo et al. (2013) characterized the PMF-derived SOC-2 source profile by high concentrations of pinonic acid, pinic acid, and methylthreitols, compounds that were not detected in the majority of our samples. SOC-2 was, therefore, excluded from the MM-CMB input source profiles. In addition, Heo et al. (2013) identified only one profile for mobile sources, representing the emissions from all types of vehicles (i.e. diesel, gasoline, smoking vehicles, etc.). The main drawback of using this profile in the current MM-CMB model was the fact that a single source profile from the PMF analysis for mobile sources derived from the 2009-2010 data by Heo et al. (2013) was not considered an appropriate match for the relative emissions from each mobile source group in 2012-2014 of the current study. The single PMF-derived mobile source profile inherently assumes that the relative impact of diesel, gasoline and smokers are constant, while several studies have shown that the ratio of the contributions from different vehicle mixes change with respect to location and size fraction (Heo et al., 2013; Minguillón et al., 2008). Moreover, Subramanian et al. (2006) suggested that individual profiles cannot fully represent the emissions from entire fleet, therefore a combined set of available profiles are to be used to create a more representative fleet-average profile. On the other hand and contrary to vehicular emissions, a reliable source testing for SOC or primary biogenic (vegetative detritus, food cooking, and re-suspended soil dust) emissions cannot be performed. As a result, to estimate the contributions from these two sources in an MM-CMB, PMF-derived source profiles are the best resources available.
Therefore, as a major advancement in MM-CMB modeling, a hybrid approach was applied using the PMF-derived source profiles for biomass burning, primary biogenic (vegetative detritus, food cooking, and re-suspended soil dust), and SOC adopted from Heo et al. (2013), along with three source profiles for vehicular emissions (i.e. diesel, gasoline, and smoking vehicles) from a study conducted by Lough et al. (2007). In traditional CMB receptor modeling, the source profiles used as input data were obtained by direct source-testing measurements. The primary advantage of the hybrid model in comparison to previous MMCMB studies is the inclusion of SOC and primary biogenic source profiles as input data in the CMB model to directly apportion their contributions to OC in the LA Basin.
Although the average emissions rates have changed considerably since the source profiles of Lough et al. (2007), these profiles are still the best representative of the composition of organic carbon emissions from these vehicles categories since emissions are still dominated by higher emitting vehicles. The study by Lough et al. (2007) was conducted with a relatively large number of vehicles, covering several age groups and weight classes. Although large variations were observed among emissions from different types of vehicles, fleet- average profiles, weighted by mass emission rate, had much lower uncertainty than that associated with intervehicle variation. Source profiles and their related uncertainties are presented in Table S7.
Along with the aforementioned source profiles, the following species were used as fitting species in the hybrid MM-CMB model: EC, benzo(b)fluoranthene, benzo(k)fluoranthene, benzo(e)pyrene, indeno(1,2,3-cd)pyrene, benzo(ghi)perylene, coronene, 17α(H)-21β(H)-hopane, n-alkanes with odd-carbon between 24 to 36, organic acids with carbon number between 18 and 30 (except 27 & 29), phthalic acid, isophthalic acid, terephthalic acid, methylphthalic acid, succinic acid, glutaric acid, adipic acid, pimelic acid, suberic acid, azelaic acid, sebacic acid and levoglucosan. Moreover, the compounds used as fitting species in the CMB have been extensively used in previous source apportionment studies in this area as well as other parts of the world, and have been demonstrated to be predominantly in the particle phase and also chemically stable during transport from source to receptor (Arhami et al., 2010; Chow et al., 2007; Hasheminassab et al., 2013; Heo et al., 2013; Minguillón et al., 2008; Schauer et al., 1996; Zheng et al., 2002). These tracers accounted for a small fraction of measured OC ranging from 0.002% to 1.8% and from 0.003% to 2.0% on average over all sampling months in both sampling sites for PM2.5 and PM0.18, respectively. The rest of the mass closure in the source appointment of OC is inferred from the CMB model.
To evaluate the sensitivity of our hybrid MM-CMB model to the input source profiles and also to evaluate the accuracy of the results, the MM-CMB model was also performed using a set of traditional source profiles, which are widely used in the literature. For this scenario, OC apportionment for both size fractions (i.e. PM2.5 and PM0.18) was conducted using the following source profiles: light-duty, heavy-duty, and smoking vehicles (Lough et al., 2007), wood smoke (biomass burning in Western US) (Fine et al., 2004; Sheesley et al., 2007), vegetative detritus (Rogge et al., 1993), and natural gas combustion (Rogge et al., 1993).. The fitting species used in this model are as follows: EC, benzo(b) fluoranthene, benzo(k) fluoranthene, benzo(e)pyrene, indeno(1,2,3-cd) pyrene, benzo(ghi) perylene, 17 α (H)-21 β (H)-hopane, n- alkanes with carbon number of 29 and 31 and levoglucosan. Natural gas was excluded from the source profiles as the CMB contribution estimates were negative for this source in a majority of samples. Moreover, some of the PAHs were not detected in a number of Anaheim samples; thus, for these specific samples, the smoking vehicles source profile was excluded and vehicular emissions were represented as the sum of gasoline and diesel emissions. The results of the sensitivity analysis are presented in Figures S4-S6. Overall, the hybrid model evaluated mobile source contributions to a reasonable extent in comparison to the traditional model with a high R2 of about 0.92 for both size ranges. The PM2.5 and PM0.18 mobile source contribution obtained from hybrid model are respectively 28±4% and 30±7% lower than traditional model, as depicted in the column plots in Figure S4. The sensitivity analysis for wood smoke (Figure S5) also revealed a strong correlation between the results of the hybrid and traditional models (R2= 0.96 and 0.97 for PM2.5 and PM0.18 particles), with somewhat higher estimation from hybrid model compared to traditional model. On average over all sampling months and at both sites, wood smoke source contribution estimates from traditional MM-CMB model were 50±12% and 49±11% higher than the new hybrid model for PM2.5 and PM0.18, respectively. In Figure S6, the contribution of “other OC” from traditional MM-CMB model was compared to the sum of primary biogenic (including emissions from vegetative detritus, food cooking, and re-suspended soil dust), SOC and “other OC” from the hybrid model. Scatter plots of the weekly samples in Figure S6 show a very strong agreement between these two models (R2= 0.84±0.007 and slopes of 1.0±0.06). This agreement is also seen in the column plots of Figure S6 at both sites and for both size fractions. For instance, for PM2.5 in Central LA, traditional MM-CMB model estimated an average value of 1.61±0.42 μg/m3 for “other OC” over all sampling months, while the hybrid model estimated an average of 1.77±0.36 μg/m3 for the sum of primary biogenic sources, SOC, and “other OC”. Given previous modeling studies in the LA Basin, the biogenic sources is likely dominated by food cooking emissions (Hu et al., 2014; Kleeman and Cass, 2001). Overall, the results of this sensitivity analysis demonstrate that the new hybrid model can provide reasonable estimates of the contributions of a variety of sources to PM-bound OC when the PMF-derived source profiles are used in an MM-CMB model.
3. Results and Discussion
3.1 Particulate mass
Table 1 shows the monthly average mass concentration of PM0.18 and PM2.5 at both sites. The overall PM mass for both size fractions were in relatively similar ranges in warmer and colder months at both sites. As can be inferred from Table 1, PM2.5 mass concentrations in Central LA spanned a relatively narrow range of 11.8±2.5 μg/m3 in warmer months to 13.0±3.8 μg/m3 in colder months. These levels, nonetheless, are comparatively lower than the PM2.5 concentration levels reported at the same sampling site in Central LA during the past decade (Kam et al., 2012; Minguillón et al., 2008; Sardar et al., 2005), an observation which is consistent with the continual downward trend of ambient PM2.5 levels in Central LA over the past decade (Hasheminassab et al., 2014a). For instance, the PM2.5 mass levels in Central LA in 2012-2013 are about 38% and 30% lower than those reported by Sardar et al. (2005) and Kam et al. (2011), respectively. These reductions in PM mass, which were found to be statistically significant (p < 0.05), can be attributed to more stringent control strategies, particularly on vehicular emissions, implemented over the past decade. Similar to Central LA, there is limited temporal variability in average PM2.5 levels in Anaheim as well, with the average mass concentration ranging from 8.3±1.7 μg/m3 during warmer months to 10.4±3.3 μg/m3 during colder months. The lower PM mass levels observed in Anaheim compared to Central LA is mainly due to the location of this site which is a suburban residential area, and therefore less impacted by major primary sources.
Table 1. a-b. Monthly average mass, EC, and OC concentrations (± standard deviation) (μg/m3) for PM2.5 and PM0.18 size fractions in a) Central Los Angeles and b) Anaheim.
| a) Central LA | ||||||
|---|---|---|---|---|---|---|
| PM Mass | OC | EC | ||||
|
| ||||||
| Sampling month | PM0.18 | PM2.5 | PM0.18 | PM2.5 | PM0.18 | PM2.5 |
| Jul 2012 | 1.88 ± 0.39 | 12.09 ± 4.41 | 0.75 ± 0.21 | 1.86 ± 0.43 | 0.23 ± 0.07 | 0.40 ± 0.12 |
| Aug 2012 | 2.25 ± 0.75 | 11.94 ± 1.58 | 0.86 ± 0.27 | 2.02 ± 0.42 | 0.31 ± 0.14 | 0.52 ± 0.18 |
| Sep 2012 | 1.66 ± 0.43 | 11.58 ± 1.04 | 0.95 ± 0.17 | 2.51 ± 0.38 | 0.25 ± 0.03 | 0.59 ± 0.08 |
| Oct 2012 | 2.52 ± 0.76 | 12.56 ± 4.20 | 1.31 ± 0.37 | 2.93 ± 0.93 | 0.37 ± 0.17 | 0.70 ± 0.30 |
| Nov 2012 | 2.53 ± 1.14 | 16.67 ± 4.24 | 1.03 ± 0.36 | 3.00 ± 0.62 | 0.25 ± 0.06 | 0.45 ± 0.12 |
| Dec 2012 | 2.34 ± 0.77 | 11.85 ± 4.45 | 1.22 ± 0.44 | 3.51 ± 1.23 | 0.26 ± 0.06 | 0.43 ± 0.10 |
| Jan 2013 | 2.71 ± 0.39 | 10.36 ± 1.09 | 1.36 ± 0.11 | 3.97 ± 0.68 | 0.32 ± 0.02 | 0.51 ± 0.05 |
| Feb 2013 | 2.43 ± 1.57 | 13.70 ± 0.13 | 1.21 ± 0.65 | 3.48 ± 1.86 | 0.30 ± 0.18 | 0.54 ± 0.32 |
|
| ||||||
| b) Anaheim | ||||||
| PM Mass | OC | EC | ||||
|
| ||||||
| Sampling month | PM0.18 | PM2.5 | PM0.18 | PM2.5 | PM0.18 | PM2.5 |
|
| ||||||
| Jul 2013 | 2.36 ± 1.03 | 8.65 ± 2.17 | 1.01 ± 0.22 | 1.64 ± 0.35 | 0.11 ± 0.02 | 0.13 ± 0.03 |
| Aug 2013 | 2.18 ± 0.75 | 8.78 ± 2.18 | 1.22 ± 0.14 | 2.43 ± 0.14 | 0.16 ± 0.05 | 0.18 ± 0.06 |
| Sep 2013 | 1.96 ± 0.32 | 7.43 ± 0.58 | 1.12 ± 0.15 | 1.82 ± 0.15 | 0.15 ± 0.03 | 0.18 ± 0.03 |
| Oct 2013 | 2.90 ± 0.64 | 8.32 ± 1.15 | 1.681 | 2.951 | 0.261 | 0.311 |
| Nov 2013 | 3.66 ± 1.62 | 11.26 ± 4.78 | 1.85 ± 0.71 | 4.62 ± 1.71 | 0.42 ± 0.20 | 0.53 ± 0.19 |
| Dec 2013 | ||||||
| Jan 2014 | 3.2 ± 1.21 | 12.35 ± 3.95 | 1.57 ± 0.49 | 3.74 ± 1.13 | 0.37 ± 0.17 | 0.46 ± 0.20 |
| Feb 2014 | 1.831 | 10.051 | 1.54 ± 0.03 | 3.15 ± 0.99 | 0.28 ± 0.17 | 0.33 ± 0.18 |
reported values correspond to one set of sampling
Similar to PM2.5, PM0.18 mass sustains a stable pattern throughout different months with average concentration of 2.3±0.4 μg/m3 in Central LA and 2.6±0.7 μg/m3 in Anaheim, as seen in Table 1.
3.2 Carbonaceous species (EC-OC)
Monthly average mass concentration of EC and OC are illustrated in Figure 1 for Central LA and Anaheim and the actual concentrations are presented in Table 1. EC, a key tracer of diesel exhaust in LA Basin (Schauer, 2003) constitutes about 4.1% and 3.2% of total PM2.5 mass in Central LA and Anaheim, respectively. Although EC constitutes a small fraction of ambient PM2.5, it is widely considered as one of the key indicators of PM adverse health effects (Janssen et al., 2011). As seen in Figure 1, the majority of PM2.5 EC is partitioned into the ultrafine mode (55% and 82% in Central LA and Anaheim, respectively, on average over all months). EC concentrations in both size fractions were overall higher in Central LA than Anaheim (1.2-fold and 1.7-fold in PM0.18 and PM2.5, respectively), highlighting the importance of primary combustion emissions (particularly vehicular sources) at the near-freeway site.
Figure 1. a-b. Monthly average concentration of Elemental Carbon (EC) and Organic Carbon (OC) (μg/m3) for PM2.5 and PM0.18 in a) Central Los Angeles and b) Anaheim.

OC can be directly emitted from primary sources, such as fossil fuel combustion, or produced via secondary formation processes. Unlike EC, OC shows a distinctive temporal variability at both sites, with monthly average PM2.5 OC concentrations varying from 1.86 to 3.97 μg/m3 in Central LA and from 1.64 to 4.62 μg/m3 in Anaheim. OC concentrations in both size fractions were overall higher in colder months compared to warmer months at both sites. This elevated concentration can be mainly due to higher atmospheric stability conditions and favored particle formation/growth by condensable organics freshly emitted from vehicles (Kim et al., 2002). The average values for OC in the ultrafine size fraction are 1.08±0.17 μg/m3 and 1.42±0.31 at Central LA and Anaheim, respectively.
3.3 Organic compounds
3.3.1 Polycyclic Aromatic Hydrocarbons (PAHs)
Particle-bound PAHs are common products of incomplete combustion of fossil fuels (Manchester-Neesvig et al., 2003). The concentrations of these compounds, which are known to be toxic and carcinogenic (Boström et al., 2002; Li et al., 2003), are significantly affected by several factors such as atmospheric conditions, source strength, gas-particle partitioning, and deposition processes (Polidori et al., 2008). In the LA urban area, gasoline- and diesel- fuelled vehicles, as well as biomass burning are the major sources of ambient PAHs (Polidori et al., 2008). Studies have shown that diesel vehicle emissions are enriched in lower molecular weight PAHs, whereas higher molecular weight PAHs are associated with gasoline vehicle emissions (Geller et al., 2006; Rogge et al., 1991). Figure 2 displays the monthly average concentrations of selected PAHs for both size fractions and sampling sites. Total concentration of PAHs is also reported in Tables S2 and S3. Generally, concentrations of PAHs in both size fractions are higher in the near-freeway Central LA sampling site compared to Anaheim. On average over all sampling months, concentration of total PM2.5 PAHs was over 60% higher in Central LA (1.11±0.67 ng/m3) compared to Anaheim (0.68±0.54 ng/m3).
Figure 2. a-b. Monthly average concentration of selected polycyclic aromatic hydrocarbons (PAHs) (ng/m3) for PM2.5 and PM0.18 in a) Central Los Angeles and b) Anaheim.

A clear seasonality in the cumulative concentration of selected PAHs is observed at both sampling sites, with higher levels in colder months, while lower or below detection limit in warmer months. The elevated concentration of PAHs in the colder months is mainly due to the enhanced atmospheric stability and higher emissions from fossil fuel combustions during this period of the year, in addition to higher gas-to-particle partitioning of the semi-volatile species favored at lower temperatures. Furthermore, a notable source of higher molecular weight PAHs (e.g. benzo(ghi)perylene and indeno(1,2,3-cd) pyrene) in the cold season is the cold-start spark-ignition of gasoline vehicles (Fine et al., 2004; Lough et al., 2007; Miguel et al., 1998). On the other hand, oxidizing gases such as ozone, nitrogen oxides and hydrogen peroxide can react with PAHs and lower their concentrations (Grosjean et al., 1983) and these reactions are more pronounced during warmer months. Hence, reaction with oxidizing gases in addition to combined volatilization effect can be conducive to lower PAH concentration in warmer months (Arey et al., 1988; Grosjean et al., 1983).
3.3.2 Hopanes and Steranes
Hopanes and steranes are organic tracers of vehicular emissions (Zheng et al., 2002) and are mainly emitted from lubrication oil of gasoline- and diesel- fueled vehicles (Schauer et al., 1996). Hopanes and steranes are reasonably stable compounds during transport from source to receptor, and therefore are reliable tracers of mobile source emissions in this area for source apportionment using receptor models (Heo et al., 2013). Figure 3 displays the variation of selected hopanes and steranes (including 17α(H)-22,29,30-trisnorhopane, 17α(H)-21β(H)-hopane, 17 α (H)-21β(H)-30-norhopane, 22S-homohopane, 22R-homohopane, ABB-20RC27-cholestane, ABB-20R-C29-sitostane, ABB-20S-C29-sitostane) over the sampling months for the two sites and size fractions. The monthly average concentrations of total hopanes and steranes are also presented in Tables S2 and S3.
Figure 3. a-b. Monthly average concentration of selected hopanes and steranes (ng/m3) for PM2.5 and PM0.18 in a) Central Los Angeles and b) Anaheim.

On average, cumulative concentrations of the aforementioned compounds were about 1.8 and 1.6 times higher in Central LA compared to Anaheim for PM2.5 and PM0.18 particles, respectively, indicating higher contributions from vehicular emissions in Central LA. The seasonal average concentration of selected hopanes and steranes in the ultrafine size range varies from 0.11±0.02 ng/m3 in warmer months to 0.23±0.06 ng/m3 in colder months in Central LA, whereas in Anaheim these compounds have a lower concentration ranging from 0.04±0.004 ng/m3 in warmer months to 0.17±0.06 ng/m3 in colder months. These seasonal and spatial variations reflect the combined changes in source strength and atmospheric mixing height. Hopanes and steranes had a higher per mass contribution to the ultrafine mode at both sites compared to PM2.5 size fraction, which is consistent with the findings of Arhami et al. (2009) and Ning et al. (2007), indicative of the higher abundance of sub-micron fresh primary emissions at both sites.
3.3.3. n-alkanes
Figure 4 shows the concentration of individual n-alkanes (namely C19-C38) at both sites and size ranges. Moreover, total concentrations of n-alkanes are presented in Tables S2 and S3 for reference. Sum of all measured n-alkanes in PM2.5 was 14.7±2.4 ng/m3 and 15.6±4.8 ng/m3 in colder months in Central LA and Anaheim, respectively. On the other hand, warmer months' concentrations were 7.3±1.5 ng/m3 and 7.9±1.6 ng/m3, indicating about 2 fold increase in colder months period in both sites. The lower levels of n-alkanes during warmer months could be due to volatilization of particulate phase into gas phase (Ruehl et al., 2011). Furthermore, the elevated concentration in colder months can be attributed to the lower atmospheric mixing height in the winter that limited dilution of total n-alkanes, in addition to the increased source strengths of these species in the winter. In order to distinguish the biogenic and anthropogenic- derived n-alkanes, Carbon Preference Index (CPI) was calculated at each site (Figure 4 and Table S4). CPI is defined as the sum of concentration of odd-carbon alkanes divided by that of even-carbon alkanes (Simoneit, 1986). CPI values shown in Figure 4 are all between 1 and 2 indicating the pre-dominance of anthropogenic emissions of n-alkanes both in Central LA and Anaheim.
Figure 4.

a-b. Monthly average concentration of n-alkanes (ng/m3) for PM2.5 and PM0.18 in a) Central Los Angeles and b) Anaheim. Black dots are the Carbon Preference Index (CPI). Error bars correspond to one standard deviation.
3.3.4 Organic acids
Organic acids are either directly emitted from various natural and anthropogenic sources (Oliveira et al., 2007) or secondarily formed from oxidation of gas-phase precursors followed by gas/particle partition (Wang et al., 2012). Pyrolysis of vegetative material, vehicular emissions, photo-oxidation of aromatic hydrocarbons, and the oxidative decay of higher carbon number organic acids (Sorooshian et al., 2007) are some major sources of theses acids. Overall, higher concentrations, along with more distinctive temporal variability, are observed at Central LA compared to Anaheim. Sum of organic acids concentrations from C15 to C30 in PM2.5 increased by 131% and 51% in Central LA and Anaheim from warmer to colder months. Figure S2 illustrates the spatial and temporal variability of the aforementioned organic acids. C16 and C18 are the dominant species in both sampling sites and size fractions. Previous studies have shown that the lower molecular weight n-alkanoic acids (<C20) are mainly found in emissions from petroleum-based sources, such as gasoline and diesel vehicles (Rogge et al., 1993; Schauer et al., 2002), and fuel oil combustion (Rogge et al., 1997). Oliveira et al. (2007) has also argued that the release of organic acids from fossil fuel combustion is an important source of the lower molecular weight n-alkanoic acids, peaking at C16, consistent with our findings. On the other hand, emissions from biogenic sources are the main source of the higher molecular weight (C>20) organic acids (Park et al, 2006). As can be seen in Figure S2, concentration of C16 in both size fraction is comparatively much higher in Central LA than Anaheim (by a factor of 1.5 and 1.8 in PM0.18 and PM2.5, respectively), reaffirming the significant influence of vehicular emission in the sampling site in Central LA.
3.3.5 Levoglucosan
This compound, which is generated by pyrolysis of cellulose, is a tracer of biomass burning emissions (Fine et al., 2004; Schauer and Cass, 2000; Simoneit, 1999). Monthly average levels of levoglucosan are depicted for PM0.18 and PM2.5 at both sites in Figure 5. The average concentration of levoglucosan in PM2.5 is 5.7±2.8 ng/m3 in warmer months and 73.1±101.5 ng/m3 during colder months in Central LA. For the same size fraction in Anaheim the concentration varies from 8.4±1.07 ng/m3 in warmer months to 50.2±26.4 ng/m3 in colder months. This trend clearly reveals the higher wood burning activities, particularly for domestic heating purposes in colder months. Similarly, levoglucosan in ultrafine mode shows a distinct seasonality, with a minimum seasonal average concentration in warmer months (1.6±0.7 ng/m3 and 2.5±0.6 ng/m3) to a maximum in colder months (72.7±69.5 ng/m3 and 18.1±10.5 ng/m3) for Central LA and Anaheim, respectively. Monthly average concentrations of levoglucosan have been also presented in Tables S2 and S3.
Figure 5.

a-b. Monthly average concentration of levoglucosan (ng/m3) for PM2.5 and PM0.18 in a) Central Los Angeles and b) Anaheim. Error bars correspond to one standard deviation.
3.4. Source apportionment of organic carbon in PM2.5 and PM0.18
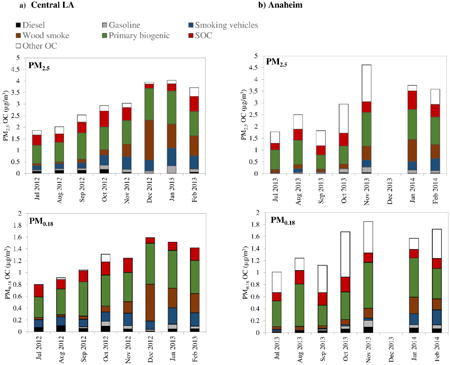
Monthly average source contribution estimates as well as analytical diagnostic values (i.e. R2, CHI square and % mass) from MM-CMB model are presented in Tables S5 and S6. Weekly results of the CMB source contribution estimates were averaged to obtain monthly average source contributions, presented in Figure 6 for PM2.5 and PM0.18 at both sites. Contribution of mobile sources to PM2.5 OC fraction was about 0.65±0.25 μg/m3 (21% of total OC) in Central LA and 0.32±0.25 μg/m3 (9.4% of OC) in Anaheim. In the ultrafine size fraction, OC from mobile sources accounts for about 23% and 11% of total OC in Central LA and Anaheim, respectively. Contribution of mobile sources to PM2.5 OC increased by a factor of 1.9 and 4.5 in Central LA and Anaheim, respectively, in the colder period compared to the warmer months. Contribution of primary biogenic sources (including emissions from vegetative detritus, food cooking, and re-suspended soil dust) to total OC concentration was on average, 1.07±0.30 and 1.01±0.36 μg/m3 for PM2.5 in Central LA and Anaheim, respectively. Primary biogenic source is characterized by high concentrations of odd alkane and n-alkanoic acids. Therefore, there is a possibility that several sources, such as vegetative detritus, meat smoke and possibly soil debris, were included in primary biogenic source (Heo et al., 2013). Wood smoke showed a pronounced seasonal pattern, peaking in the colder months, with an average PM2.5 OC contribution of 17.8 and 15.6% in Central LA and Anaheim, respectively. The higher wood smoke contribution in colder months is mainly associated with higher biomass burning and/or wood combustion during colder months. Contribution of anthropogenic SOC to PM2.5 ranged from 0.19-0.70 μg/m3 and 0.29-0.79 μg/m3 in Central LA and Anaheim, respectively. For the ultrafine size fraction, SOC contributed to 16% and 13.2% of total OC concentrations in Central LA and Anaheim, respectively. Unidentified OC, denoted as “other OC”, is the residual difference between the measured OC and the sum of all source contribution estimates considered in the MM-CMB model. “Other OC” accounts for primary sources not considered in the model (e.g. natural gas combustion, ship emissions, etc.), along with partial contribution from secondary sources which might not be captured by the SOC profile included in the model. In Central LA, “other OC” accounted for 0.23±0.10 μg/m3 of PM2.5 and PM0.18 OC contribution was negligible on average over all sampling months, respectively. Contribution of “other OC” was relatively higher in Anaheim than Central LA, with monthly average concentrations of 0.77±0.46 μg/m3 and 0.42±0.20 μg/m3 in PM2.5 and PM0.18 size fractions, respectively. These results indicate that in Central LA “other OC” accounted for about 8% and 0.7% of PM2.5 and PM0.18, respectively. Therefore, it can be inferred that measured OC was apportioned to a reasonable extent and there should not be any other major sources of OC in Central LA that were not considered in the model. Moreover, The source profiles which were used in our hybrid CMB model were reported by several previous studies to be major sources of organic carbon in the LA Basin (Arhami et al., 2010; Hasheminassab et al., 2013; Minguillón et al., 2008; Pratsinis et al., 1984; Schauer et al., 1996; Williams et al., 2010; Zhang et al., 2013). In Anaheim, contribution of “other OC” was relatively higher, averaging 29% and 32% for PM2.5 OC and PM0.18 OC, respectively. Elevated contribution of “other OC” in Anaheim could be attributed to the fact that the same PMF-derived source profiles derived at Central LA were applied to Anaheim, while the detailed nature of the SOC and primary biogenic aerosols may not be an exact match for these two sites due to their distinctive locations and PM emission sources. As discussed above, Anaheim is located in the prevalent air trajectory crossing the LA basin from coast to inland, and thus affected by advection of aged and photo-chemically processed PM from upwind regions. To develop improved and more accurate results using this new hybrid model, it is recommended that future studies apply site-specific PMF-derived source profiles as input for their MM-CMB model.
Figure 6.

a-b. Monthly average source contributions (μg/m3) to ambient OC for PM2.5 and PM0.18 in a) Central Los Angeles and b) Anaheim. Primary biogenic source accounts for emissions from vegetative detritus, food cooking and re-suspended soil dust.
4. Historical trends
Starting in 2007, major modifications were implemented on federal, state, and local regulations on vehicular emissions. In the LA Basin, Hasheminassab et al. (2014a) showed a reduction of 20-25% in PM2.5 originating from vehicular emissions, as the result of stringent regulations implemented after 2007. Whereas historical trends in PM mass concentration levels imply an overall reduction in total PM emissions, examination of specific organic tracers could provide additional insight on the extent to which these decreasing PM trends are ensued specifically from vehicular emissions and may assist regulatory agencies in the design and implementation of more effective strategies to protect public health. In order to assess the impact of regulations on vehicular emissions, the concentrations of carbonaceous species and organic compounds in PM2.5 and PM0.18 size fractions were examined, using the PM data acquired in earlier studies conducted over the past decade in our sampling site in Central LA. Table 2 summarizes the sampling period and instruments used to collect PM2.5 and PM0.18 in each study. For the year-long studies (i.e. Heo et al., (2013), and Sardar et al., (2005)) average concentrations between July and February are reported to be consistent with the sampling period of this study.
Table 2. a-b Reported concentrations of carbonaceous species and organic compounds in Central Los Angeles for a) PM2.5 and b) PM0.18 size fractions.
| a) PM2.5 | |||||||||||
|---|---|---|---|---|---|---|---|---|---|---|---|
|
| |||||||||||
| Study | Sardar et al. 2005 | Fine et al. 2004 | Minguillón et al. 2008 | Verma et al. 2009 | Heo et al. 2013 | Current study | |||||
| Instrument | MOUDI | High-vol sampler | PCIS1 | High-vol sampler | URG-3000B medium volume sampler | MOUDI | |||||
| Size fraction | PM2.5 | PM2.5 | PM2.5 | PM2.5 | PM2.5 | PM2.5 | |||||
| Sampling year | 2002-2003 | 2002-2003 | 2007 | 2008 | 2009-2010 | 2012-2013 | |||||
| Season | Aug-Feb | Aug | Jan | Jul-Sep | Jun-Aug | Jul-Feb | Jul-Feb | ||||
| Carbonaceous/organic species | |||||||||||
| OC (μg/m3) | 6.98 ± 2.23 | - | - | 3.98 ± 1.03 | - | 4.67 ± 0.92 | 2.91 ± 0.74 | ||||
| EC (μg/m3) | 1.11 ± 0.53 | - | - | 0.72 ± 0.15 | - | 0.99 ± 0.39 | 0.52 ± 0.10 | ||||
| PAHs (ng/m3) | - | 0.25 ± 0.152 | 1.04 ± 0.572 | 0.30 ± 0.08 | 1.77 ± 1.40 | 1.91 ± 1.26 | 1.11 ± 0.66 | ||||
| Hopanes+Steranes (ng/m3) | - | 0.89 ± 0.263 | 1.03 ± 0.273 | 1.03 ± 0.23 | 1.90 ± 1.51 | 1.19 ± 0.44 | 0.61 ± 0.34 | ||||
| n-Alkanes (ng/m3) | - | - | - | 20.03 ± 21.4 | 45.83 ± 21.04 | 25.03 ± 7.89 | 11.76 ± 4.26 | ||||
| Organic acids (ng/m3) | - | - | - | 79.11 ± 15.23 | 105.66 ± 8.71 | 204.58 ± 71.6 | 99.81 ± 39.75 | ||||
| Levoglucosan (ng/m3) | - | 6.13 ± 3.11 | 73.5 ± 31.62 | 0.75 ± 1.0 | BDL | 72.81 ± 67.82 | 47.81 ± 57.34 | ||||
|
| |||||||||||
| b) PM0.18 | |||||||||||
|
| |||||||||||
| Study | Sardar et al. 2005 | Fine et al. 2004 | Ning et al. 2007 | Current study | |||||||
|
| |||||||||||
| Instrument | MOUDI | High-vol sampler | High-vol sampler/MOUDI | MOUDI | |||||||
| Size fraction | PM0.18 | PM0.18 | PM0.18 | PM0.18 | |||||||
| Sampling year | 2002-2003 | 2002-2003 | 2006 | 2012-2013 | |||||||
| Season | Aug-Feb | Aug | Jan | Jun-Jul | Jul-Feb | ||||||
| Carbonaceous/organic species | |||||||||||
| OC (μg/m3) | 2.13 ± 0.48 | - | - | 1.55 ± 0.21 | 1.09 ± 0.22 | ||||||
| EC (μg/m3) | 0.41 ± 0.13 | - | - | 1.2 ± 0.71 | 0.29 ± 0.05 | ||||||
| PAHs (ng/m3) | - | 0.19 ± 0.142 | 0.81 ± 0.552 | 1.21 ± 1.02 | 0.44 ± 0.26 | ||||||
| Hopanes+Steranes (ng/m3) | - | 0.75 ± 0.253 | 0.7 ± 0.243 | 2.52 ± 0.52 | 0.22 ± 0.13 | ||||||
| n-Alkanes (ng/m3) | - | - | - | 20.95 ± 13.08 | 5.02 ± 2.24 | ||||||
| Organic acids (ng/m3) | - | - | - | 277.05 ± 134.42 | 47.26 ± 16.17 | ||||||
| Levoglucosan (ng/m3) | - | 1.25 ± 0.35 | 29.25 ± 20.55 | - | 21.59 ± 37.75 | ||||||
Sioutas Personal Cascade Impactor Samplers (Sioutas™ PCIS, SKC Inc., Eighty Four, PA, USA)
Reported values correspond to the concentration of Benzo(ghi)perylene only
Reported values correspond to total hopanes only
The values presented in Table 2 reveal an overall decrease in the concentration of carbonaceous species (i.e. EC and OC) in Central LA over the past decade. The average PM2.5 OC concentration obtained in this study is 2.91±0.74 μg/m3, which is 56% and 38% lower than the values reported by Sardar et al. (in 2002-2003) and Heo et al. (in 2009-2010), respectively. As can be inferred from Tables 2a and S3a, comparison with (Minguillón et al., 2008) shows a reduction of 16% in PM2.5 OC concentration in the corresponding sampling months in their study. Likewise, PM2.5 EC concentrations decreased from an average value of 1.11 ± 0.53 μg/m3 in 2002-2003 (Sardar et al., 2005) to 0.52 ± 0.10 μg/m3 in this study (i.e. near 75% reduction). In PM0.18, comparison of the results between this study and those reported by Sardar et al. (2005) and Ning et al. (2007) indicates 8-30% and 42-76% reductions in the concentrations of OC and EC, respectively. T-tests showed that all of the aforementioned reductions were statistically significant at 95% confidence level (i.e. p < 0.05).
Hopanes and steranes, well-established organic tracers of vehicular emissions, showed dramatic reductions in Central LA. In 2009-2010, Heo et al. (2013) reported an average value of 1.19±0.44 ng/m3 for the sum of hopanes and steranes for PM2.5 OC. About 3 years later, in the current study, this average value decreased by nearly 48% to 0.61±0.34 ng/m3. In PM0.18, Ning et al. (2007) reported an average value of 2.52±0.52 ng/m3 for the sum of hopanes and steranes during June and July, while in this study the average cumulative concentration of these compounds in PM0.18 is 0.12±0.01 ng/m3 in July. Overall, these trends are in line with the findings of Hasheminassab et al. (2014a), who showed significant reductions in the contribution of vehicular emissions to ambient PM2.5 in Central LA after 2007, following the implementation of major federal, state, and local regulations on vehicular emissions. PAHs followed similar trends to hopanes and steranes with lowest concentrations observed in this study in both size fractions. For PM2.5, Heo et al. (2013) reported an average concentration of 1.91±1.26ng/m3 for total PAHs in July 2009 to February 2010, while in the current study this average value reached 1.11±0.66 ng/m3 (i.e. near 41% reduction) in the corresponding months. For PM0.18, average concentration of PAHs in this study in July was about 6 times lower than the average value reported by Ning et al. (2007). Moreover the reduction trend in PAHs level is also evident in comparison with the studies of Verma et al. (2009) and Minguillón et al. (2008), who reported average concentrations of 1.77±1.40 and 0.30±0.08 μg/m3 for PM2.5 –bound PAHs in Jun- Aug 2008 and Jul-Sep 2007, respectively.
In another study conducted by Fine et al. (2004) during 2002-2003 in the same location, the diurnal variation of individual organic compounds in two separate months (August and January, representing the typical warm and cold seasons in LA basin, respectively) was investigated. In Table 2, the average concentrations of benzo(ghi)perylene (BgP), total hopanes, and levoglucosan in both size fractions from study of Fine et al. (2004) are reported. BgP is a PAH with a high molecular weight, emitted mostly from gasoline vehicles (Miguel et al., 1998). In the current study the average BgP concentrations in PM0.18 in the months of August and January are 0.07±0.03 and 0.15±0.02 ng/m3, respectively, indicating a roughly 80-90% reduction compared to the values reported by Fine et al. (2004) about a decade ago. The concentration of BgP in PM2.5 in months of August and January also showed a significant reduction of 49-72%. Average of total hopanes concentration in the months of August and January decreased 63% and 33% in PM0.18 and PM2.5, respectively. These findings again corroborate the major reduction of the tracers of vehicular sources in Central LA in the past decade.
The average concentration of levoglucosan for PM2.5 size fraction in this study decreased in comparison to the values reported in previous years in Central LA. Table 2 illustrates that the contribution of biomass burning in this area has decreased by 34% from 2009 to 2013.
Source contribution estimates for PM2.5 OC from previous studies in Central LA were pooled together and compared to the findings of this study. Minguillón et al. (2008) reported an average value of 2.46±0.61μg/m3 for mobile source contribution (gasoline and diesel) between July and September 2007, while in this study mobile source contribution was evaluated as 0.40±0.15 μg/m3 for PM2.5 OC in the corresponding months indicating an 83% reduction in vehicular emissions. Similarly, comparison to study of Heo et al. (2013) also revealed a 57% reduction in mobile source contribution estimates. The reduction trend in vehicular emissions underscores the impact of implementing major regulations and improvement in emission control techniques. A recent study by Posner and Pandis, (2015) in Eastern US reported that gasoline accounts for majority of number concentration of ultrafine particles with diameter greater than 3nm and contributed almost equally with industrial and diesel emission for ultrafine particles with diameter between 10-100nm. In the current study, on the other hand, contribution of gasoline and diesel vehicles to PM0.18 mass was quite similar, accounting for 3% and 4% of total mass, respectively.
Lastly, it is noteworthy that Hasheminassab et al. (2014a) showed that the levels of important parameters of meteorological conditions such as temperature and relative humidity were quite consistent from 2002 to 2013 over the LA Basin which underscores the fact that reduction in organic compounds and mobile source contributions were not due to changes in meteorological conditions, but rather due to major regulations implemented on vehicular emissions.
The findings of the current study are in line with studies of Docherty et al. (2008) and Williams et al. (2010) conducted in Southern California which also showed that the contribution of mobile sources to OC is becoming less important than the contribution of SOC. Williams et al. (2010) found four distinct sources of SOC along with sources of vehicular emissions, primary biogenic, food cooking and biomass burning in Southern California. Given the significant reduction emissions from vehicular sources in the past decade in the LA Basin (Bishop et al., 2013; Hasheminassab et al., 2014a), the impact of SOC and primary biogenic emissions are becoming increasingly important and the new hybrid model introduced in this study allows the impact of these sources to be better quantified. The indirect contribution of vehicular emissions to anthropogenic SOC in the Los Angeles basin remains an important subject requiring further investigation, as recent studies have reported inconsistent results. For instance, some of the studies conducted through the CalNex campaign (Research at the Nexus of Air Quality and Climate Change) concluded that in order to reduce the levels of SOC in Southern California, reduction of emissions from motor vehicles should be taken in to account (Bahreini et al., 2012; Hayes et al., 2013). In contrast, Ensberg et al. (2014) argued that vehicular emissions might not be the primary contributor of anthropogenic SOC in the LA Basin.
5. Summary and conclusions
To determine the organic constituents of ambient PM and quantify the source contributions to PM2.5 and PM0.18 OC, a sampling campaign was conducted at Central LA from July 2012 to February 2013 and at Anaheim form July 2013 to February 2014. In summary, monthly averages of total PAHs, hopanes and steranes were higher in Central LA than Anaheim. A CPI value obtained between 1 and 2 for n-alkanes revealed that these organic compounds are predominantly originated from anthropogenic sources. C16 and C18, tracers of the vehicular emissions, were the dominant organic acids in both sampling sites and size fractions, with significantly higher levels in Central LA. Levoglucosan showed pronounced seasonal variability with highest peaks in colder months at both sites. Higher concentrations of PAHs, hopanes and steranes were observed in colder months as well.
A novel hybrid MM-CMB model was introduced and applied in this study to estimate the contributions from a variety of sources. Wood smoke, primary biogenic sources (including emissions from vegetative detritus, food cooking, and re-suspended soil dust), and SOC source profiles were obtained from Heo et al. (2013), who performed a PMF analysis on ambient organic molecular markers in Central LA. In addition, mobile source profiles (including gasoline, diesel, and smoking vehicles) from Lough et al. (2007) were used in the hybrid MM-CMB model. Source contribution estimates of PM2.5 OC from mobile, primary biogenic, wood smoke and SOC were 15%, 36%, 17% and 17%, respectively at both sites. Based on the MM-CMB model output, a 57% decrease in contribution of mobile sources to the total OC from 2009 to 2013 was estimated. Comparison to previous studies in Central LA indicated that PAHs concentrations decreased by 40-70% from 2008-2013. Hopanes and steranes, important tracers of vehicular emissions, also decreased by roughly 50-70% over the past decade in Central LA. The reduction trend in vehicular emissions tracers indicates the impact of implemented regulations on vehicular emissions in LA Basin in the past decade. This has likely had a positive impact on public health as recently evidenced in a study showing improvements in pediatric lung-function growth that paralleled improvements air quality from the 1990s compared with the period of 2007 to 2011 in the LA basin (Gauderman et al., 2015).
Supplementary Material
Highlights.
PM0.18 and PM2.5 were collected at two distinct locations in the Los Angeles Basin.
A hybrid molecular marker-based chemical mass balance model is used.
Concentration of Carbonaceous and organic constituents of fine and ultrafine PM significantly reduced in the Los Angeles Basin over the past decade.
Reduction in mobile emissions tracers revealed the implemented regulation on vehicular emissions have been effective.
Acknowledgments
The present project was supported by grant number ES12243 from the National Institute of Environmental Health Sciences, U.S. National Institutes of Health. The authors wish to thank the staffers at the Wisconsin state laboratory of hygiene for their assistance with the chemical analysis. We also acknowledge the support of USC's Provost and Viterbi PhD fellowships.
Footnotes
Publisher's Disclaimer: This is a PDF file of an unedited manuscript that has been accepted for publication. As a service to our customers we are providing this early version of the manuscript. The manuscript will undergo copyediting, typesetting, and review of the resulting proof before it is published in its final citable form. Please note that during the production process errors may be discovered which could affect the content, and all legal disclaimers that apply to the journal pertain.
References
- Arangio AM, Slade JH, Berkemeier T, Pöschl U, Knopf DA, Shiraiwa M. Multiphase Chemical Kinetics of OH Radical Uptake by Molecular Organic Markers of Biomass Burning Aerosols: Humidity and Temperature Dependence, Surface Reaction, and Bulk Diffusion. J Phys Chem A. 2015;119:4533–4544. doi: 10.1021/jp510489z. [DOI] [PubMed] [Google Scholar]
- Araujo JA, Barajas B, Kleinman M, Wang X, Bennett BJ, Gong KW, Navab M, Harkema J, Sioutas C, Lusis AJ, Nel AE. Ambient Particulate Pollutants in the Ultrafine Range Promote Early Atherosclerosis and Systemic Oxidative Stress. Circ Res. 2008;102:589–596. doi: 10.1161/CIRCRESAHA.107.164970. [DOI] [PMC free article] [PubMed] [Google Scholar]
- Arey J, Zielinska B, Atkinson R, Winer AM. Formation of nitroarenes during ambient high-volume sampling. Environ Sci Technol. 1988;22:457–462. doi: 10.1021/es00169a015. [DOI] [Google Scholar]
- Arhami M, Minguillón MC, Polidori A, Schauer JJ, Delfino RJ, Sioutas C. Organic compound characterization and source apportionment of indoor and outdoor quasi-ultrafine particulate matter in retirement homes of the Los Angeles Basin. Indoor Air. 2010;20:17–30. doi: 10.1111/j.1600-0668.2009.00620.x. [DOI] [PMC free article] [PubMed] [Google Scholar]
- Arhami M, Sillanpää M, Hu S, Olson MR, Schauer JJ, Sioutas C. Size-Segregated Inorganic and Organic Components of PM in the Communities of the Los Angeles Harbor. Aerosol Sci Technol. 2009;43:145–160. doi: 10.1080/02786820802534757. [DOI] [Google Scholar]
- Bahreini R, Middlebrook AM, de Gouw JA, Warneke C, Trainer M, Brock CA, Stark H, Brown SS, Dube WP, Gilman JB, Hall K, Holloway JS, Kuster WC, Perring AE, Prevot ASH, Schwarz JP, Spackman JR, Szidat S, Wagner NL, Weber RJ, Zotter P, Parrish DD. Gasoline emissions dominate over diesel in formation of secondary organic aerosol mass. Geophys Res Lett. 2012;39:L06805. doi: 10.1029/2011GL050718. [DOI] [Google Scholar]
- Birch ME, Cary RA. Elemental Carbon-Based Method for Monitoring Occupational Exposures to Particulate Diesel Exhaust. Aerosol Sci Technol. 1996;25:221–241. doi: 10.1080/02786829608965393. [DOI] [PubMed] [Google Scholar]
- Bishop GA, Schuchmann BG, Stedman DH. Heavy-Duty Truck Emissions in the South Coast Air Basin of California. Environ Sci Technol. 2013;47:9523–9529. doi: 10.1021/es401487b. [DOI] [PubMed] [Google Scholar]
- Boström CE, Gerde P, Hanberg A, Jernström B, Johansson C, Kyrklund T, Rannug A, Törnqvist M, Victorin K, Westerholm R. Cancer risk assessment, indicators, and guidelines for polycyclic aromatic hydrocarbons in the ambient air. Environ Health Perspect. 2002;110:451–488. doi: 10.1289/ehp.110-1241197. [DOI] [PMC free article] [PubMed] [Google Scholar]
- Cabada JC, Rees S, Takahama S, Khlystov A, Pandis SN, Davidson CI, Robinson AL. Mass size distributions and size resolved chemical composition of fine particulate matter at the Pittsburgh supersite. Atmos Environ, Findings from EPA's Particulate Matter Supersites Program. 2004;38:3127–3141. doi: 10.1016/j.atmosenv.2004.03.004. [DOI] [Google Scholar]
- Campbell A, Oldham M, Becaria A, Bondy SC, Meacher D, Sioutas C, Misra C, Mendez LB, Kleinman M. Particulate Matter in Polluted Air May Increase Biomarkers of Inflammation in Mouse Brain. NeuroToxicology. 2005;26:133–140. doi: 10.1016/j.neuro.2004.08.003. [DOI] [PubMed] [Google Scholar]
- Cho AK, Sioutas C, Miguel AH, Kumagai Y, Schmitz DA, Singh M, Eiguren-Fernandez A, Froines JR. Redox activity of airborne particulate matter at different sites in the Los Angeles Basin. Environ Res. 2005;99:40–47. doi: 10.1016/j.envres.2005.01.003. [DOI] [PubMed] [Google Scholar]
- Chow JC, Watson JG, Lowenthal DH, Chen LWA, Zielinska B, Mazzoleni LR, Magliano KL. Evaluation of organic markers for chemical mass balance source apportionment at the Fresno Supersite. Atmos Chem Phys. 2007;7:1741–1754. doi: 10.5194/acp-7-1741-2007. [DOI] [Google Scholar]
- de Kok TMCM, Driece HAL, Hogervorst JGF, Briedé JJ. Toxicological assessment of ambient and traffic-related particulate matter: A review of recent studies. Mutat Res Mutat Res. 2006;613:103–122. doi: 10.1016/j.mrrev.2006.07.001. [DOI] [PubMed] [Google Scholar]
- Delfino RJ, Sioutas C, Malik S. Potential Role of Ultrafine Particles in Associations between Airborne Particle Mass and Cardiovascular Health. Environ Health Perspect. 2005;113:934–946. doi: 10.1289/ehp.7938. [DOI] [PMC free article] [PubMed] [Google Scholar]
- Delfino RJ, Staimer N, Tjoa T, Arhami M, Polidori A, Gillen DL, George SC, Shafer MM, Schauer JJ, Sioutas C. Associations of Primary and Secondary Organic Aerosols With Airway and Systemic Inflammation in an Elderly Panel Cohort. Epidemiol Camb Mass. 2010a;21 doi: 10.1097/EDE.0b013e3181f20e6c. [DOI] [PMC free article] [PubMed] [Google Scholar]
- Delfino RJ, Staimer N, Tjoa T, Arhami M, Polidori A, Gillen DL, Kleinman MT, Schauer JJ, Sioutas C. Association of Biomarkers of Systemic Inflammation with Organic Components and Source Tracers in Quasi-Ultrafine Particles. Environ Health Perspect. 2010b;118:756–762. doi: 10.1289/ehp.0901407. [DOI] [PMC free article] [PubMed] [Google Scholar]
- Docherty KS, Stone EA, Ulbrich IM, DeCarlo PF, Snyder DC, Schauer JJ, Peltier RE, Weber RJ, Murphy SM, Seinfeld JH, Grover BD, Eatough DJ, Jimenez JL. Apportionment of Primary and Secondary Organic Aerosols in Southern California during the 2005 Study of Organic Aerosols in Riverside (SOAR-1) Environ Sci Technol. 2008;42:7655–7662. doi: 10.1021/es8008166. [DOI] [PubMed] [Google Scholar]
- Ensberg JJ, Hayes PL, Jimenez JL, Gilman JB, Kuster WC, de Gouw JA, Holloway JS, Gordon TD, Jathar S, Robinson AL, Seinfeld JH. Emission factor ratios, SOA mass yields, and the impact of vehicular emissions on SOA formation. Atmos Chem Phys. 2014;14:2383–2397. doi: 10.5194/acp-14-2383-2014. [DOI] [Google Scholar]
- Fine PM, Cass GR, Simoneit BRT. Chemical Characterization of Fine Particle Emissions from the Fireplace Combustion of Wood Types Grown in the Midwestern and Western United States. Environ Eng Sci. 2004;21:387–409. doi: 10.1089/109287504323067021. [DOI] [Google Scholar]
- Fine PM, Chakrabarti B, Krudysz M, Schauer JJ, Sioutas C. Diurnal Variations of Individual Organic Compound Constituents of Ultrafine and Accumulation Mode Particulate Matter in the Los Angeles Basin. Environ Sci Technol. 2004;38:1296–1304. doi: 10.1021/es0348389. [DOI] [PubMed] [Google Scholar]
- Gauderman WJ, Urman R, Avol E, Berhane K, McConnell R, Rappaport E, Chang R, Lurmann F, Gilliland F. Association of Improved Air Quality with Lung Development in Children. N Engl J Med. 2015;372:905–913. doi: 10.1056/NEJMoa1414123. [DOI] [PMC free article] [PubMed] [Google Scholar]
- Gauderman WJ, Vora H, McConnell R, Berhane K, Gilliland F, Thomas D, Lurmann F, Avol E, Kunzli N, Jerrett M, Peters J. Effect of exposure to traffic on lung development from 10 to 18 years of age: a cohort study. The Lancet. 2007;369:571–577. doi: 10.1016/S0140-6736(07)60037-3. [DOI] [PubMed] [Google Scholar]
- Geller MD, Ntziachristos L, Mamakos A, Samaras Z, Schmitz DA, Froines JR, Sioutas C. Physicochemical and redox characteristics of particulate matter (PM) emitted from gasoline and diesel passenger cars. Atmos Environ. 2006;40:6988–7004. doi: 10.1016/j.atmosenv.2006.06.018. [DOI] [Google Scholar]
- Grosjean D, Fung K, Harrison J. Interactions of polycyclic aromatic hydrocarbons with atmospheric pollutants. Environ Sci Technol. 1983;17:673–679. doi: 10.1021/es00117a010. [DOI] [PubMed] [Google Scholar]
- Hasheminassab S, Daher N, Ostro BD, Sioutas C. Long-term source apportionment of ambient fine particulate matter (PM2.5) in the Los Angeles Basin: A focus on emissions reduction from vehicular sources. Environ Pollut. 2014a;193:54–64. doi: 10.1016/j.envpol.2014.06.012. [DOI] [PubMed] [Google Scholar]
- Hasheminassab S, Pakbin P, Delfino RJ, Schauer JJ, Sioutas C. Diurnal and seasonal trends in the apparent density of ambient fine and coarse particles in Los Angeles. Environ Pollut. 2014b;187:1–9. doi: 10.1016/j.envpol.2013.12.015. [DOI] [PMC free article] [PubMed] [Google Scholar]
- Hasheminassab S, Daher N, Schauer JJ, Sioutas C. Source apportionment and organic compound characterization of ambient ultrafine particulate matter (PM) in the Los Angeles Basin. Atmos Environ. 2013;79:529–539. doi: 10.1016/j.atmosenv.2013.07.040. [DOI] [Google Scholar]
- Hayes PL, Ortega AM, Cubison MJ, Froyd KD, Zhao Y, Cliff SS, Hu WW, Toohey DW, Flynn JH, Lefer BL, Grossberg N, Alvarez S, Rappenglück B, Taylor JW, Allan JD, Holloway JS, Gilman JB, Kuster WC, de Gouw JA, Massoli P, Zhang X, Liu J, Weber RJ, Corrigan AL, Russell LM, Isaacman G, Worton DR, Kreisberg NM, Goldstein AH, Thalman R, Waxman EM, Volkamer R, Lin YH, Surratt JD, Kleindienst TE, Offenberg JH, Dusanter S, Griffith S, Stevens PS, Brioude J, Angevine WM, Jimenez JL. Organic aerosol composition and sources in Pasadena, California, during the 2010 CalNex campaign. J Geophys Res Atmospheres. 2013;118:9233–9257. doi: 10.1002/jgrd.50530. [DOI] [Google Scholar]
- Heo J, Dulger M, Olson MR, McGinnis JE, Shelton BR, Matsunaga A, Sioutas C, Schauer JJ. Source apportionments of PM2.5 organic carbon using molecular marker Positive Matrix Factorization and comparison of results from different receptor models. Atmos Environ. 2013;73:51–61. doi: 10.1016/j.atmosenv.2013.03.004. [DOI] [Google Scholar]
- Hu J, Zhang H, Chen S, Ying Q, Wiedinmyer C, Vandenberghe F, Kleeman MJ. Identifying PM2.5 and PM0.1 Sources for Epidemiological Studies in California. Environ Sci Technol. 2014;48:4980–4990. doi: 10.1021/es404810z. [DOI] [PubMed] [Google Scholar]
- Hu S, Polidori A, Arhami M, Shafer MM, Schauer JJ, Cho A, Sioutas C. Redox activity and chemical speciation of size fractioned PM in the communities of the Los Angeles-Long Beach harbor. Atmos Chem Phys. 2008;8:6439–6451. doi: 10.5194/acp-8-6439-2008. [DOI] [Google Scholar]
- Janssen NAH, Hoek G, Simic-Lawson M, Fischer P, van Bree L, Brink Hten, Keuken M, Atkinson RW, Anderson HR, Brunekreef B, Cassee FR. Black Carbon as an Additional Indicator of the Adverse Health Effects of Airborne Particles Compared with PM10 and PM2.5. Environ Health Perspect. 2011;119:1691–1699. doi: 10.1289/ehp.1003369. [DOI] [PMC free article] [PubMed] [Google Scholar]
- Kam W, Liacos JW, Schauer JJ, Delfino RJ, Sioutas C. Size-segregated composition of particulate matter (PM) in major roadways and surface streets. Atmos Environ. 2012;55:90–97. doi: 10.1016/j.atmosenv.2012.03.028. [DOI] [Google Scholar]
- Kam W, Ning Z, Shafer MM, Schauer JJ, Sioutas C. Chemical Characterization and Redox Potential of Coarse and Fine Particulate Matter (PM) in Underground and Ground-Level Rail Systems of the Los Angeles Metro. Environ Sci Technol. 2011;45:6769–6776. doi: 10.1021/es201195e. [DOI] [PubMed] [Google Scholar]
- Kim S, Shen S, Sioutas C, Zhu Y, Hinds WC. Size Distribution and Diurnal and Seasonal Trends of Ultrafine Particles in Source and Receptor Sites of the Los Angeles Basin. J Air Waste Manag Assoc. 2002;52:297–307. doi: 10.1080/10473289.2002.10470781. [DOI] [PubMed] [Google Scholar]
- Kleeman MJ, Cass GR. A 3D Eulerian Source-Oriented Model for an Externally Mixed Aerosol. Environ Sci Technol. 2001;35:4834–4848. doi: 10.1021/es010886m. [DOI] [PubMed] [Google Scholar]
- Kozawa KH, Park SS, Mara SL, Herner JD. Verifying Emission Reductions from Heavy-Duty Diesel Trucks Operating on Southern California Freeways. Environ Sci Technol. 2014;48:1475–1483. doi: 10.1021/es4044177. [DOI] [PubMed] [Google Scholar]
- Kuwayama T, Schwartz JR, Harley RA, Kleeman MJ. Particulate Matter Emissions Reductions due to Adoption of Clean Diesel Technology at a Major Shipping Port. Aerosol Sci Technol. 2013;47:29–36. doi: 10.1080/02786826.2012.720049. [DOI] [Google Scholar]
- Li N, Sioutas C, Cho A, Schmitz D, Misra C, Sempf J, Wang M, Oberley T, Froines J, Nel A. Ultrafine particulate pollutants induce oxidative stress and mitochondrial damage. Environ Health Perspect. 2003;111:455–460. doi: 10.1289/ehp.6000. [DOI] [PMC free article] [PubMed] [Google Scholar]
- Li R, Navab K, Hough G, Daher N, Zhang M, Mittelstein D, Lee K, Pakbin P, Saffari A, Bhetraratana M, Sulaiman D, Beebe T, Wu L, Jen N, Wine E, Tseng CH, Araujo JA, Fogelman A, Sioutas C, Navab M, Hsiai TK. Effect of Exposure to Atmospheric Ultrafine Particles on Production of Free Fatty Acids and Lipid Metabolites in the Mouse Small Intestine. Environ Health Perspect. 2015;123:34–41. doi: 10.1289/ehp.1307036. [DOI] [PMC free article] [PubMed] [Google Scholar]
- Lough GC, Christensen CG, Schauer JJ, Tortorelli J, Mani E, Lawson DR, Clark NN, Gabele PA. Development of Molecular Marker Source Profiles for Emissions from On-Road Gasoline and Diesel Vehicle Fleets. J Air Waste Manag Assoc. 2007;57:1190–1199. doi: 10.3155/1047-3289.57.10.1190. [DOI] [PubMed] [Google Scholar]
- Lurmann F, Avol E, Gilliland F. Emissions reduction policies and recent trends in Southern California's ambient air quality. J Air Waste Manag Assoc. 2015;65:324–335. doi: 10.1080/10962247.2014.991856. [DOI] [PMC free article] [PubMed] [Google Scholar]
- Manchester-Neesvig JB, Schauer JJ, Cass GR. The Distribution of Particle-Phase Organic Compounds in the Atmosphere and Their Use for Source Apportionment during the Southern California Children's Health Study. J Air Waste Manag Assoc. 2003;53:1065–1079. doi: 10.1080/10473289.2003.10466265. [DOI] [PubMed] [Google Scholar]
- Marple VA, Rubow KL, Behm SM. A Microorifice Uniform Deposit Impactor (MOUDI): Description, Calibration, and Use. Aerosol Sci Technol. 1991;14:434–446. doi: 10.1080/02786829108959504. [DOI] [Google Scholar]
- May AA, Saleh R, Hennigan CJ, Donahue NM, Robinson AL. Volatility of Organic Molecular Markers Used for Source Apportionment Analysis: Measurements and Implications for Atmospheric Lifetime. Environ Sci Technol. 2012;46:12435–12444. doi: 10.1021/es302276t. [DOI] [PubMed] [Google Scholar]
- McDonald BC, Goldstein AH, Harley RA. Long-Term Trends in California Mobile Source Emissions and Ambient Concentrations of Black Carbon and Organic Aerosol. Environ Sci Technol. 2015 doi: 10.1021/es505912b. [DOI] [PubMed] [Google Scholar]
- McDonald JD, Eide I, Seagrave J, Zielinska B, Whitney K, Lawson DR, Mauderly JL. Relationship between Composition and Toxicity of Motor Vehicle Emission Samples. Environ Health Perspect. 2004;112:1527–1538. doi: 10.1289/ehp.6976. [DOI] [PMC free article] [PubMed] [Google Scholar]
- Miguel AH, Kirchstetter TW, Harley RA, Hering SV. On-Road Emissions of Particulate Polycyclic Aromatic Hydrocarbons and Black Carbon from Gasoline and Diesel Vehicles. Environ Sci Technol. 1998;32:450–455. doi: 10.1021/es970566w. [DOI] [Google Scholar]
- Minguillón MC, Arhami M, Schauer JJ, Sioutas C. Seasonal and spatial variations of sources of fine and quasi-ultrafine particulate matter in neighborhoods near the Los Angeles–Long Beach harbor. Atmos Environ. 2008;42:7317–7328. doi: 10.1016/j.atmosenv.2008.07.036. [DOI] [Google Scholar]
- Moller P, Danielsen PH, Karottki DG, Jantzen K, Roursgaard M, Klingberg H, Jensen DM, Christophersen DV, Hemmingsen JG, Cao Y, Loft S. Oxidative stress and inflammation generated DNA damage by exposure to air pollution particles. Mutat Res-Rev Mutat Res. 2014;762:133–166. doi: 10.1016/j.mrrev.2014.09.001. [DOI] [PubMed] [Google Scholar]
- Morgan TE, Davis DA, Iwata N, Tanner JA, Snyder D, Ning Z, Kam W, Hsu YT, Winkler JW, Chen JC, Petasis NA, Baudry M, Sioutas C, Finch CE. Glutamatergic Neurons in Rodent Models Respond to Nanoscale Particulate Urban Air Pollutants in Vivo and in Vitro. Environ Health Perspect. 2011;119:1003–1009. doi: 10.1289/ehp.1002973. [DOI] [PMC free article] [PubMed] [Google Scholar]
- Ning Z, Geller MD, Moore KF, Sheesley R, Schauer JJ, Sioutas C. Daily Variation in Chemical Characteristics of Urban Ultrafine Aerosols and Inference of Their Sources. Environ Sci Technol. 2007;41:6000–6006. doi: 10.1021/es070653g. [DOI] [PubMed] [Google Scholar]
- Oliveira C, Pio C, Alves C, Evtyugina M, Santos P, Gonçalves V, Nunes T, Silvestre AJD, Palmgren F, Wåhlin P, Harrad S. Seasonal distribution of polar organic compounds in the urban atmosphere of two large cities from the North and South of Europe. Atmos Environ. 2007;41:5555–5570. doi: 10.1016/j.atmosenv.2007.03.001. [DOI] [Google Scholar]
- Ostro B, Tobias A, Querol X, Alastuey A, Amato F, Pey J, Perez N, Sunyer J. The Effects of Particulate Matter Sources on Daily Mortality: A Case-Crossover Study of Barcelona, Spain. Environ Health Perspect. 2011;119:1781–1787. doi: 10.1289/ehp.1103618. [DOI] [PMC free article] [PubMed] [Google Scholar]
- Pant P, Yin J, Harrison RM. Sensitivity of a Chemical Mass Balance model to different molecular marker traffic source profiles. Atmos Environ. 2014;82:238–249. doi: 10.1016/j.atmosenv.2013.10.005. [DOI] [Google Scholar]
- Polidori A, Hu S, Biswas S, Delfino RJ, Sioutas C. Real-time characterization of particle-bound polycyclic aromatic hydrocarbons in ambient aerosols and from motor-vehicle exhaust. Atmos Chem Phys. 2008;8:1277–1291. doi: 10.5194/acp-8-1277-2008. [DOI] [Google Scholar]
- Pope CA, Dockery DW. Health Effects of Fine Particulate Air Pollution: Lines that Connect. J Air Waste Manag Assoc. 2006;56:709–742. doi: 10.1080/10473289.2006.10464485. [DOI] [PubMed] [Google Scholar]
- Posner LN, Pandis SN. Sources of ultrafine particles in the Eastern United States. Atmos Environ. doi: 10.1016/j.atmosenv.2015.03.033. n.d. [DOI] [Google Scholar]
- Pratsinis S, Ellis EC, Novakov T, Friedlander SK. The Carbon Containing Component of the Los Angeles Aerosol: Source Apportionment and Contributions to the Visibility Budget. J Air Pollut Control Assoc. 1984;34:643–650. doi: 10.1080/00022470.1984.10465792. [DOI] [Google Scholar]
- Rich DQ, Özkaynak H, Crooks J, Baxter L, Burke J, Ohman-Strickland P, Thevenet-Morrison K, Kipen HM, Zhang J, Kostis JB, Lunden M, Hodas N, Turpin BJ. The Triggering of Myocardial Infarction by Fine Particles Is Enhanced When Particles Are Enriched in Secondary Species. Environ Sci Technol. 2013;47:9414–9423. doi: 10.1021/es4027248. [DOI] [PMC free article] [PubMed] [Google Scholar]
- Rogge WF, Hildemann LM, Mazurek MA, Cass GR, Simoneit BRT. Sources of Fine Organic Aerosol. 8. Boilers Burning No 2 Distillate Fuel Oil. Environ Sci Technol. 1997;31:2731–2737. doi: 10.1021/es9609563. [DOI] [PubMed] [Google Scholar]
- Rogge WF, Hildemann LM, Mazurek MA, Cass GR, Simoneit BRT. Sources of fine organic aerosol. 5. Natural gas home appliances. Environ Sci Technol. 1993;27:2736–2744. doi: 10.1021/es00049a012. [DOI] [PubMed] [Google Scholar]
- Rogge WF, Hildemann LM, Mazurek MA, Cass GR, Simoneit BRT. Sources of fine organic aerosol. 1. Charbroilers and meat cooking operations. Environ Sci Technol. 1991;25:1112–1125. doi: 10.1021/es00018a015. [DOI] [PubMed] [Google Scholar]
- Ruehl CR, Ham WA, Kleeman MJ. Temperature-induced volatility of molecular markers in ambient airborne particulate matter. Atmos Chem Phys. 2011;11:67–76. doi: 10.5194/acp-11-67-2011. [DOI] [Google Scholar]
- Sardar SB, Fine PM, Mayo PR, Sioutas C. Size-Fractionated Measurements of Ambient Ultrafine Particle Chemical Composition in Los Angeles Using the NanoMOUDI. Environ Sci Technol. 2005;39:932–944. doi: 10.1021/es049478j. [DOI] [PubMed] [Google Scholar]
- Schauer JJ. Evaluation of elemental carbon as a marker for diesel particulate matter. J Expo Sci Environ Epidemiol. 2003;13:443–453. doi: 10.1038/sj.jea.7500298. [DOI] [PubMed] [Google Scholar]
- Schauer JJ, Cass GR. Source Apportionment of Wintertime Gas-Phase and Particle-Phase Air Pollutants Using Organic Compounds as Tracers. Environ Sci Technol. 2000;34:1821–1832. doi: 10.1021/es981312t. [DOI] [Google Scholar]
- Schauer JJ, Kleeman MJ, Cass GR, Simoneit BRT. Measurement of Emissions from Air Pollution Sources. 5. C1–C32 Organic Compounds from Gasoline-Powered Motor Vehicles. Environ Sci Technol. 2002;36:1169–1180. doi: 10.1021/es0108077. [DOI] [PubMed] [Google Scholar]
- Schauer JJ, Rogge WF, Hildemann LM, Mazurek MA, Cass GR, Simoneit BRT. Source apportionment of airborne particulate matter using organic compounds as tracers. Atmos Environ. 1996;30:3837–3855. doi: 10.1016/1352-2310(96)00085-4. [DOI] [Google Scholar]
- Sheesley RJ, Schauer JJ, Zheng M, Wang B. Sensitivity of molecular marker-based CMB models to biomass burning source profiles. Atmos Environ. 2007;41:9050–9063. doi: 10.1016/j.atmosenv.2007.08.011. [DOI] [Google Scholar]
- Shi JP, Khan AA, Harrison RM. Measurements of ultrafine particle concentration and size distribution in the urban atmosphere. Sci Total Environ. 1999;235:51–64. doi: 10.1016/S0048-9697(99)00189-8. [DOI] [Google Scholar]
- Simoneit BRT. A review of biomarker compounds as source indicators and tracers for air pollution. Environ Sci Pollut Res. 1999;6:159–169. doi: 10.1007/BF02987621. [DOI] [PubMed] [Google Scholar]
- Simoneit BRT. Characterization of Organic Constituents in Aerosols in Relation to Their rigin and Transport: A Review. Int J Environ Anal Chem. 1986;23:207–237. doi: 10.1080/03067318608076446. [DOI] [Google Scholar]
- Sioutas C, Delfino RJ, Singh M. Exposure Assessment for Atmospheric Ultrafine Particles (UFPs) and Implications in Epidemiologic Research. Environ Health Perspect. 2005;113:947–955. doi: 10.1289/ehp.7939. [DOI] [PMC free article] [PubMed] [Google Scholar]
- Sorooshian A, Ng NL, Chan AWH, Feingold G, Flagan RC, Seinfeld JH. Particulate organic acids and overall water-soluble aerosol composition measurements from the 2006 Gulf of Mexico Atmospheric Composition and Climate Study (GoMACCS): ORGANIC ACID AEROSOL DURING GOMACCS 2006. J Geophys Res Atmospheres. 2007;112:n/a–n/a. doi: 10.1029/2007JD008537. [DOI] [Google Scholar]
- Stone EA, Snyder DC, Sheesley RJ, Sullivan AP, Weber RJ, Schauer JJ. Source apportionment of fine organic aerosol in Mexico City during the MILAGRO experiment 2006. Atmos Chem Phys. 2008;8:1249–1259. doi: 10.5194/acp-8-1249-2008. [DOI] [Google Scholar]
- Subramanian R, Donahue NM, Bernardo-Bricker A, Rogge WF, Robinson AL. Contribution of motor vehicle emissions to organic carbon and fine particle mass in Pittsburgh, Pennsylvania: Effects of varying source profiles and seasonal trends in ambient marker concentrations. Atmos Environ. 2006;40:8002–8019. doi: 10.1016/j.atmosenv.2006.06.055. [DOI] [Google Scholar]
- Thorpe A, Harrison RM. Sources and properties of non-exhaust particulate matter from road traffic: A review. Sci Total Environ. 2008;400:270–282. doi: 10.1016/j.scitotenv.2008.06.007. [DOI] [PubMed] [Google Scholar]
- Urch B, Brook JR, Wasserstein D, Brook RD, Rajagopalan S, Corey P, Silverman F. Relative Contributions of PM2.5 Chemical Constituents to Acute Arterial Vasoconstriction in Humans. Inhal Toxicol. 2004;16:345–352. doi: 10.1080/08958370490439489. [DOI] [PubMed] [Google Scholar]
- Verma V, Ning Z, Cho AK, Schauer JJ, Shafer MM, Sioutas C. Redox activity of urban quasi-ultrafine particles from primary and secondary sources. Atmos Environ. 2009;43:6360–6368. doi: 10.1016/j.atmosenv.2009.09.019. [DOI] [Google Scholar]
- Verma V, Pakbin P, Cheung KL, Cho AK, Schauer JJ, Shafer MM, Kleinman MT, Sioutas C. Physicochemical and Toxicological Characteristics of Semi-volatile Components of Atmospheric Aerosols in an Urban Environment. AGU Fall Meet. 2010 Abstr. -1, 01. [Google Scholar]
- Wang G, Kawamura K, Cheng C, Li J, Cao J, Zhang R, Zhang T, Liu S, Zhao Z. Molecular Distribution and Stable Carbon Isotopic Composition of Dicarboxylic Acids, Ketocarboxylic Acids, and α-Dicarbonyls in Size-Resolved Atmospheric Particles From Xi'an City, China. Environ Sci Technol. 2012;46:4783–4791. doi: 10.1021/es204322c. [DOI] [PubMed] [Google Scholar]
- Watson JG, Cooper JA, Huntzicker JJ. The effective variance weighting for least squares calculations applied to the mass balance receptor model. Atmospheric Environ 1967. 1984;18:1347–1355. doi: 10.1016/0004-6981(84)90043-X. [DOI] [Google Scholar]
- Westerdahl D, Fruin S, Sax T, Fine PM, Sioutas C. Mobile platform measurements of ultrafine particles and associated pollutant concentrations on freeways and residential streets in Los Angeles. Atmos Environ. 2005;39:3597–3610. doi: 10.1016/j.atmosenv.2005.02.034. [DOI] [Google Scholar]
- Williams BJ, Goldstein AH, Kreisberg NM, Hering SV, Worsnop DR, Ulbrich IM, Docherty KS, Jimenez JL. Major components of atmospheric organic aerosol in southern California as determined by hourly measurements of source marker compounds. Atmos Chem Phys. 2010;10:11577–11603. doi: 10.5194/acp-10-11577-2010. [DOI] [Google Scholar]
- Wu W, Muller R, Berhane K, Fruin S, Liu F, Jaspers I, Diaz-Sanchez D, Peden DB, McConnell R. Inflammatory Response of Monocytes to Ambient Particles Varies by Highway Proximity. Am J Respir Cell Mol Biol. 2014;51:802–809. doi: 10.1165/rcmb.2013-0265OC. [DOI] [PMC free article] [PubMed] [Google Scholar]
- Zhang X, Lin YH, Surratt JD, Weber RJ. Sources, Composition and Absorption Ångström Exponent of Light-absorbing Organic Components in Aerosol Extracts from the Los Angeles Basin. Environ Sci Technol. 2013;47:3685–3693. doi: 10.1021/es305047b. [DOI] [PubMed] [Google Scholar]
- Zheng M, Cass GR, Schauer JJ, Edgerton ES. Source Apportionment of PM2.5 in the Southeastern United States Using Solvent-Extractable Organic Compounds as Tracers. Environ Sci Technol. 2002;36:2361–2371. doi: 10.1021/es011275x. [DOI] [PubMed] [Google Scholar]
- Zhou S, Shiraiwa M, McWhinney RD, Pöschl U, Abbatt JPD. Kinetic limitations in gas-particle reactions arising from slow diffusion in secondary organic aerosol. Faraday Discuss. 2013;165:391–406. doi: 10.1039/C3FD00030C. [DOI] [PubMed] [Google Scholar]
Associated Data
This section collects any data citations, data availability statements, or supplementary materials included in this article.