

Abstract
An important determinant of the pathogenesis and prognosis of various diseases is inherited genetic variation. Single-nucleotide polymorphisms (SNPs), variations at a single base position, have been identified in both protein-coding and noncoding DNA sequences, but the vast majority of millions of those variants are far from being functionally understood. Here we show that a common variant in the gene MTHFR [rs1801133 (C>T)] not only influences response to neoadjuvant chemoradiotherapy in patients with rectal cancer, but it also influences recurrence of the disease itself. More specifically, patients with the homozygous ancestral (wild type) genotype (C/C) were 2.91 times more likely (291% increased benefit) to respond to neoadjuvant chemoradiotherapy {95% CI: [1.23, 6.89]; P=0.0150} and 3.25 times more likely (325% increased benefit) not to experience recurrence of the disease {95% CI: [1.37, 7.72]; P=0.0079} than patients with either the heterozygous (C/T) or the homozygous mutation (T/T) genotype. These results identify MTHFR as an important genetic marker and open up new, pharmacogenomic strategies in the treatment and management of rectal cancer.
Keywords: Rectal cancer, MTHFR single nucleotide polymorphism, genetic variation, recurrence of rectal cancer, response to chemoradiotherapy, personalized medicine
Introduction
Each year, approximately 40,000 women and men are diagnosed with rectal cancer in the U.S. [1]. During the last two decades, the management of rectal cancer has experienced several revolutionary innovations including the seminal description of total mesorectal excision [2], and the adoption of neoadjuvant chemoradiotherapy (CRT) for locally advanced cases [3,4]. Neoadjuvant CRT has emerged as an important treatment modality for downsizing tumors, reducing rates of local recurrence, and improving sphincter preservation rates in patients. Furthermore, 15%-30% of all rectal cancer patients respond to neoadjuvant CRT and experience pathological complete recovery [5]. Having the ability to identify in advance, i.e. at the time of the diagnosis, those patients who will respond to neoadjuvant CRT, as well as those who will not do so, will undoubtedly have a significant impact in the treatment and management of this disease. Today, empowered by the enormous advances in biotechnology, particularly in the areas of genomics and genetics, researchers are seeking to ascertain whether inherited genetic variations play a role in -- and whether they could be utilized as markers of -- response to a particular treatment, progression, and/or recurrence of various diseases.
In this project, we conducted two studies wherein we sought to investigate the role of the common variant rs1801133 in the MTHFR (methylenetetrahydrofolate reductase) gene in 1) pathological complete response to neoadjuvant CRT (5-fluorouracil-based chemotherapy and radiation) and 2) in recurrence of rectal cancer. In connection with the first study, 108 subjects [36 responders (RS) and 72 non-responders (NRS)] were employed. The tumor regression grading (TRG) recommended by the College of American Pathologists [6] was used to assess pathological complete response. Demographical, clinical, as well as genotyping, information about all subjects used in the first study is listed in Supplementary Table 1. In connection with the second study, 108 subjects [36 with no recurrence (NRC) and 72 with recurrence (RC)] were employed. Supplementary Table 2 contains demographical, clinical, as well as genotyping, information about all subjects used in the second study. All subjects for both studies were recruited at the Mayo Clinic, Rochester, MN, USA. Genomic DNA was isolated from peripheral blood and was processed and analyzed for single nucleotide polymorphisms (SNPs) according to the method and protocols that we have presented in a previous study [7]. Briefly, having employed high-resolution melting for screening and scanning for single-nucleotide polymorphisms (SNPs) -- a method that offers high accuracy in the differentiation among homozygous ancestral (wild type), heterozygous, and homozygous for the mutation genotypes not only in the case of transitions, such as the C>T (rs1801133) in the MTHFR gene in this study (Supplementary Figure 1), but also in the case of transversions and other cases of unique genotype outcomes [7] -- we were able to obtain accurately the MTHFR rs1801133 genotype for all subjects used for both studies. All statistical analyses employed in both studies were based on a bioinformatic methodology that we have developed and presented previously [8-17]. All clinical, genotyping, and statistical methods appear in the Methods section.
Methods
Clinical
Patients used in both studies were recruited at the Mayo Clinic, Rochester, MN, USA, and written informed consent was obtained from all patients. Obtainment and processing of all patient biosamples were carried out in accordance with the IRB protocols of the Mayo Clinic. In connection with the response-to-CRT study, the tumor regression grading (TRG) recommended by the College of American Pathologists [6] was used for the selection of patients. Subjects with a score of TRG=0 (pathological complete recovery) and with no evidence of the disease following surgery (post-surgery TNM scores were 0) were classified as responders (RS), whereas subjects with a score of TRG=3 (poor or no response) were classified as non-responders (NRS). Subjects with missing and/or conflicting clinical information were excluded from the study. The CRT protocol consisted of the traditional long course of 5040 cGy radiation over a period of five weeks with infusion of 5-FU. For all subjects, surgery followed at a minimum of six weeks after the conclusion of CRT. In connection with the recurrence-of-rectal-cancer study, documented clinical evidence of recurrence of the disease was used for the selection of the patients. Subjects with no evidence of the disease following surgery (post-surgery TNM scores were 0) and with no recurrence of the disease within four years following surgery were classified as NRC; whereas subjects with recurrence of the disease within four years following surgery were classified as RC. Subjects with missing and/or conflicting clinical information were excluded from the study. Recurrence comprised both local and metastatic recurrence.
Genotyping
Genomic DNA was isolated from peripheral blood and was processed and analyzed for single nucleotide polymorphisms (SNPs) according to the method and protocols presented in a previous study [7]. Briefly, high-resolution melting was used for screening and scanning for single-nucleotide polymorphisms (SNPs). Strand locking dye, rapid thermal cycling equipment, synthetic target template controls, and primer selection optimization allowed the transparent detection of the heterozygous samples and differentiated the major allele and the minor allele homozygous states in a rapid, template resilient assay. To avoid interference by primer dimers, single-stranded nucleic acid entities, and template contamination, observations were based on the melting behavior of double-stranded amplicon products of about 100 base pairs. Differentiation of heterozygous from homozygous samples was based on melting peak shape, whereas differentiation between homozygous samples was based on melting peak temperature (Supplementary Figure 1). A synthetic control sequence for the ancestral/major and the minor allele was incorporated as a control and for primer evaluation. Modified primer selection was based on the evaluation and determination of candidate primer pairs for the greatest temperature difference between the two homozygous states using a synthetic target for each sequence. The temperature difference between the homozygous states was enhanced by spiking the samples. All personnel that performed the genotyping tests were blinded to all data and were provided with only an ID number for each blood sample.
Statistical
For all comparisons for both studies, the two-tailed Pearson χ2 test was used. For those comparisons with a 2×2 contingency table, the two-tailed Fisher exact test was also used, and, furthermore, the odds ratio and the 95% confidence interval for the odds ratio value were calculated. The odds ratio and the 95% confidence interval for the odds ratio value were not calculated for those comparisons whereby the results of the Fisher exact test were not statistically significant. For all tests, the significance level was set at α=0.05 (two-tailed). The logistic regression analysis was performed with a Y-intercept (β0) and with six independent variables (MTHFR SNP, age, sex, BMI, smoking Hx, and tumor grade), as they appear in Supplementary Table 1. The dependent variable was binary (RS=0 and NRS=1) and the independent variables were inputted as follows: MTHFR SNP: (A=0 and H=M=1); age as a numerical variable; sex: (M=0 and F=1); BMI as a numerical variable; smoking Hx: (N=0, F=1, and C=2); and tumor grade: (grade 1=1, grade 2=2, grade 3=3, grade 4=4). The significance level was set at α=0.05 (two-tailed). The Cox proportional hazards regression analysis was performed with only the MTHFR SNP variable as the independent variable in the case of Model A and in the case of Model B, with six independent variables (MTHFR SNP, age, sex, BMI, smoking Hx, and tumor grade), as they appear in Supplementary Table 2. The independent variables were inputted as follows: MTHFR SNP: (A=0 and H=M=1) for both Model A and Model B; age as a numerical variable; sex: (M=0 and F=1); BMI as a numerical variable; smoking Hx: (N=0, F=1, and C=2); and tumor grade: (grade 1=1, grade 2=2, grade 3=3, grade 4=4). The recurrence time (Supplementary Table 2) was used as the time-to-event variable. Regarding censoring, “1” was used for subjects that did not experience recurrence of the disease within four years post-surgery, and “0” was used for subjects that experienced recurrence of the disease within four years post-surgery. The significance level was set at α=0.05 (two-tailed). Regarding power analysis, we performed a χ2 test power analysis in order to determine an approximate sample size for both studies. Using two degrees of freedom for each study, since each study design employed a 3×2 contingency table [three genotypes (A, H, M) vs. two groupings (RS vs. NRS for the response study) or (NRC vs. RC for the recurrence study)]; a medium effect size (w=0.3); a minimum power of 0.80; a significance level of α=0.05 (two-tailed); we calculated that the estimated total sample size for each study was N=108 subjects (χ2=9.7200). All analyses in this study were carried out with custom software written by J.B.N. in MATLAB R2014b.
Results
Response to CRT study
In connection with the first study, i.e. response to CRT, out of 108 subjects used, 55.6% (60/108) had the homozygous ancestral genotype (C/C), 33.3% (36/108) had the heterozygous genotype (C/T), and 11.1% (12/108) had the homozygous for the mutation genotype (T/T) (Table 1A). Of the 108 subjects, 36 were responders (RS) to CRT (experienced pathological complete recovery) and 72 were non-responders (NRS). Having examined all three genotypes separately and concurrently, we found a statistically significant association between the three genotypes and response to CRT [Pearson χ2=7.20 (P=0.0273)] (Table 2A and Figure 1A). When we examined those subjects that were homozygous for the ancestral genotype (C/C) against subjects with the other two genotypes together (C/T & T/T), we found an even stronger statistically significant association between those two genotype groups and response to CRT [Pearson χ2=6.08 (P=0.0137)] (Table 2A and Figure 1B). A Fisher exact test confirmed the aforementioned statistically significant association (P=0.0150) and revealed that the subjects with the homozygous for the ancestral genotype (C/C) were 2.91 times {odds ratio with a 95% CI of [1.2251, 6.8925]} more likely to respond to CRT than the subjects with either the heterozygous (C/T) or the homozygous for the mutation (T/T) genotype (Table 2A). Finally, having combined the homozygous for the ancestral genotype and the heterozygous into one group (C/C & C/T) and compared them against the homozygous for the mutation (T/T), we found no statistically significant association between those two genotype groups and response to CRT [Pearson χ2=3.8 (P=0.0513)]. A Fisher exact test confirmed the aforementioned statistically not significant association (P=0.0580) (Table 2A). Those analyses and their respective results indicate that only the homozygous ancestral genotype (C/C) in the MTHFR gene confers a significant benefit (291% increased benefit) in connection with response to CRT as compared with the other two genotypes (C/T or T/T). In order to ascertain whether covariates, such as age, sex, BMI (body mass index), smoking history, and tumor grade, had any significant effect, we performed a logistic regression analysis (Supplementary Table 3). The analysis corroborated the statistical significance of the MTHFR SNP (single nucleotide polymorphism) variable when it was considered together with the aforementioned covariates. Furthermore, the analysis revealed that the covariates sex and tumor grade also had a statistically significant effect. More specifically, patients with either the heterozygous (C/T) or the homozygous for the mutation (T/T) genotype were 0.20 times less likely to respond to CRT than patients with the wild type (C/C) genotype (P=0.00470); female patients were 5.18 times more likely to respond to CRT than male patients (P=0.00373); and patients with either tumor grade 3 or tumor grade 4 were 0.12 times less likely to respond to CRT than patients with tumor grade 2 (P=0.00205). The covariates age, BMI, and smoking history had no statistically significant effect (Supplementary Table 3).
Table 1.
Contingency and all frequency Tables for both studies: (A) response to chemoradiotherapy (CRT) and (B) recurrence of rectal cancer
| A. Response to CRT | ||||||||||
|
| ||||||||||
| SNIP ID | Genotypes | Genotypes tested | RS | NRS | Totals | Geno-type % | RS row % | NRS row % | RS col % | NRS col % |
|
| ||||||||||
| rs1801133 | A=C/C | A | 26 | 34 | 60 | 55.6 | 43.3 | 56.7 | 72.2 | 47.2 |
| H=C/T | H | 9 | 27 | 36 | 33.3 | 25.0 | 75.0 | 25.0 | 37.5 | |
| M=T/T | M | 1 | 11 | 12 | 11.1 | 8.3 | 91.7 | 2.8 | 15.3 | |
| Totals | 36 | 72 | 108 | 100.0 | 33.3 | 66.7 | 100.0 | 100.0 | ||
| rs1801133 | A=C/C | A | 26 | 34 | 60 | 55.6 | 43.3 | 56.7 | 72.2 | 47.2 |
| H=C/T | H & M | 10 | 38 | 48 | 44.4 | 20.8 | 79.2 | 27.8 | 52.8 | |
| M=T/T | ||||||||||
| Totals | 36 | 72 | 108 | 100.0 | 33.3 | 66.7 | 100.0 | 100.0 | ||
| rs1801133 | A=C/C | A & H | 35 | 61 | 96 | 88.9 | 36.5 | 63.5 | 97.2 | 84.7 |
| H=C/T | M | 1 | 11 | 12 | 11.1 | 8.3 | 91.7 | 2.8 | 15.3 | |
| M=T/T | ||||||||||
| Totals | 36 | 72 | 108 | 100.0 | 33.3 | 66.7 | 100.0 | 100.0 | ||
|
| ||||||||||
| B. Recurrence of Rectal Cancer | ||||||||||
|
| ||||||||||
| SNIP ID | Genotypes | Genotypes tested | NRC | RC | Totals | Geno-type % | NRC row % | RC row % | NRC col % | RC col % |
|
| ||||||||||
| rs1801133 | A=C/C | A | 26 | 32 | 58 | 53.7 | 44.8 | 55.2 | 72.2 | 44.4 |
| H=C/T | H | 9 | 31 | 40 | 37.0 | 22.5 | 77.5 | 25.0 | 43.1 | |
| M=T/T | M | 1 | 9 | 10 | 9.3 | 10.0 | 90.0 | 2.8 | 12.5 | |
| Totals | 36 | 72 | 108 | 100.0 | 33.3 | 66.7 | 100.0 | 100.0 | ||
| rs1801133 | A=C/C | A | 26 | 32 | 58 | 53.7 | 44.8 | 55.2 | 72.2 | 44.4 |
| H=C/T | H & M | 10 | 40 | 50 | 46.3 | 20.0 | 80.0 | 27.8 | 55.6 | |
| M=T/T | ||||||||||
| Totals | 36 | 72 | 108 | 100.0 | 33.3 | 66.7 | 100.0 | 100.0 | ||
| rs1801133 | A=C/C | A & H | 35 | 63 | 98 | 90.7 | 35.7 | 64.3 | 97.2 | 87.5 |
| H=C/T | M | 1 | 9 | 10 | 9.3 | 10.0 | 90.0 | 2.8 | 12.5 | |
| M=T/T | ||||||||||
| Totals | 36 | 72 | 108 | 100.0 | 33.3 | 66.7 | 100.0 | 100.0 | ||
The SNP ID, the genotypes, the genotypes tested, the number of subjects within each group, the total number of subjects for each genotype, the genotype percentages, the group row percentages, and the group column percentages are listed. (A): homozygous ancestral (wild type). (H): heterozygous. (M): homozygous for the mutation. (RS): responders to CRT. (NRS): non-responders to CRT. (NRC): subjects with no recurrence of rectal cancer. (RC): subjects with recurrence of rectal cancer.
Table 2.
Statistical results of the SNP analysis in connection with both studies: (A) response to chemoradiotherapy (CRT) and (B) recurrence of rectal cancer
| SNP ID | Gene | Geno-types | Genotypes Tested | Test (two-tailed) | χ2 | DF | P | OR | 95% CI | Notes |
|---|---|---|---|---|---|---|---|---|---|---|
| A. Response to CRT | ||||||||||
| rs1801133 | MTHFR | A=C/C | A vs. H vs. M | Pearson χ2 | 7.2000 | 2 | 0.0273 | SS | ||
| H=C/T | Fisher Exact | N/A | N/A | N/A | ||||||
| M=T/T | ||||||||||
| rs1801133 | MTHFR | A=C/C | A vs. H & M | Pearson χ2 | 6.0750 | 1 | 0.0137 | SS | ||
| H=C/T | Fisher Exact | 0.0150 | 2.9059 | [1.2251, 6.8925] | SS | |||||
| M=T/T | ||||||||||
| rs1801133 | MTHFR | A=C/C | A & H vs. M | Pearson χ2 | 3.7969 | 1 | 0.0513 | NSS | ||
| H=C/T | Fisher Exact | 0.0580 | § | § | NSS | |||||
| M=T/T | ||||||||||
| B. Recurrence of Rectal Cancer | ||||||||||
| rs1801133 | MTHFR | A=C/C | A vs. H vs. M | Pearson χ2 | 8.0108 | 2 | 0.0182 | SS | ||
| H=C/T | Fisher Exact | N/A | N/A | N/A | ||||||
| M=T/T | ||||||||||
| rs1801133 | MTHFR | A=C/C | A vs. H & M | Pearson χ2 | 7.4483 | 1 | 0.0064 | SS | ||
| H=C/T | Fisher Exact | 0.0079 | 3.2500 | [1.3686, 7.7177] | SS | |||||
| M=T/T | ||||||||||
| rs1801133 | MTHFR | A=C/C | A & H vs. M | Pearson χ2 | 2.7000 | 1 | 0.1003 | NSS | ||
| H=C/T | Fisher Exact | 0.1598 | § | § | NSS | |||||
| M=T/T | ||||||||||
The SNP number, the gene name, the genotypes, the genotypes tested, the statistical tests employed, the χ2 value, the degrees of freedom (DF), the probability of significance (P), the odds ratio (OR), and the 95% confidence interval for the OR value are shown. The significance level was set at α=0.05 (two-tailed) for all tests. (SS): statistically significant. (NSS): not statistically significant. (§): the OR value and the 95% CI are not calculated if the results of the Fisher exact test are not statistically significant. (N/A): not applicable because the Fisher exact test cannot be performed in that case. All statistical tests performed were two-tailed. (A): homozygous ancestral (wild type). (H): heterozygous. (M): homozygous for the mutation.
Figure 1.
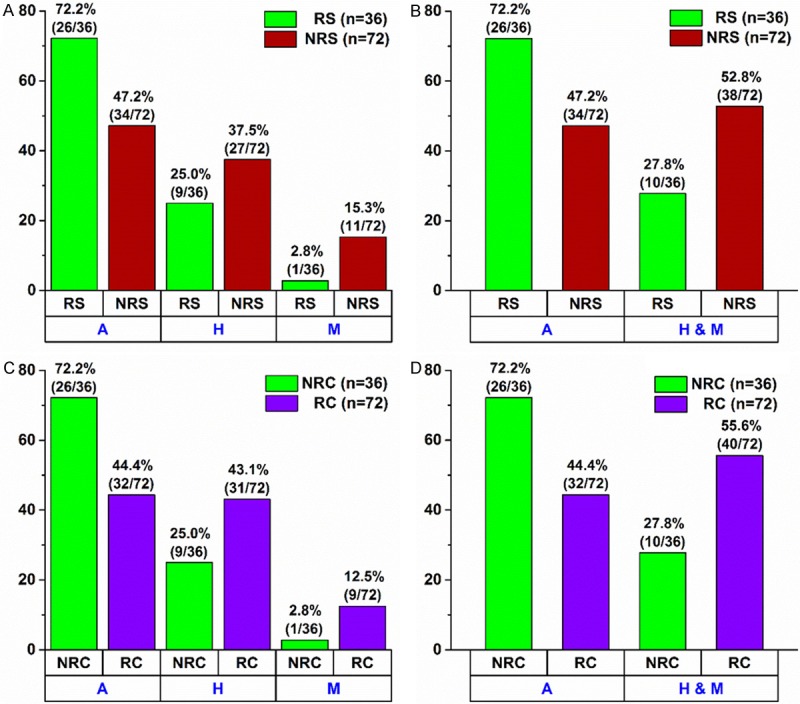
Within Group Percentage Distribution for Both Studies: (A, B) Response to Chemoradiotherapy (CRT) and (C, D) Recurrence of Rectal Cancer. (A) % distribution of responders (RS) (green bars) and non-responders (NRS) (red bars) in the following three genotypes: A (homozygous wild type), H (heterozygous), and M (homozygous mutation). There is a statistically significant association between the three individual genotypes and response to CRT [two-tailed Pearson χ2=7.20 with P=0.0273]. (B) % distribution of responders (RS) (green bars) and non-responders (NRS) (red bars) in the following two genotypes: A (homozygous wild type) and H & M (combined group of heterozygous and homozygous mutation). There is a statistically significant association between the two genotypes and response to CRT [two-tailed Pearson χ2=6.08 with P=0.0137 and two-tailed Fisher exact test with P=0.0150]. (C) % distribution of subjects with no recurrence (NRC) (green bars) and subjects with recurrence (RC) (purple bars) in the following three genotypes: A (homozygous wild type), H (heterozygous), and M (homozygous mutation). There is a statistically significant association between the three individual genotypes and recurrence of rectal cancer [two-tailed Pearson χ2=8.01 with P=0.0182]. (D) % distribution of subjects with no recurrence (NRC) (green bars) and subjects with recurrence (RC) (purple bars) in the following two genotypes: A (homozygous wild type) and H & M (combined group of heterozygous and homozygous mutation). There is a statistically significant association between the two genotypes and recurrence of rectal cancer [two-tailed Pearson χ2=7.45 with P=0.0064 and two-tailed Fisher exact test with P=0.0079].
Recurrence of rectal cancer study
In the second study (recurrence of rectal cancer), out of 108 subjects used, 53.7% (58/108) had the homozygous ancestral genotype (C/C), 37.0% (40/108) had the heterozygous genotype (C/T), and 9.3% (10/108) had the homozygous for the mutation genotype (T/T) (Table 1B). As was mentioned above, out of 108 subjects, 36 experienced no recurrence of rectal cancer (NRC) within four years following surgery and 72 did experience recurrence of the disease (RC) within four years following surgery. In a similar manner as in the first study, having examined all three genotypes separately and concurrently, we found a statistically significant association between the three genotypes and recurrence of rectal cancer [Pearson χ2=8.01 (P=0.0182)] (Table 2B and Figure 1C). Having compared those subjects that were homozygous for the ancestral genotype (C/C) against the subjects with the other two genotypes together (C/T & T/T), we found an even stronger statistically significant association between those two genotype groups and recurrence of rectal cancer [Pearson χ2=7.45 (P=0.0064)] (Table 2B and Figure 1D). A Fisher exact test confirmed that statistically significant association (P=0.0079) and revealed that the subjects with the homozygous for the ancestral genotype (C/C) were 3.25 times {odds ratio with a 95% CI of [1.3686, 7.7177]} more likely not to experience recurrence of rectal cancer than the subjects with either the heterozygous (C/T) or the homozygous for the mutation (T/T) genotype (Table 2B). Finally, when we combined the homozygous for the ancestral genotype and the heterozygous into one group (C/C & C/T) and compared them against the homozygous for the mutation (T/T), we found no statistically significant association between those two genotype groups and recurrence of rectal cancer [Pearson χ2=2.70 (P=0.1003)]. A Fisher exact test confirmed the aforementioned statistically not significant association (P=0.1598) (Table 2B). These results indicate that only the homozygous ancestral genotype (C/C) in the MTHFR gene confers a significant benefit (325% increased benefit) in connection with recurrence of rectal cancer as compared with the other two genotypes (C/T or T/T). In order to assess any significant effect by covariates, such as age, sex, BMI, smoking history, and tumor grade, we performed a Cox proportional hazards regression analysis. The analysis corroborated the statistical significance of the MTHFR SNP variable both in the case where it was the only variable (Model A, P=0.02159) and in the case where it was considered together with all of the aforementioned covariates (Model B, P=0.00454) (Supplementary Table 4 and Supplementary Figure 2). Furthermore, the analysis revealed that two covariates, namely, age and sex also had a statistically significant -- albeit much smaller -- effect. According to the analysis, patients with either the heterozygous (C/T) or the homozygous for the mutation (T/T) genotype were 2.06 times more likely to experience recurrence of rectal cancer than patients with the wild type (C/C) genotype (P=0.00454); older patients were 0.98 times less likely to experience recurrence of the disease than younger patients (P=0.03010); and female patients were 0.55 times less likely to experience recurrence of the disease than male patients (P=0.03464). The covariates BMI, smoking history, and tumor grade had no statistically significant effect (Supplementary Table 4 and Supplementary Figure 2).
Biochemistry and role of MTHFR in DNA methylation and oncogenesis
The enzyme encoded by the MTHFR gene occupies a crucial position in the pathway of metabolism of folate and pterines. More specifically, the MTHFR enzyme catalyzes the conversion of 5,10-methylenetetrahydrofolate to 5-methyltetrahydrofolate, which becomes the methyl donor for the methylation of homocysteine to methionine, catalyzed by the methionine synthase via the required cofactor methylcobalamin (a form of B12 vitamin) (Figure 2). It should be noted here that 5,10-methylenetetrahydrofolate is ultimately derived from folate (folic acid, aka vitamin B9) [folate → 7,8-Dihydrofolate → Tetrahydrofolate → 5, 10-methylenetetrahydrofolate]; that folate cannot be synthesized by mammals and, therefore, must be provided dietarily; and that sufficient amounts of both folate and methylcobalamin are essential to this pathway [18,19]. The methionine thus produced from 5-methyltetrahydrofolate reacts with ATP and is then converted to S-adenosylmethionine (SAM), which is the ultimate methyl donor for numerous cellular methylation reactions, the most notable and important of which is DNA methylation. DNA methylation (methylation of cytosine at the 5’ position in the CpG islands, mostly found in the promoter regions in the human genome) regulates gene expression. It should be noted here that a number of limiting factors in the above described folate → SAM pathway inevitably lead to insufficiency of SAM and, consequently, to aberrant DNA hypomethylation, i.e. dysregulation of DNA methylation (Figure 2). Dysregulation of genomic DNA methylation has been linked to oncogenesis [20,21]. A common C>T transition at nucleotide 14783 (NCBI Reference Sequence: NG_013351.1) of the MTHFR gene, responsible for the substitution of an alanine with a valine codon at position 222 (Ala 222 Val) in the N-terminal catalytic domain, results in a protein with considerably higher thermolability (higher sensitivity to heat inactivation) and substantially lower enzymatic activity [22,23]. Previous studies have linked the substantially lower enzymatic activity of the T/T (homozygous for the mutation) genotype in the MTHFR gene with genomic DNA hypomethylation [23-25]. Furthermore, numerous studies have reported the connection between DNA hypomethylation and various types of cancer [20,26-30]. The results of our study are, therefore, in accord with the aforementioned findings of previous studies and, to the best of our knowledge, provide a novel link between the common variant rs1801133 in MTHFR and recurrence of rectal cancer, as well as response to CRT. Moreover, the results of our study provide novel evidence that both the patients with the heterozygous (C/T) genotype and the patients with the homozygous for the mutation (T/T) genotype are at a significant risk for recurrence of rectal cancer and for no response to CRT as compared with the patients with the homozygous wild type (C/C) genotype. This suggests that any reduction in the enzymatic activity of the MTHFR protein, as compared with the enzymatic activity of the wild type protein, confers a significant risk of poor clinical outcome in connection with this disease.
Figure 2.
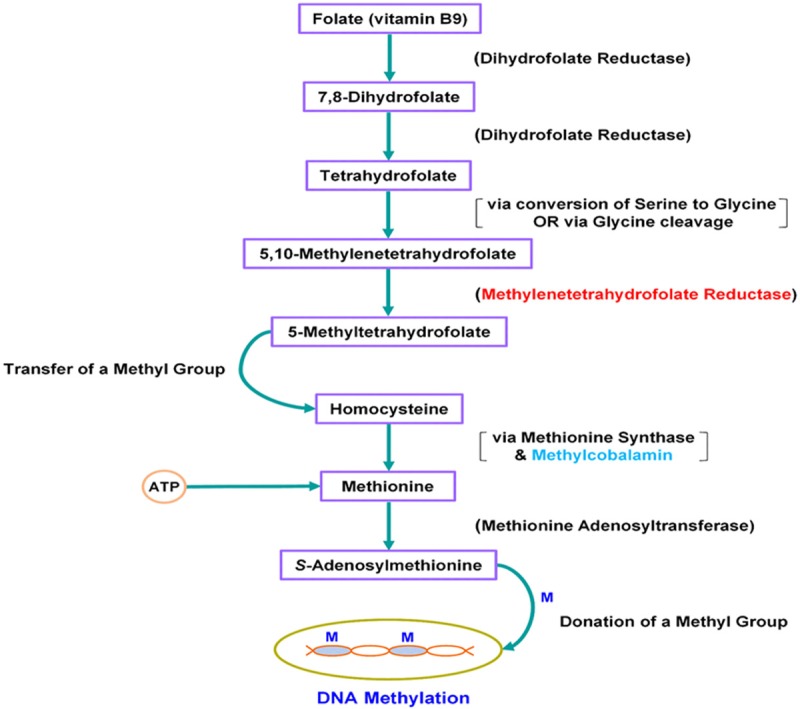
The Pathway of Metabolism of Folate in Connection with DNA Methylation. The MTHFR (methylenetetrahydrofolate reductase) enzyme plays a crucial role in this pathway. A common C>T transition at nucleotide 14783 is responsible for a defective MTHFR enzyme with a substantially lower activity in the case of the homozygous for the mutation (T/T) and the heterozygous (C/T) genotypes. Impaired activity of the MTHFR enzyme ultimately leads to DNA hypomethylation, which leads to oncogenesis. Supplementation of 5-methyltetrahydrofolate, which is directly downstream of the MTHFR enzyme, along with the essential cofactor methylcobalamin, and/or supplementation with S-adenosylmethionine may bypass the defective MTHFR enzyme and may lead to normal DNA methylation.
Discussion
There are a few strategies against the fight of this disease that follow as natural corollaries from the evidence provided by our study. The first strategies are of clinical nature and may be easier to implement. Adequate and continuous supplementation of both 5-MTHF (5-methyltetrahydrofolate) and the required cofactor methylcobalamin would play a crucial anaplerotic role toward reestablishing the folate pathway immediately downstream of the defective MTHFR enzyme (Figure 2), and it would lead to normalized levels of DNA methylation in the case of the patients with either the C/T (heterozygous) or the T/T (homozygous for the mutation) genotype. Toward the same end, and assuming an attainable normal plasma concentration, supplementation with SAM (S-adenosylmethionine) may effect the same result. Clearly, clinical trials designed specifically to investigate those strategies are needed to provide definitive conclusions. Toward the same direction, future clinical trials may be designed to investigate whether adequate amounts of folate and methylcobalamin (via supplementation) could have a beneficial effect on patients like those with the homozygous wild type (C/C) genotype in our study who did not respond to CRT, and who did experience recurrence of the disease, for it stands to reason that a normal MTHFR enzyme in conjunction with inadequate amounts of the aforementioned chemicals could also lead to genomic DNA hypomethylation. Another strategy, of pharmacogenomic nature, also follows from the results of our study. The development of drugs that would target the MTHFR gene and induce overexpression of it, administered in conjunction with adequate supplementation of both folate and methylcobalamin, may prove to be of a greater benefit than the previously suggested approaches for the patients with either the homozygous for the mutation (T/T) or the heterozygous (C/T) genotype. Finally, given the impact of the common variant rs1801133 in the MTHFR gene to DNA methylation and, consequently, to oncogenesis, future studies may investigate its possible connection and role in other types of cancer.
Acknowledgements
This project was supported in part by the Clinical Core of the Mayo Clinic Center for Cell Signaling in Gastroenterology (P30DK084567), by the National Institutes of Health (R01 CA170357), and by Genomix Inc. The study sponsors had no role in the study design; in the collection, analysis, or interpretation of data; or in the preparation, writing, or decision to publish the manuscript.
Disclosure of conflict of interest
None.
Author contributions
J.B.N. designed the study on response to CRT; conceived and designed the study on recurrence of rectal cancer; performed all data analyses, including clinical, mathematical, and statistical for both studies; put together all figures and tables and supplementary material for both studies; and wrote the manuscript. J.T.L. assisted with data analysis in the study on response to CRT. E.D.M. conducted literature search on CRT and SNPs. J.W.A. collected clinical data. D.F.D. collected clinical data and obtained patient consent. R.A.J. collected clinical data and managed patient biosamples. T.C.S. reviewed and assessed tumor regression grades for all patients. P.S.T. designed the study on response to CRT, and assisted with data analysis in the study on response to CRT. L.A.B. oversaw and coordinated all project components that were carried out at the Mayo Clinic, and provided the necessary support. C.J.S. designed the study on response to CRT; oversaw and coordinated the entire project; and provided the necessary support. All authors edited and approved the manuscript.
Supporting Information
References
- 1.American Cancer Society. Cancer facts & figures. Atlanta: American Cancer Society; 2014. [Google Scholar]
- 2.MacFarlane JK, Ryall RD, Heald RJ. Mesorectal excision for rectal cancer. Lancet. 1993;341:457–60. doi: 10.1016/0140-6736(93)90207-w. [DOI] [PubMed] [Google Scholar]
- 3.Kapiteijn E, Marijnen CA, Nagtegaal ID, Putter H, Steup WH, Wiggers T, Rutten HJ, Pahlman L, Glimelius B, van Krieken JH, Leer JW, van de Velde CJ Dutch Colorectal Cancer Group. Preoperative radiotherapy combined with total mesorectal excision for resectable rectal cancer. N Engl J Med. 2001;345:638–46. doi: 10.1056/NEJMoa010580. [DOI] [PubMed] [Google Scholar]
- 4.Sauer R, Becker H, Hohenberger W, Rödel C, Wittekind C, Fietkau R, Martus P, Tschmelitsch J, Hager E, Hess CF, Karstens JH, Liersch T, Schmidberger H, Raab R German Rectal Cancer Study Group. Preoperative versus postoperative chemoradiotherapy for rectal cancer. N Engl J Med. 2004;351:1731–40. doi: 10.1056/NEJMoa040694. [DOI] [PubMed] [Google Scholar]
- 5.O’Neill BD, Brown G, Heald RJ, Cunningham D, Tait DM. Non-operative treatment after neoadjuvant chemoradiotherapy for rectal cancer. Lancet Oncol. 2007;8:625–33. doi: 10.1016/S1470-2045(07)70202-4. [DOI] [PubMed] [Google Scholar]
- 6.Washington MK, Berlin J, Branton P, Burgart LJ, Carter DK, Fitzgibbons PL, Halling K, Frankel W, Jessup J, Kakar S, Minsky B, Nakhleh R, Compton CC Members of the Cancer Committee, College of American Pathologists. Protocol for the examination of specimens from patients with primary carcinoma of the colon and rectum. Arch Pathol Lab Med. 2009;133:1539–51. doi: 10.5858/133.10.1539. [DOI] [PMC free article] [PubMed] [Google Scholar]
- 7.Bruzzone CM, Tawadros PS, Boardman LA, Steer CJ. Enhanced primer selection and synthetic amplicon templates optimize high-resolution melting analysis of single-nucleotide polymorphisms in a large population. Genet Test Mol Biomarkers. 2013;17:675–80. doi: 10.1089/gtmb.2013.0113. [DOI] [PMC free article] [PubMed] [Google Scholar]
- 8.Nikas JB. A mathematical model for short-term vs. long-term survival in patients with glioma. Am J Cancer Res. 2014;4:862–73. [PMC free article] [PubMed] [Google Scholar]
- 9.Nikas JB. Inflammation and immune system activation in aging: a mathematical approach. Sci Rep. 2013;3:3254. doi: 10.1038/srep03254. [DOI] [PMC free article] [PubMed] [Google Scholar]
- 10.Leonard B, Hart SN, Burns MB, Carpenter MA, Temiz NA, Rathore A, Vogel RI, Nikas JB, Law EK, Brown WL, Li Y, Zhang Y, Maurer MJ, Oberg AL, Cunningham JM, Shridhar V, Bell DA, April C, Bentley D, Bibikova M, Cheetham RK, Fan JB, Grocock R, Humphray S, Kingsbury Z, Peden J, Chien J, Swisher EM, Hartmann LC, Kalli KR, Goode EL, Sicotte H, Kaufmann SH, Harris RS. APOBEC3B upregulation and genomic mutation patterns in serous ovarian carcinoma. Cancer Res. 2013;73:7222–31. doi: 10.1158/0008-5472.CAN-13-1753. [DOI] [PMC free article] [PubMed] [Google Scholar]
- 11.Burns MB, Lackey L, Carpenter MA, Rathore A, Land AM, Leonard B, Refsland EW, Kotandeniya D, Tretyakova N, Nikas JB, Yee D, Temiz NA, Donohue DE, McDougle RM, Brown WL, Law EK, Harris RS. APOBEC3B is an enzymatic source of mutation in breast cancer. Nature. 2013;494:366–70. doi: 10.1038/nature11881. [DOI] [PMC free article] [PubMed] [Google Scholar]
- 12.Nikas JB, Low WC, Burgio PA. Prognosis of treatment response (pathological complete response) in breast cancer. Biomark Insights. 2012;7:59–70. doi: 10.4137/BMI.S9387. [DOI] [PMC free article] [PubMed] [Google Scholar]
- 13.Nikas JB, Low WC. Linear Discriminant Functions in Connection with the micro-RNA Diagnosis of Colon Cancer. Cancer Inform. 2012;11:1–14. doi: 10.4137/CIN.S8779. [DOI] [PMC free article] [PubMed] [Google Scholar]
- 14.Nikas JB, Boylan KL, Skubitz AP, Low WC. Mathematical prognostic biomarker models for treatment response and survival in epithelial ovarian cancer. Cancer Inform. 2011;10:233–47. doi: 10.4137/CIN.S8104. [DOI] [PMC free article] [PubMed] [Google Scholar]
- 15.Nikas JB, Low WC. Application of clustering analyses to the diagnosis of Huntington disease in mice and other diseases with well-defined group boundaries. Comput Methods Programs Biomed. 2011;104:e133–47. doi: 10.1016/j.cmpb.2011.03.004. [DOI] [PMC free article] [PubMed] [Google Scholar]
- 16.Nikas JB, Low WC. ROC-supervised principal component analysis in connection with the diagnosis of diseases. Am J Transl Res. 2011;3:180–96. [PMC free article] [PubMed] [Google Scholar]
- 17.Nikas JB, Keene CD, Low WC. Comparison of analytical mathematical approaches for identifying key nuclear magnetic resonance spectroscopy biomarkers in the diagnosis and assessment of clinical change of diseases. J Comp Neurol. 2010;518:4091–112. doi: 10.1002/cne.22365. [DOI] [PMC free article] [PubMed] [Google Scholar]
- 18.Voet D, Voet JG. Biochemistry. USA: John Wiley & Sons, Inc.; 2004. [DOI] [PubMed] [Google Scholar]
- 19.Scott JM. Folate and vitamin B12. Proc Nutr Soc. 1999;58:441–8. doi: 10.1017/s0029665199000580. [DOI] [PubMed] [Google Scholar]
- 20.Feinberg AP, Vogelstein B. Hypomethylation distinguishes genes of some human cancers from their normal counterparts. Nature. 1983;301:89–92. doi: 10.1038/301089a0. [DOI] [PubMed] [Google Scholar]
- 21.Baylin SB, Esteller M, Rountree MR, Bachman KE, Schuebel K, Herman JG. Aberrant patterns of DNA methylation, chromatin formation and gene expression in cancer. Hum Mol Genet. 2001;10:687–92. doi: 10.1093/hmg/10.7.687. [DOI] [PubMed] [Google Scholar]
- 22.Frosst P, Blom HJ, Milos R, Goyette P, Sheppard CA, Matthews RG, Boers GJ, den Heijer M, Kluijtmans LA, van den Heuvel LP, et al. A candidate genetic risk factor for vascular disease: a common mutation in methylenetetrahydrofolate reductase. Nat Genet. 1995;10:111–3. doi: 10.1038/ng0595-111. [DOI] [PubMed] [Google Scholar]
- 23.Castro R, Rivera I, Ravasco P, Camilo ME, Jakobs C, Blom HJ, de Almeida IT. 5,10-methylenetetrahydrofolate reductase (MTHFR) 677C-->T and 1298A-->C mutations are associated with DNA hypomethylation. J Med Genet. 2004;41:454–58. doi: 10.1136/jmg.2003.017244. [DOI] [PMC free article] [PubMed] [Google Scholar]
- 24.Friso S, Choi SW, Girelli D, Mason JB, Dolnikowski GG, Bagley PJ, Olivieri O, Jacques PF, Rosenberg IH, Corrocher R, Selhub J. A common mutation in the 5,10-methylenetetrahydrofolate reductase gene affects genomic DNA methylation through an interaction with folate status. Proc Natl Acad Sci U S A. 2002;99:5606–611. doi: 10.1073/pnas.062066299. [DOI] [PMC free article] [PubMed] [Google Scholar]
- 25.Stern LL, Mason JB, Selhub J, Choi SW. Genomic DNA hypomethylation, a characteristic of most cancers, is present in peripheral leukocytes of individuals who are homozygous for the C677T polymorphism in the methylenetetrahydrofolate reductase gene. Cancer Epidemiol Biomarkers Prev. 2000;9:849–53. [PubMed] [Google Scholar]
- 26.Hovestadt V, Jones DT, Picelli S, Wang W, Kool M, Northcott PA, Sultan M, Stachurski K, Ryzhova M, Warnatz HJ, Ralser M, Brun S, Bunt J, Jager N, Kleinheinz K, Erkek S, Weber UD, Bartholomae CC, von Kalle C, Lawerenz C, Eils J, Koster J, Versteeg R, Milde T, Witt O, Schmidt S, Wolf S, Pietsch T, Rutkowski S, Scheurlen W, Taylor MD, Brors B, Felsberg J, Reifenberger G, Borkhardt A, Lehrach H, Wechsler-Reya RJ, Eils R, Yaspo ML, Landgraf P, Korshunov A, Zapatka M, Radlwimmer B, Pfister SM, Lichter P. Decoding the regulatory landscape of medulloblastoma using DNA methylation sequencing. Nature. 2014;510:537–41. doi: 10.1038/nature13268. [DOI] [PubMed] [Google Scholar]
- 27.Zelic R, Fiano V, Grasso C, Zugna D, Pettersson A, Gillio-Tos A, Merletti F, Richiardi L. Global DNA hypomethylation in prostate cancer development and progression: a systematic review. Prostate Cancer Prostatic Dis. 2015;18:1–12. doi: 10.1038/pcan.2014.45. [DOI] [PubMed] [Google Scholar]
- 28.Chen RZ, Pettersson U, Beard C, Jackson-Grusby L, Jaenisch R. DNA hypomethylation leads to elevated mutation rates. Nature. 1998;395:89–93. doi: 10.1038/25779. [DOI] [PubMed] [Google Scholar]
- 29.Cancer Genome Atlas Research Network. Comprehensive molecular characterization of clear cell renal cell carcinoma. Nature. 2013;499:43–9. doi: 10.1038/nature12222. [DOI] [PMC free article] [PubMed] [Google Scholar]
- 30.Eden A, Gaudet F, Waghmare A, Jaenisch R. Chromosomal instability and tumors promoted by DNA hypomethylation. Science. 2003;300:455. doi: 10.1126/science.1083557. [DOI] [PubMed] [Google Scholar]
Associated Data
This section collects any data citations, data availability statements, or supplementary materials included in this article.