

Abstract
Aims: MicroRNAs play important roles in energy metabolism, insulin synthesis, insulin transport and the development of diabetes. This study aims to investigate the expression and effect of microRNA-130a in Uygur patients with type 2 diabetes mellitus (T2DM). Materials and methods: Peripheral blood and omental adipose tissues were collected from individuals with normal glucose tolerance and patients with T2DM. The microRNA expression profile of peripheral blood was established by microarray analysis. The differentially expressed microRNAs and possible target genes were identified by bioinformatics analysis. MicroRNA-130a mimics and inhibitors were transfected into 3T3-L1 preadipocytes. Results: Our results showed that microRNA-130a expression level was significantly decreased in peripheral blood and omental adipose tissues of T2DM patients (P < 0.01). Peroxisome proliferator-activated receptors γ (PPARγ) were predicted as target genes of microRNA-130a. This prediction was verified by the results that PPARγ mRNA expression in omental adipose tissues of T2DM patients were significantly increased (P < 0.01). The glucose consumption level after microRNA-130a transfection was significantly decreased (P < 0.05). And, microRNA-130a mimics inhibited PPARγ expression at both mRNA and protein level, further suggesting that PPARγ is a target gene of microRNA-130a. Additionally, adiponectin, lipoprotein lipase, CCAAT enhancer binding protein α, and the downstream genes of PPARγ, were significantly decreased after microRNA-130a mimics transfection. Conclusions: In conclusion, microRNA-130a is decreased in Uygur patients with T2DM and it may play a role in T2DM through targeting PPARγ.
Keywords: microRNAs, Uygur, type 2 diabetes, microarray, peroxisome proliferator-activated receptors γ, tumor necrosis factor α
Introduction
Diabetes mellitus (DM) is now an increasingly serious health problem faced by many countries and its prevalence rate is increasing [1,2]. China has become one of the countries that have the fastest growing rate in DM prevalence. Ning et al [3] reported that the average prevalence rate of DM in Chinese adults was 11.6%. An epidemiological study has shown that the prevalence rate of type 2 DM (T2DM) was 8.42% in Uygur, Xinjiang, China [4].
MicroRNAs (miRNAs) are a class of small non-coding RNA molecules, with the length of 21 to 25 nucleotides. They can bind with the 3’-untranslated region of the target genes, promote the degradation of mRNA, or inhibit the translation of mRNA, thus inhibiting the expression of the target proteins [5]. MiRNAs play important roles in many events, such as cell differentiation [6] and animal development [7]. Poy et al [8] reported that miR-375 overexpression in pancreatic β cells inhibited glucose-induced insulin secretion. miR-14 can regulate the size of lipid droplets and the levels of triglycerides [9]. miR-122 is involved in the regulation of lipid metabolism [10]. miR-133 and miRNA-1 are muscle specific miRNAs and play important roles in the regulation of muscle cell differentiation [11].
It is reported that miRNAs may also be involved in the pathogenesis of T2DM. Short non-coding miRNAs can control exocytosis, the final event in insulin secretion, and are the “ribo-regulators” of glucose homeostasis [12]. He et al [13] found that overexpression of miRNA-29 significantly inhibited insulin-stimulated glucose uptake, and promoted insulin resistance, resulting in the development of T2DM. Therefore, in this study, the miRNAs associated with the pathogenesis of T2DM were screened with micro-array in Uygur patients with T2DM. The mechanisms underlying the role of the differentially expressed miRNAs in T2DM were also investigated.
Materials and methods
Clinical data
A total of 72 individuals from Xinjiang Uyghur, including 42 individuals with normal glucose tolerance (NGT) and 30 patients with T2DM, were enrolled in this study. Inclusion criteria: Their age was between 30 to 80 years old. They were Uyghur males and females for three generations of linear relatives and they were unrelated. They lived in Xinjiang Uyghur Autonomous Region for more than 20 years. Exclusion criteria: Pregnant or lactating women; Patients with a history of mental illness or drug abuse; Patients who underwent surgery or with other emergency situations; Patients who recently took antibiotics, steroids or probiotics; Patients with obvious liver and kidney dysfunction, gastrointestinal diseases (such as chronic gastrointestinal disorders, diarrhea, biliary tract infection and enteritis), or serious diseases of the blood or the endocrine systems; Patients with severe heart diseases and with systolic blood pressure > 160 mmHg and diastolic blood pressure > 95 mmHg; Patients who required insulin treatment or had a history of ketoacidosis; Patients with type I DM, gestational DM or other particular types of DM. T2DM was diagnosed according to the 2011 American Diabetes Association Guidelines for Diagnosis. Patients with fasting blood glucose level ≥ 7.0 mmol/L (126 mg/dL) or blood glucose level ≥ 11.1 mmol/L (200 mg/dL) after 2 h of oral glucose tolerance test were diagnosed as T2DM. Patients with fasting blood glucose level < 6.1 mmol/L (110 mg/dL) and 2 h post-meal blood glucose level < 7.8 mmol/L (140 mg/dL) were determined as NGT.
Among the 72 individuals, peripheral blood was collected from 48 individuals. Peripheral blood of 6 individuals with NGT and 6 patients with T2DM were used for microarray assay. Their clinical data was shown in Table 1. Peripheral blood of 24 individuals with NGT and 12 patients with T2DM were used for detecting expression of miRNAs. Their clinical data was shown in Table 2. Among the 72 individuals, omental adipose tissue was collected from 24 individuals, including 12 NGT and 12 T2DM. Their clinical data was shown in Table 3.
Table 1.
Biochemical index of 6 individuals with NGT and 6 patients with T2DM
| Subjects | Age (years) | BMI (kg/m2) | SBP (mmHg) | DBP (mmHg) | FPG (mmol/L) | TC (mmol/L) | TG (mmol/L) | HDL-C (mmol/L) | LDL-C (mmol/L) |
|---|---|---|---|---|---|---|---|---|---|
| NGT | 53 ± 7 | 23.4 ± 5.5 | 138 ± 38 | 81 ± 14 | 4.85 ± 0.41 | 4.13 ± 0.71 | 1.58 ± 0.79 | 0.91 ± 0.16 | 2.29 ± 0.45 |
| T2DM | 54 ± 11 | 30.4 ± 2.5* | 131 ± 14 | 85 ± 10 | 10.36 ± 4.49* | 5.67 ± 1.76 | 3.63 ± 1.96* | 0.92 ± 0.32 | 3.00 ± 0.81 |
Note: Body mass index (BMI), Systolic blood pressure (SBP), Diastolic blood pressure (DBP), Fasting blood glucose (FBG), Total cholesterol (TC), Triglyceride (TG), High-density lipoprotein cholesterol (HDL-C), Low-desity lipoprotein cholesterol (LDL-C), Normal glucose tolerance group (NGT), Type 2 diabetes mellitus (T2DM).
P < 0.05, T2DM vs NGT.
Table 2.
Clinical data of 24 individuals with NGT and 12 patients with T2DM
| Subjects | Age (years) | BMI (kg/m2) | SBP (mmHg) | DBP (mmHg) | FPG (mmol/L) | TC (mmol/L) | TG (mmol/L) | HDL-C (mmol/L) | LDL-C (mmol/L) |
|---|---|---|---|---|---|---|---|---|---|
| NGT | 49 ± 13 | 26.3 ± 3.6 | 124 ± 21 | 76 ± 10 | 4.99 ± 0.86 | 3.07 ± 1.08 | 1.82 ± 1.44 | 1.94 ± 0.89 | 2.96 ± 0.78 |
| T2DM | 56 ± 10 | 30.9 ± 5.8* | 127 ± 19 | 78 ± 11 | 10.08 ± 4.35* | 4.41 ± 0.89* | 2.80 ± 2.33 | 0.96 ± 0.21* | 2.67 ± 0.70 |
Note: Body mass index (BMI), Systolic blood pressure (SBP), Diastolic blood pressure (DBP), Fasting blood glucose (FBG), Total cholesterol (TC), Triglyceride (TG), High-density lipoprotein cholesterol (HDL-C), Low-density lipoprotein cholesterol (LDL-C), Normal glucose tolerance group (NGT), Type 2 diabetes mellitus (T2DM).
P < 0.05, T2DM vs NGT.
Table 3.
Clinical data of 12 individuals with NGT and 12 patients with T2DM
| Subjects | Age (years) | BMI (kg/ m2) | SBP (mmHg) | DBP (mmHg) | FPG (mmol/L) | TC (mmol/L) | TG (mmol/L) | HDL-C (mmol/L) | LDL-C (mmol/L) |
|---|---|---|---|---|---|---|---|---|---|
| NGT | 53 ± 14 | 25.7 ± 4.2 | 116 ± 17 | 75 ± 17 | 4.88 ± 0.60 | 4.53 ± 0.88 | 1.04 ± 0.53 | 1.11 ± 0.40 | 2.79 ± 1.19 |
| T2DM | 57 ± 11 | 27.9 ± 4.2 | 120 ± 6 | 75 ± 7 | 10.20 ± 3.01* | 4.68 ± 0.72 | 2.12 ± 1.59* | 1.28 ± 038 | 2.53 ± 0.87 |
Note: Body mass index (BMI), Systolic blood pressure (SBP), Diastolic blood pressure (DBP), Fasting blood glucose (FBG), Total cholesterol (TC), Triglyceride (TG), High-density lipoprotein cholesterol (HDL-C), Low-density lipoprotein cholesterol (LDL-C), Normal glucose tolerance group (NGT), Type 2 diabetes mellitus (T2DM).
P < 0.05, T2DM vs NGT.
Prior written and informed consent were obtained from every patient and the study was approved by the ethics review board of Xinjiang Medical University.
3T3-L1 cell culture and treatment
The 3T3-L1 preadipocytes were obtained from Dr. Qiqun Tang from the Institute of Biological Science, Fudan University (Shanghai, China). They were cultured in DMEM high glucose medium (GIBCO, Carlsbad, CA, USA) supplemented with 10% fetal bovine serum (GIBCO, Carlsbad, CA, USA) and 1% penicillin-streptomycin (GIBCO, Carlsbad, CA, USA). And, they were kept in an incubator at 37°C with 5% CO2.
The 3T3-L1 preadipocytes at the exponential phase were seeded into 6 well plates at a concentration of 1 × 10⁶ cells/ml. After culturing for 5 days, 0.5 mM IBMX (Sigma-Aldrich, St. Louis, USA), 2.5 μM dexamethasone (Sigma-Aldrich, St. Louis, USA), and 10 μg/ml insulin (ROCHE, Mannheim, Germany) were added to induce the differentiation of preadipocytes. The 3T3-L1 preadipocytes were transfected with miR-130a mimics and inhibitors (Qiagen, Valencia, CA, USA) using Hiperfect Transfection Reagent (Qiagen, Valencia, CA, USA). The constructs were custom synthesized from Qiagen. Cells were divided into the following groups: the control group, the mir-130a mimics group (75 nM) and the mir-130a inhibitor group (75 nM). After culturing for 72 h, cells were collected for further analysis.
Micro-array analysis
Total RNAs were extracted from peripheral blood using TRI REAGENT BD (ChinaGen, Inc, Shenzhen, China). For fluorescent probe labeling, miRNAs were labeled with Hy3™ or Hy5™ fluorophore using miRCURY™ Array Power labeling kit (Exiqon, Vedbaek, Denmark). Under standard conditions, fluorescence labeled probes were hybridized with miRCURY™ chip (Exiqon, Vedbaek, Denmark) in PhalanxTM hybridization bags (Exiqon, Vedbaek, Denmark). The fluorescence intensity was scanned on a GenePix 4000B scanner (Axon Instruments, Foster City, CA, USA) and the scanning results were converted into digital data. The results were analyzed by the softwares of targetscan, miRBase and miRanda.
Real-time PCR
Total RNAs were extracted from peripheral blood, omental adipose tissue and 3T3-L1 preadipocytes. Then, RNAs were reversely transcribed into cDNA. For amplification of miRNAs, the miRNA-specific forward primers and a reverse universal primer were designed and synthesized by Qiagen (Valencia, CA, USA). The real-time PCR for miRNA amplification was performed according to the instructions provided by the miScript SYBR® Green PCR kit (Qiagen). The following PCR procedures were used, initial activation at 95°C for 15 min, followed by 40 cycles of denaturation at 95°C for 15 seconds, annealing at 55°C for 30 seconds, and extension at 70°C for 30 seconds.
For mRNA quantification, RNA was extracted and reversely transcribed into cDNA. For amplification of peroxisome proliferator-activated receptors γ (PPARγ), β-actin, lipoprotein lipase (LPL), adiponectin (APM1), CCAAT enhancer binding protein α (CEBPα) and their primers were designed by Primer 5.0 and synthesized by Sangon (Sangon Biotech Co., Ltd., Shanghai, China). The amplification was performed according to the instructions of miScript SYBR® Green PCR kit. The primer sequences were shown in Table 4. β-actin was used as an internal control. The 2-ΔΔCt method was used to calculate the relative expression levels of genes.
Table 4.
Primer sequences used in real-time PCR
| Genes | Primer sequence |
|---|---|
| β-actin (human) | Forward: 5’-TGGCACCCAGCACAATGAA-3’ |
| Reverse: 5’-CTAAGTCATAGTCCGCCTAGAAGCA-3’ | |
| PPARγ (human) | Forward: 5’-CAC AGG CCG AGA AGGAGAA-3’ |
| Reverse: 5’-TTG GTC AGC GGG AAGGA-3’ | |
| β-actin (mouse) | Forward: 5’-GTGACGTTGACATCCGTAAAGA-3’ |
| Reverse: 5’-GCCGGACTCATCGTACTCC-3’ | |
| PPARγ (mouse) | Forward: 5’-CTCCAAGAATACCAAAGTGCGA-3’ |
| Reverse: 5’-GCCTGATGCTTTATCCCCACA-3’ | |
| LPL (mouse) | Forward: 5’-TGGCGTAGCAGGAAGTCTGA-3’ |
| Reverse: 5’-TGCCTCCATTGGGATAAATGTC-3’ | |
| GLUT4 (mouse) | Forward: 5’-GTGACTGGAACACTGGTCCTA-3’ |
| Reverse: 5’-CCAGCCACGTTGCATTGTAG-3’ | |
| APM1 (mouse) | Forward: 5’-ACAAGGCCGTTCTCTTCACC-3’ |
| Reverse: 5’-GTCCATTGTGGTCCCCATCC-3’ | |
| CEBPα (mouse) | Forward: 5’-CAAGAACAGCAACGAGTACCG-3’ |
| Reverse: 5’-GTCACTGGTCAACTCCAGCAC-3’ |
Note: peroxisome proliferator-actiated receptors γ (PPARγ), lipoprotein lipase (LPL), glucose transporter 4 (GLUT4), adiponectin (APM1), CCAAT enhancer binding protein α (CEBPα).
Measurement of the content of glucose
At 72 h after transfection, cell culture supernatant was collected and the levels of glucose were detected by Glucose Assay Kit (BioVision, Mountain View, CA, USA) according to the manufacturers’ instructions. Briefly, the standard curve was generated by measuring the glucose standard sample. The absorbance of cell culture supernatant was measured at 570 nm by colorimetric assay. Finally, the levels of glucose consumption were calculated by C = Sa/Sv (nmol/µl or µ µmol/ml, or mM). Sa is the sample amount from standard curve. Sv is the sample volume added into the sample wells.
Western blot analysis
At 72 h after transfection, total proteins were extracted from 3T3-L1 preadipocytes. 3T3-L1 cells were immediately lysed in an ice-cold RIPA buffer. The protein was quantified by BCA assay (Pierce Endogen, IL, USA). Samples were then separated on 10-12% SDS polyacrylamide gels and proteins were transferred to a PVDF membrane (BIO-RAD, CA, USA). The membrane was first incubated with primary antibodies against PPARγ (Cell signaling, Boston, USA) and GAPDH (Santa Cruz Biotechnology Inc., CA, USA). Then, the membrane was incubated with secondary antibodies conjugated with horseradish peroxidase (HRP). The membrane was detected using the ECL Western blotting analysis system.
Statistical analysis
Data were analyzed with SPSS 17.0 software. All experimental data were presented as means ± SD. Student’s t-test was used to analyze comparison between groups). ANOVA followed by a Tukey analysis test was used for multiple comparisons. P < 0.05 was considered as statistically significant.
Results
Expression profile of miRNAs in NGT and T2DM patients
To identify the differentially expressed miRNAs between NGT and T2DM patients, microarray assay was performed. Total RNAs from peripheral blood of NGT and T2DM patients were used for analysis. The microarray assay results were analyzed by targetscan, miRBase and miRanda. A total of 59 kinds of differentially expressed miRNAs were identified. The fold change of miRNA expression in T2DM patients to that in NGT individuals was calculated. Among these 59 miRNAs, there were 8 miRNAs with fold change more than 2, including miR-130a, 892a, 155, 133a, 421, 10b, 193b, 143. Furthermore, the predicted target genes of these miRNAs were associated with glucose and lipid metabolism. For example, PPARγ, which was the predicted target gene of miR-130a, is best known for its role in regulating adipogenic pathways. FGF1 (fibroblast growth factor 1), which was the predicted target gene of miR-133a, is a key regulator of human adipogenesis. These results indicate that these differentially expressed miRNAs in Xinjiang Uygur patients with T2DM might play an important role in glucose and lipid metabolism.
MicroRNAs of miR-130a, 10b and 143 are decreased in peripheral blood of T2DM patients
To further verify the microarray results, real-time PCR was conducted to detect the expression levels of miRNAs in peripheral blood of NGT and T2DM patients. Quantitative real-time PCR results were shown. As shown in Figure 1, the expression levels of miR-130a, 10b and 143 in T2DM patients were significantly lower than those in NGT individuals (P < 0.01). The expression levels of hsa-miR-155, 892a, 133a, 421 and 193b were not significantly different between NGT and T2DM patients. These results suggest that miR-130a, 10b and 143 are decreased in peripheral blood of Xinjiang Uygur patients with T2DM.
Figure 1.
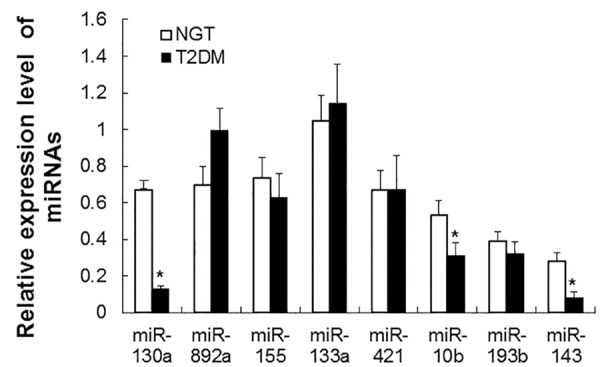
Analysis of miRNA expression in peripheral blood of NGT and T2DM patients. Real-time PCR was performed to analyze the expression levels of miR-130a, 892a, 155, 133a, 421, 10b, 193b, 29a, 143, and 107. β-actin was used as an internal control. Relative expression levels of miRNAs were calculated based on those of β-actin. Compared with NGT, *P < 0.01.
miR-130a levels are decreased while PPARγ mRNA levels are elevated in omental adipose tissues of T2DM patients
The expression levels of miR-130a, 10b and 143 in omental adipose tissues of NGT and T2DM patients were further measured by real-time PCR. As shown in Figure 2A, the expression levels of miR-130a in T2DM patients were significantly lower than those in NGT individuals (P < 0.01). However, no significant difference was found in the expression levels of miR-10b and 143 between NGT and T2DM patients. These results suggest that miR-130a might play important role in adipocyte.
Figure 2.
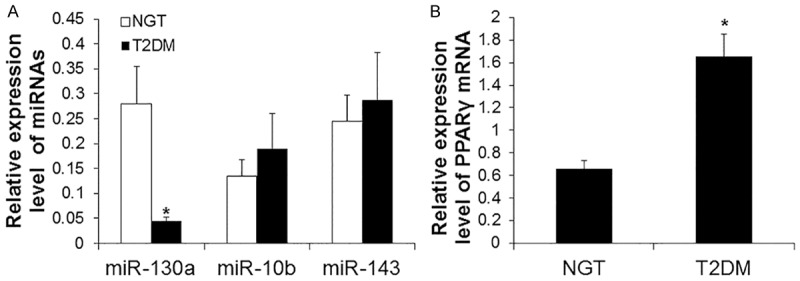
Analysis of miRNA and PPARγ expression in omental adipose tissues of NGT and T2DM patients. Real-time PCR was performed to analyze the expression levels of miRNAs and PPARγ. β-actin was used as an internal control. Relative expression levels were calculated based on those of β-actin. A. Expression levels of miR-130a, 107, 29a, and 143. Compared with NGT, *P < 0.01. B. Expression levels of PPARγ mRNA. Compared with NGT, *P < 0.05.
As predicted by targetscan, miRBase and miRanda, PPARγ were possible target genes of miR-130a. To determine the expression levels of PPARγ mRNA in omental adipose tissues of NGT and T2DM patients, real-time PCR was performed. As shown in Figure 2B, T2DM patients had significantly higher levels of PPARγ than NGT individuals (P < 0.05). These results indicate that PPARγ is one of target genes of miR-130a.
The consumption of glucose is increased after transfection of miR-130a mimics
To determine the consumption of glucose, the levels of glucose in cell culture supernatant was measured at 72 h after transfection of miR-130a mimics and inhibitors in 3T3-L1 preadipocytes. The concentration of glucose transfected with miR-130a mimics, miR-130a inhibitors and control group were 9.12 ± 0.29 nM, 9.39 ± 0.23 nM, and 9.61 ± 0.02 nM (Figure 3). Compared with control cells, the consumption of glucose in cells transfected with miR-130a mimics was significantly increased (P < 0.05). These results suggest that miR-130 enhances the ability of glucose uptake.
Figure 3.
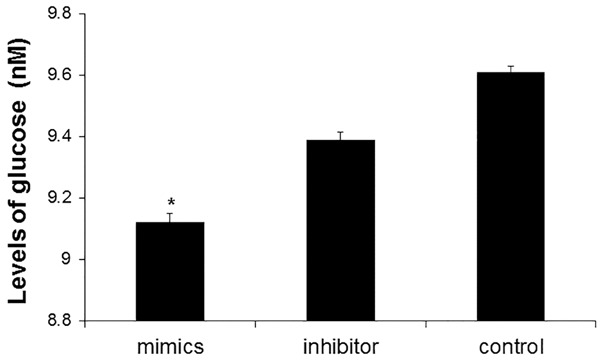
Analysis of glucose consumption level after miR-130a mimics transfection. At 72 h after transfection with miR-130a mimics, miR-130a inhibitors and control siRNA, cell culture supernatant of 3T3-L1 preadipocytes was collected and the levels of glucose were measured. Compared with control, *P < 0.05.
PPARγ protein level is decreased after transfection of mir-130a mimics
To measure determine the expression level of PPARγ protein, Western blot analysis was performed at 72 h after transfection of miR130a mimics and inhibitors in 3T3-L1 preadipocytes. Representative and quantitative Western blotting results were shown in Figure 4A and 4B, respectively. The level of PPARγ protein in cells transfected with miR130a mimics was lower than that in cells transfected with miR-130a inhibitors and control siRNA. Statistically, cells transfected with miR130a mimics had significantly lower level of PPARγ protein than cells transfected with control siRNA (P < 0.05). These results showed that miR130a mimics inhibited the expression of PPARγ protein, further suggesting that PPARγ gene may be one of the target genes of miR-130a.
Figure 4.
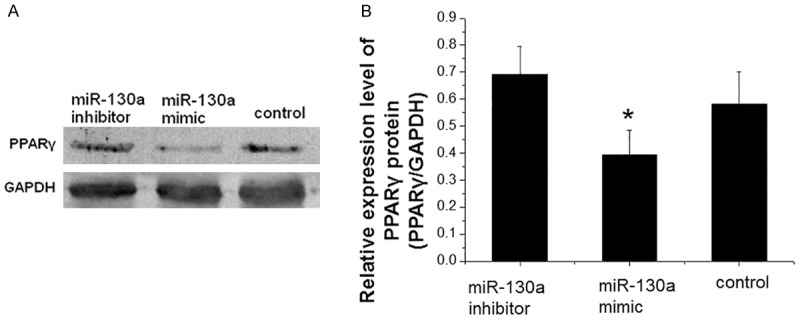
Analysis of PPARγ protein level after miR-130a mimics transfection. At 72 h after transfection with miR-130a mimics, miR-130a inhibitors and control siRNA, preadipocytes were collected and total proteins were extracted. Western blotting was performed to detect the expression of PPARγ protein. GAPDH was used as an internal control. A. Representative Western blotting results. B. Quantitative Western blotting results. Compared with control, *P < 0.05.
Expression levels of glucose and lipid metabolism related genes are decreased after transfection of miR-130a mimics
To detect the levels of APM1, LPL, CEBPα and PPARγ after transfection of miR130a mimics (75 nM), real-time PCR was carried out at 72 h after transfection. As shown in Figure 5, the levels of APM1, LPL, CEBPα and PPARγ were reduced after transfection of miR130a mimics. Statistically, the downstream genes of PPARγ were significantly decreased after transfection with microRNA-130a mimics (P < 0.05), suggesting that miR-130a mimics inhibit the expression of APM1, LPL, CEBPα, and PPARγ.
Figure 5.
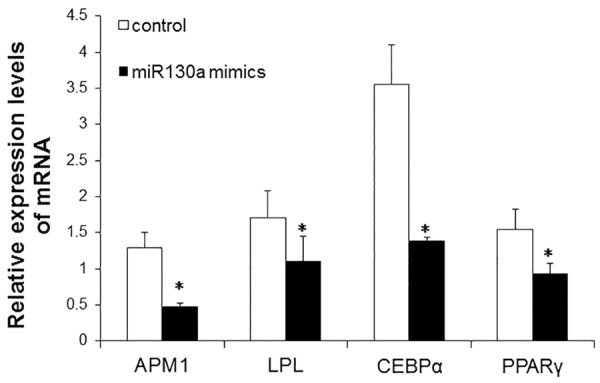
Analysis of APM1, LPL, CEBPα, PPARγ, AP2 and GLUT4 expression at mRNA level after miR-130a mimics transfection. Real-time PCR was carried out at 72 h after miR130a mimics (75 nM) transfection. β-actin was used as an internal control. Relative expression levels were calculated based on those of β-actin. Compared with control, *P < 0.05.
Discussion
It is reported that miR-130a is closely related with insulin secretion and adipogenesis. Hennessy et al [14] reported that miR-130a knockdown in MIN6 cells decreased the secretion of insulin in response to glucose stimulation. Lee et al [15] found that in adipose tissues of obese women and in 3T3-L1 preadipocytes, miR-130 (including miR-130a and miR130b) inhibited adipogenesis through suppressing the expression of PPARγ. In this study, many miRNAs were differentially expressed between NGT and T2DM patients of Xinjiang Uygurs. Among them, the expression level of miR-130a was significantly decreased both in peripheral blood and omental adipose tissues of T2DM patients. This data suggests that miR-130a may be related with the development of T2DM.
Through analysis with targetscan, miRBase and miRanda, PPARγ gene, which is involved in glucose and lipid metabolism, was predicted as possible target gene of miR-130a. PPARγ is a kind of transcription factor, which belongs to the large family of nuclear hormone receptors. It is expressed mainly in adipose tissue. Furthermore, PPARγ is an important factor in regulating the differentiation of preadipocytes into mature adipocytes process. It begins to express in the early stage of cell differentiation, and its expression level is gradually increased during cell differentiation [16-18]. Our results showed that the mRNA expression level of PPARγ in omental adipose tissues of T2DM patients were higher than those of NGT individuals. As mentioned above, PPARγ was a possible target gene of miR-130a. Thus, this increase in mRNA expression levels of PPARγ may be caused by the decreased levels of miRNA-130a.
Activated PPARγ can regulate transcription of genes associated with the effects of insulin. The function of these genes includes transport and usage of glucose and regulation of lipid metabolism. In this study, after transfection of miR-130a mimics in 3T3-L1 preadipocytes, expression levels of PPARγ protein and mRNA were reduced. These results further suggest that PPARγ is one of the target genes of miR-130a. Further investigation showed that the expression levels of downstream target genes of PPARγ, adipogenic gene products including APM1, LPL, and CEBPα, were also decreased after transfection of miR-130a mimics. This data indicates that miR-130a may indirectly affect generation and differentiation of adipocytes.
Furthermore, we previously reported that the level of miRNA130a expression in peripheral anticoagulant blood in Uygur obesity population was significantly reduced, indicating that the level of miRNA130a expression may be related with Uygur obesity [19]. And, the low expression of miR-130a in the obese persons may reflect a relative depletion of preadipocytes due to their recruitment into the adipocyte pool. Furthermore, the obesity is the basis of pathophysiology of insulin resistance. In this study, we found that miR-130 enhanced the ability of glucose uptake. These results suggest that the reduction of miR-130a might promote obesity, which may further lead to insulin resistance and T2DM.
In summary, the expression of miR-130a is decreased in Xinjiang Uygur T2DM patients. Expression level of PPARγ, target gene of miR-130a, is increased in omental tissues of T2DM patients. Consistently, expression levels of PPARγ and its downstream genes are inhibited by miR130a mimics transfection. Our findings suggest that miR-130a may play an important role in the development of insulin resistance and T2DM.
Acknowledgements
This study was supported by Xinjiang Uygur Autonomous Region Science and Technology Department of Science and Technology Project “Xinjiang innovative drug preclinical pharmacodynamic evaluation technology platform” (project number: 201 233 150). This work was also supported by National Natural Science Foundation of China (No. 80160068 and No. 81460162).
Disclosure of conflict of interest
None.
References
- 1.Reinehr T. Type 2 diabetes mellitus in children and adolescents. World J Diabetes. 2013;4:270–281. doi: 10.4239/wjd.v4.i6.270. [DOI] [PMC free article] [PubMed] [Google Scholar]
- 2.Ferrannini E, Cushman WC. Diabetes and hypertension: the bad companions. Lancet. 2012;380:601–610. doi: 10.1016/S0140-6736(12)60987-8. [DOI] [PubMed] [Google Scholar]
- 3.Ning G, Bloomgarden Z. Diabetes in China: prevalence, diagnosis, and control. J Diabetes. 2013;5:372. doi: 10.1111/1753-0407.12088. [DOI] [PubMed] [Google Scholar]
- 4.Tao Y, Mao X, Xie Z, Ran X, Liu X, Wang Y, Luo X, Hu M, Gen W, Zhang M, Wang T, Ren J, Wufuer H, Li L. The prevalence of type 2 diabetes and hypertension in Uygur and Kazak populations. Cardiovasc Toxicol. 2008;8:155–159. doi: 10.1007/s12012-008-9024-0. [DOI] [PubMed] [Google Scholar]
- 5.Mukhopadhyay P, Brock G, Pihur V, Webb C, Pisano MM, Greene RM. Developmental microRNA expression profiling of murine embryonic orofacial tissue. Birth Defects Res A Clin Mol Teratol. 2010;88:511–534. doi: 10.1002/bdra.20684. [DOI] [PMC free article] [PubMed] [Google Scholar]
- 6.He M, Wang QY, Yin QQ, Tang J, Lu Y, Zhou CX, Duan CW, Hong DL, Tanaka T, Chen GQ, Zhao Q. HIF-1alpha downregulates miR-17/20a directly targeting p21 and STAT3: a role in myeloid leukemic cell differentiation. Cell Death Differ. 2013;20:408–418. doi: 10.1038/cdd.2012.130. [DOI] [PMC free article] [PubMed] [Google Scholar]
- 7.Stefani G, Slack FJ. Small non-coding RNAs in animal development. Nat Rev Mol Cell Biol. 2008;9:219–230. doi: 10.1038/nrm2347. [DOI] [PubMed] [Google Scholar]
- 8.Poy MN, Eliasson L, Krutzfeldt J, Kuwajima S, Ma X, Macdonald PE, Pfeffer S, Tuschl T, Rajewsky N, Rorsman P, Stoffel M. A pancreatic islet-specific microRNA regulates insulin secretion. Nature. 2004;432:226–230. doi: 10.1038/nature03076. [DOI] [PubMed] [Google Scholar]
- 9.Xu P, Vernooy SY, Guo M, Hay BA. The Drosophila microRNA Mir-14 suppresses cell death and is required for normal fat metabolism. Curr Biol. 2003;13:790–795. doi: 10.1016/s0960-9822(03)00250-1. [DOI] [PubMed] [Google Scholar]
- 10.Esau C, Davis S, Murray SF, Yu XX, Pandey SK, Pear M, Watts L, Booten SL, Graham M, McKay R, Subramaniam A, Propp S, Lollo BA, Freier S, Bennett CF, Bhanot S, Monia BP. miR-122 regulation of lipid metabolism revealed by in vivo antisense targeting. Cell Metab. 2006;3:87–98. doi: 10.1016/j.cmet.2006.01.005. [DOI] [PubMed] [Google Scholar]
- 11.Yang B, Lin H, Xiao J, Lu Y, Luo X, Li B, Zhang Y, Xu C, Bai Y, Wang H, Chen G, Wang Z. The muscle-specific microRNA miR-1 regulates cardiac arrhythmogenic potential by targeting GJA1 and KCNJ2. Nat Med. 2007;13:486–491. doi: 10.1038/nm1569. [DOI] [PubMed] [Google Scholar]
- 12.Gauthier BR, Wollheim CB. MicroRNAs: ‘ribo-regulators’ of glucose homeostasis. Nat Med. 2006;12:36–38. doi: 10.1038/nm0106-36. [DOI] [PubMed] [Google Scholar]
- 13.He A, Zhu L, Gupta N, Chang Y, Fang F. Overexpression of micro ribonucleic acid 29, highly up-regulated in diabetic rats, leads to insulin resistance in 3T3-L1 adipocytes. Mol Endocrinol. 2007;21:2785–2794. doi: 10.1210/me.2007-0167. [DOI] [PubMed] [Google Scholar]
- 14.Hennessy E, Clynes M, Jeppesen PB, O’Driscoll L. Identification of microRNAs with a role in glucose stimulated insulin secretion by expression profiling of MIN6 cells. Biochem Biophys Res Commun. 2010;396:457–462. doi: 10.1016/j.bbrc.2010.04.116. [DOI] [PubMed] [Google Scholar]
- 15.Lee EK, Lee MJ, Abdelmohsen K, Kim W, Kim MM, Srikantan S, Martindale JL, Hutchison ER, Kim HH, Marasa BS, Selimyan R, Egan JM, Smith SR, Fried SK, Gorospe M. miR-130 suppresses adipogenesis by inhibiting peroxisome proliferator-activated receptor gamma expression. Mol Cell Biol. 2011;31:626–638. doi: 10.1128/MCB.00894-10. [DOI] [PMC free article] [PubMed] [Google Scholar]
- 16.Guo X, Liao K. Analysis of gene expression profile during 3T3-L1 preadipocyte differentiation. Gene. 2000;251:45–53. doi: 10.1016/s0378-1119(00)00192-x. [DOI] [PubMed] [Google Scholar]
- 17.Saladin R, Fajas L, Dana S, Halvorsen YD, Auwerx J, Briggs M. Differential regulation of peroxisome proliferator activated receptor gamma1 (PPARgamma1) and PPARgamma2 messenger RNA expression in the early stages of adipogenesis. Cell Growth Differ. 1999;10:43–48. [PubMed] [Google Scholar]
- 18.Ahmadian M, Suh JM, Hah N, Liddle C, Atkins AR, Downes M, Evans RM. PPARgamma signaling and metabolism: the good, the bad and the future. Nat Med. 2013;19:557–566. doi: 10.1038/nm.3159. [DOI] [PMC free article] [PubMed] [Google Scholar]
- 19.Zhu M, Jiao Y, Long M, Mao X, Ma X, Wu Y, Wang Y, Li L. The association of the miRNA expression in peripheral anticoagulant blood and its relationship with obesity in Uygur population. Chinese Journal of Gerontology. 2013;33:1985–1988. [Google Scholar]