

Abstract
Stretching single ventricular cardiac myocytes has been shown experimentally to activate transmembrane nicotinamide adenine dinucleotide phosphate oxidase type 2 to produce reactive oxygen species (ROS) and increase the Ca2+ spark rate in a process called X-ROS signaling. The increase in Ca2+ spark rate is thought to be due to an increase in ryanodine receptor type 2 (RyR2) open probability by direct oxidation of the RyR2 protein complex. In this article, a computational model is used to examine the regulation of ROS and calcium homeostasis by local, subcellular X-ROS signaling and its role in cardiac excitation-contraction coupling. To this end, a four-state RyR2 model was developed that includes an X-ROS-dependent RyR2 mode switch. When activated, [Ca2+]i-sensitive RyR2 open probability increases, and the Ca2+ spark rate changes in a manner consistent with experimental observations. This, to our knowledge, new model is used to study the transient effects of diastolic stretching and subsequent ROS production on RyR2 open probability, Ca2+ sparks, and the myoplasmic calcium concentration ([Ca2+]i) during excitation-contraction coupling. The model yields several predictions: 1) [ROS] is produced locally near the RyR2 complex during X-ROS signaling and increases by an order of magnitude more than the global ROS signal during myocyte stretching; 2) X-ROS activation just before the action potential, corresponding to ventricular filling during diastole, increases the magnitude of the Ca2+ transient; 3) during prolonged stretching, the X-ROS-induced increase in Ca2+ spark rate is transient, so that long-sustained stretching does not significantly increase sarcoplasmic reticulum Ca2+ leak; and 4) when the chemical reducing capacity of the cell is decreased, activation of X-ROS signaling increases sarcoplasmic reticulum Ca2+ leak and contributes to global oxidative stress, thereby increases the possibility of arrhythmia. The model provides quantitative information not currently obtainable through experimental means and thus provides a framework for future X-ROS signaling experiments.
Introduction
Reactive oxygen species (ROS) are oxygen-derived molecules that play a significant role in physiological processes. ROS are involved in cellular signaling by mediating the posttranslational modifications of various proteins, commonly through oxidation of sulfhydryl (SH) groups in cysteine residues (1, 2). Lipid bilayer studies incorporating sarcoplasmic reticulum (SR) vesicles have focused on sulfhydryl oxidation of the ryanodine receptor 2 (RyR2) channel complex (3, 4). This ROS-induced sensitization of RyR2 increases [Ca2+]i sensitivity, increasing RyR2 open probability (Po) and hence the frequency of Ca2+ sparks (5).
Modulation of RyR2 activity by redox active compounds depends on the type and concentration of these compounds. The overall concentration of oxidizing and reducing agents in a cell determines the intracellular redox potential of the cell (4, 6). At low concentrations, the redox active compounds are capable of reversibly oxidizing the RyR2s (or any other targets) to tune their function. However, at larger concentrations, these compounds can activate RyR2s irreversibly (3, 7), resulting in increased Ca2+ sensitivity and hyperactivity of RyR2 channels. This increases Ca2+ leak and decreases SR Ca2+ content, resulting in diminished SR Ca2+ release and weakened muscle contraction during systole. Under some conditions, these same events may increase the risk of arrhythmia. Oxidative stress (OS) can thus lead to pathological conditions such as systolic dysfunction, arrhythmia, and heart failure (HF) (8). In the event of pathological conditions such as HF, a decrease in the ratio of reduced to oxidized glutathione elevates cytosolic ROS levels, thus increasing the redox modification of RyR2 channels, resulting in enhanced SR Ca2+ leak (9).
In the working heart, diastolic stretching of ventricular cardiac myocytes occurs with every heartbeat as the ventricles fill with blood. This cellular extension activates membrane-bound nicotinamide adenine dinucleotide phosphate (NADPH) oxidase type 2 (Nox2)-dependent ROS production in a process that depends on the microtubule cytoskeleton. These elements lead to a burst of elevated ROS in the dyadic subspace in a process termed X-ROS signaling. The dyadic subspace is the microdomain created at the Z-line bounded by the junctional SR and transverse tubule (T-tubule) membranes. The locally elevated ROS increases the sensitivity of RyR2s to [Ca2+]i, thus triggering a burst of diastolic Ca2+ sparks, rapid Ca2+ release events from the SR (10, 11). N-acetylcysteine (NAC), an antioxidant that scavenges ROS and reactive nitrogen species (RNS), as well as diphenyleneiodonium (DPI) and gp91ds-tat, both Nox2 inhibitors, all block the stretch-induced burst of Ca2+ sparks, identifying Nox2 as the source of ROS (11, 12). Stretching the cardiomyocytes of a mouse model of Duchenne muscular dystrophy (the mdx mouse) reveals that such stretch-induced ROS production can result in arrhythmogenic Ca2+ waves. Of note, a similar X-ROS mechanism has been identified in skeletal muscle, but with important and distinctive differences (13).
To examine our understanding of X-ROS signaling and explore how it might play a role in cellular physiology and pathophysiology, a computational model of excitation-contraction (EC) coupling and Ca2+ signaling in the heart was created that included stretch-induced X-ROS signaling. In this model, RyR2 SR Ca2+ release channels could be reversibly activated by local ROS and depended on the cytosolic redox state. This model simulates the experimentally observed stretch-induced ROS production and the sudden burst of Ca2+ sparks upon stretching. The kinetics of the process is consistent with the hypothesized local reversible ROS signaling. Furthermore, the model demonstrates how X-ROS signaling may lead to altered local Ca2+ signaling and OS during changes in cellular redox status. This model accounts for Ca2+ signaling changes that are attributed to X-ROS signaling in the heart.
Materials and Methods
The model
A new Ca2+-spark-based model of EC coupling in cardiac ventricular myocytes has been developed to include X-ROS signaling. To this end, the rat ventricular myocyte model for EC coupling used in Wagner et al. (14) is extended to include a description of X-ROS signaling. The model (Fig. 1) includes 20,000 calcium release units (CRUs), each containing 49 stochastically gating RyR2s and seven stochastically gating L-type Ca2+ channels (LCCs) interacting via the dyadic-subspace [Ca2+] ([Ca2+]ds). The dyadic subspaces equilibrate by diffusion with a myoplasmic [Ca2+] ([Ca2+]i) compartment. The opening rate of the Ca2+-gated RyR2 homotetramer is sensitive to both the [Ca2+]ds and the junctional SR (JSR) luminal [Ca2+] ([Ca2+]JSR). During diastole, the LCCs are normally closed and Ca2+ release from the JSR RyR2s is initialized by the probabilistic openings of RyR2s themselves. During systole, Ca2+ release via opening of the RyR2 channels is initiated by the rise in the subspace Ca2+ entering due to the opening of one or more voltage-gated LCCs. Once Ca2+ release in a CRU is initiated, then the nature of a Ca2+ spark is similar whether the release was initiated in diastole or systole. Inclusion of X-ROS signaling requires the development of an RyR2 model that describes the action of ROS on RyR2 open probability. Therefore, we developed, to our knowledge, a novel four-state model consisting of the closed state (C1) and the open state (O1) in mode 1, and a new closed state (C2) and open state (O2) in mode 2. The conducting levels at states O1 and O2 are the same. At basal ROS levels, the RyR2s mostly function in mode 1 and are similar to the two-state Markov chain developed by Williams et al. (15) (Fig. 2, Mode 1). On the other hand, in the presence of stretch-induced ROS production, the RyR2s have a higher possibility of being oxidized by ROS and switching to mode 2 (Fig. 2). In mode 2, the transition probability from closed state C2 to open state O2 is higher than the mode 1 transition probability from closed state C1 to open state O1. In the presence of ROS, the overall lifetime of channels in the open state increases and that in the closed state decreases, as observed by Boraso et al. (5). Hence, for mode 2, the association rate constant (k1+) is increased and the dissociation rate constant (k1−) is decreased compared to mode 1. The function φ (= φm[Ca2+]JSR + φb), describing the effect of luminal Ca2+ on opening, and the dependence term η, describing the positive feedback of [Ca2+]ds, remain unchanged for the two modes. The probability of transition of an RyR2 from mode 1 to mode 2 (from C1 to C2) depends upon the rate constant for oxidation by [ROS]ds (k2+) (16) and the dependence on [ROS]ds, β. The transition probability from mode 2 to mode 1 is dependent on the reduction rate constant (k2−). This rate falls in the experimental range for the oxidation of thiols (16) and is further constrained to give appropriate activation and deactivation dynamics to match experimental results by Prosser et al. (11).
Figure 1.

Schematic of the calcium handling model. ROS are produced by Nox2 at the Ca2+ release site as a result of stretching. Only one of the 20,000 Ca2+ release units is shown. Purple circles indicate calcium ions (Ca2+). NCX, Na+-Ca2+ exchanger; PMCA, plasmalemmal Ca2+-ATPase; INa, sodium current; Ito, transient outward potassium current; IK1, potassium current; LCC, L-type Ca2+ current; RYR2, ryanodine receptor channel; ROS, reactive oxygen species; Nox2, NADPH oxidase type 2; CSQ, calsequestrin; JSR, junctional SR; NSR, network SR; CaM, calmodulin; GSH, reduced glutathione. To see this figure in color, go online.
Figure 2.

The four-state mode-switching model of a single RyR2. The RyR2 channels assume mode 1 in the absence of ROS. Elevation of ROS causes a fraction of the channels to switch from mode 1 to mode 2, which displays a higher open probability due to an increased opening rate and decreased closing rate. C1, closed-state mode 1; O1, open-state mode 1; C2, closed-state mode 2; O2, open-state mode 2; , SR luminal dependence function; k1+, association rate constant; k1−, dissociation rate constant; k2+, oxidizing rate constant; k2−, reduction rate constant; η, cooperativity of activating Ca2+ binding to RyR2.
Modeling methods
The ordinary differential equations for Ca2+ dynamics calculations are the same N = 20,000 equations representing the Markov chain Monte Carlo model described by Williams et al. (15). During diastolic stretching, it is assumed that ROS is produced at the membranes of each release site equally. The ordinary differential equations for calculating the ROS concentration in the kth dyadic subspace and the myoplasm are given by Eqs. 1 and 2.
ROS in subspace is described by the differential equation
| (1) |
and ROS in myoplasm is described by the differential equation
| (2) |
where is the fraction of myoplasmic volume for the dyadic subspace, is the total dyadic subspace volume, and Vds = . The index k is any one of the subspace (1 ≤ k ≤ N). The flux of ROS from the kth subspace to the bulk myoplasm is given by
| (3) |
The total flux of ROS from N dyadic subspace to the myoplasm is given by
| (4) |
where is the rate of total ROS efflux out of the subspace.
Because it is assumed that each subspace releases the same amount of ROS, the above equation becomes
| (5) |
The amount of ROS removed from each subspace is given by
| (6) |
The amount of ROS removed from the bulk myoplasm is given by
| (7) |
where is the rate of ROS removal and is the base (steady-state) ROS concentration in the myoplasm. The relative concentration of the reduced form of glutathione is (GSH) = 1 under normal physiological conditions, i.e., without OS.
When stretched, the actual amount of ROS produced by Nox2 in each subspace (see Fig. 4 C) is given by a set of four time-dependent equations:
-
1)
-
2)
= .000036(t2) − .000122(t) + .000214 tStr ≤ t < 1.5 s
-
3)
= .000001(t2) − .0000152(t) + .0001326716 1.5 s ≤ t < 4 s
-
4)
= .0001259488(exp–.09t) t ≥ 4 s,
where is the rate of stretch-induced ROS production just before the stretching is done (= at the time of stretching) and is equal to 0 s−1 in the resting condition, and is the time taken to reach peak stretching. The coefficients and order of the equations were selected such that the outcome would resemble the trend of the ROS production rate obtained experimentally by Prosser et al. (11). The case when myocyte length is returned to normal is referred to here as release of stretch. If time_after_release ≤ (the time taken for stretch-induced ROS production to cease after the release of stretch), then
-
5)
where is the rate of ROS production just before the release of stretch is done (= at the time of release of stretch).
Figure 4.

ROS dynamics during the stretching protocol used in Fig. 3. (A) Concentration of ROS in the myoplasm ([ROS]i). (B) Concentration of ROS in the dyadic subspace ([ROS]ds) compared to [ROS]i. (C) ROS production flux. (D) Rate of ROS activation of DCF. (E) Total concentration of activated DCF. The myocyte is stretched continuously from 10 to 20 s. (F) The rate of ROS production is adaptive (blue) rather than constant (red). Black dashed lines in (E) and (F) show experimental data from Prosser et al. (11). To see this figure in color, go online.
The rate of ROS production is observed experimentally using 2′,7′-dichlorofluorescein (DCF) fluorescence, which is activated by ROS. The model describes the activation of DCF in the subspace and myoplasm by the fluxes into the activated state as
| (9) |
| (10) |
where is the rate of DCF activation by ROS.
The total concentration of ROS-activated DCF is thus given by
| (11) |
Constraining the model: Ca2+ dynamics
The newly developed EC coupling model for rat ventricular cardiac myocytes is able to produce Ca2+ spark frequency results similar to the experimental results reported by Prosser et al. (11). When a cell is stretched for a continuous 10 s period from a resting slack length of ∼1.8 μm sarcomere spacing to a longer length, the number of Ca2+ sparks increases rapidly by about twofold and then drops gradually during the 10 s of sustained stretching (Fig. 3 A). The Ca2+ spark frequency drops by ∼25% by the end of the 10 s period of stretching and then rapidly drops to its prestretched level within a second of its return to its control length.
Figure 3.

Simulation results using the four-state ventricular cardiac myocyte model (n = 50 simulations) (A) Ca2+ spark histograms for 1 s bins. Black solid circles show the experimental data from Prosser et al. (11). (B) Myoplasmic Ca2+ concentration ([Ca2+]i). (C) Network SR Ca2+ concentration ([Ca2+]NSR). The myocyte is stretched continuously from 10 to 20 s, displaying a transient increase in the Ca2+ spark rate. To see this figure in color, go online.
With the increase in the Ca2+ spark rate during stretching, the model exhibits a small transient rise in [Ca2+]i and a correspondingly small decrease in the network SR (NSR) [Ca2+] ([Ca2+]NSR), as seen in Fig. 3, B and C, respectively. These findings, although clearly demanded by mass action, are seen quantitatively here. The spark rate drops gradually during the 10 s of sustained stretching, mainly due to the gradual drop in ROS concentration. The NSR Ca2+ concentration does play a small role, as demonstrated in Fig. 3, A and C, by comparing the values both pre- and poststretching. There is a small decline in spark rate poststretch (Fig. 3 A) due to the slightly lower NSR Ca2+ concentration (Fig. 3 C).
Constraining the model: ROS dynamics
The basal steady-state [ROS] used in the model is assumed to be 10 nM, which is similar to the physiological level of H2O2 estimated from experiments (≤20 nM) (16, 17). In the simulations, only 50% of the myocyte was considered during stretching and release of stretch protocols to be consistent with experiments that only stretch a portion of the myocyte. The volumes and model components have been scaled to reflect this. The bulk myoplasmic [ROS] ([ROS]i) is estimated to peak at 0.6 μM during the sustained stretching (Fig. 4 A). This estimation is consistent with Barbieri et al. (18), where it is stated that ROS generation increases from 50- to 100-fold during skeletal muscle contraction. The dyadic subspace transients ([ROS]ds) are predicted to be 10-fold higher than the myoplasmic values ([ROS]i) with faster rising and falling kinetics (Fig. 4 B). The shape of the time-dependent [ROS]ds closely follows the ROS production flux due to the small size of the subspace (Fig. 4 C).
Experimental estimation of myoplasmic ROS concentration measured using DCF fluorescence is simulated using Eqs. 10 and 11 and shown in Fig. 4, D and E, respectively, as the concentration of ROS-activated DCF. The calculated value of the total ROS-activated DCF is similar in appearance to the actual experimentally measured DCF fluorescence (11). This can be thought of as simulated fluorescence. The rate of rise of ROS-activated DCF is adaptive rather than constant, as seen by the slightly better r2 value. This is supported further by the experiments with sustained stretch, which show that the ROS production returns to normal levels if the stretch is sufficiently prolonged (12). For this reason, the model assumes that the ROS production rate decreases with prolonged stretch (Fig. 4 F, blue). Fig. 4 F (red) shows the consequence of a constant rate of ROS production. The fit to the data for the adaptive production is slightly better than that of a constant rate of ROS production. The assumption that ROS production occurs primarily in release sites allows the generation of a significant increase in local ROS concentration that can sensitize the RyR2s, resulting in increased open probability (see Fig. 6, below). This assumption allows ROS to rise locally near the RyR2s while keeping cellular ROS concentrations below the presumably toxicologically significant levels of >10 μM (19).
Figure 6.

Simulations demonstrating the consequences of global ROS release. (A) Concentration of ROS in the myoplasm ([ROS]i). (B) Concentration of ROS in the subspace ([ROS]ds). (C) The resulting spark frequency for n = 20 simulations. To see this figure in color, go online.
Selection of parameters
The values of the parameters are specified in Table 1 along with reference to their sources. Model parameters were selected within the following constraints: 1) the model output should match published experimental results; 2) parameters should fall within the range of experimentally determined values; or 3) parameters should be derived from experimental observation. The parameter adjustments were made by hand to obtain simulation results in agreement with experimental data. The parameters for the opening rate (k+), closing rates (k−), subspace volume , and myocyte volume come from our previously published spark model, which was constrained by experimental observations (14, 15). This constrains the parameters for mode 1. Parameters for ROS regulation of the RyR2, i.e., mode 2, were constrained from bilayer experiments that indicated that the channel open dwell time increased twofold in the presence of H2O2, whereas the closed dwell time decreased (5). This indicates that the closing rate in the ROS oxidized state (k1−) should be half that in the nonoxidized state (k−), whereas the opening rate (k1+) should be increased over k+.
Table 1.
Parameters
| Parameter | Definition | Value | Reference |
|---|---|---|---|
| association rate constant for RyR2 and Ca2+ in mode2 | 24 μM−η s−1 | (5) | |
| dissociation rate constant for RyR2 and Ca2+ in mode2 | 250 s−1 | (5) | |
| oxidizing rate constant of RyR2 by ROS | 1 μM−β s−1 | (16) | |
| reducing rate constant of RyR2 | 14 s−1 | (11) | |
| β | dependence of RyR2 oxidation by ROS | 0.4 | (11) |
| total subspace volume | 0.027 pL | (14, 15) | |
| myoplasmic volume | 18 pL | (15) | |
| total rate of ROS efflux out of subspace | 0.3125 s−1 | (11) | |
| rate of ROS removal | 2 s−1 | (11) | |
| time taken for stretch-induced ROS production to cease after release of stretch | 0.6 s | (11) | |
| rate of DCF activation by ROS | 0.85 s−1 | (11) |
The rate of transition from mode 1 to the ROS-oxidized mode 2 is not well constrained by experimental measurements of thiol oxidation, which have been reported to be in the range 10–106 M−1 s−1 (16). Therefore, this transition rate (k2+) is selected in this range and constrained further, along with k2− and β, so that the response to stretching and recovery from stretch response of the spark rate matches the experimental observations (11).
The parameters governing ROS dynamics are , , , and . These parameters were adjusted such that the DCF activation rate in Fig. 4 D would closely match the derivative of the experimental DCF fit in Prosser et al. (11), as shown in Fig. 4 E.
When constraining model parameters to match X-ROS experiments simulated in Fig. 3 A, certain features were emphasized, such as the increase in spark rate with the onset of stretching, the decline of the spark rate during stretch, and the recovery of the spark rate after the relaxation of stretch. In Fig. 3 A, the data are separated into bins. The last bin before stretching is bin 10 and the first bin during the period of stretching is bin 11. Thus, the amount of spark rate increase by stretching can be quantified as the ratio of the value of bin 11 to that of bin 10, which serves as the first output quantity calculated in the control coefficients. The ratio of bin 11 to bin 20, which demonstrates the decline of spark rate during stretching, is the second output quantity. The third output quantity is the ratio of bin 20 to bin 21, which shows the ratio of the last bin during stretching compared to the first bin after stretching ends. This demonstrates the recovery of spark rate from stretching. Fig. 5 demonstrates the sensitivity of the model by showing the changes in these three model-output responses when the parameters β (dark blue), k1+ (light blue), k1− (fuchsia), k2+ (tan), and k2− (brown) were each increased by 10% individually. The ratio of the change in output response to the change in the parameter (control coefficient = ΔJ/Δp = [{change in output}/{change in parameter}]) yields the control coefficients, which are shown graphically. The numerical values of the control coefficients are also shown in Table 2. The calculations of the control coefficients show that the increase in spark rate due to stretching is most sensitive to changes in β, but also very sensitive to k2−, the transition rate from mode 2 to mode 1 (Fig. 5, 11/10). The decline in spark rate during stretching is most sensitive to β (Fig. 5, 11/20). The recovery from stretching is most sensitive to k2−, the transition rate from mode 2 to mode 1 (Fig. 5, 20/21).
Figure 5.
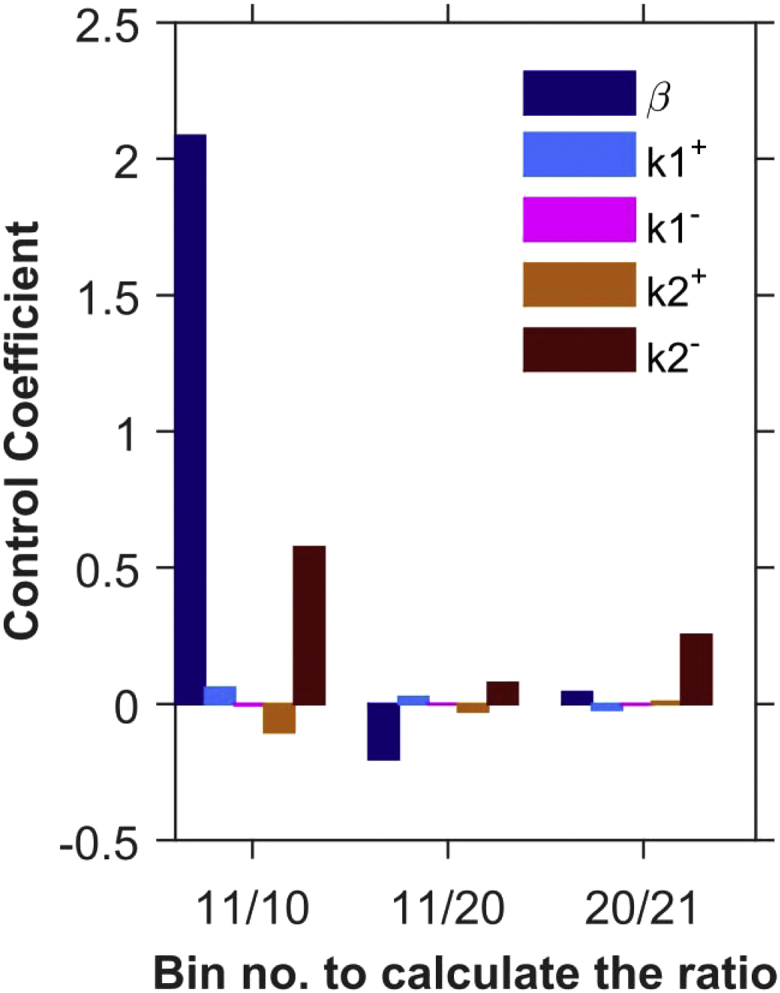
Control coefficients for uncertainty analysis of parameters β, k1+, k1−, k2+, and k2− (n = 20 simulations). The parameters were varied by 10%. Control coefficient = d(output)/d(parameter) = (output ratioi − output ratioc)/(increased parameteri – control parameterc); output ratioi = spark-count ratio of xth to yth bins for the increased parameter; output ratioc = spark-count ratio of xth to yth bins for the control parameter, where x/y = 11/10 (activation by stretch), 11/20 (decline during stretch), and 20/21 (recovery after end of stretch). To see this figure in color, go online.
Table 2.
Control coefficients
| Bin/Bin Spark-Count Ratio | Control Coefficients for 10% Increase in the Parameters |
||||
|---|---|---|---|---|---|
| β | k1+ | k1− | k2+ | k2− | |
| 11/10 | 2.085 | 0.059 | −0.005 | −0.105 | 0.575 |
| 11/20 | −0.203 | 0.025 | −0.001 | −0.027 | 0.077 |
| 20/21 | 0.043 | −0.022 | −0.003 | 0.007 | 0.252 |
Results
The model of X-ROS signaling described above was developed and shown to simulate experimentally observed X-ROS signaling in the context of normal cellular and subcellular Ca2+ signaling. In addition, this, to our knowledge, new X-ROS model was designed to provide insight by carrying out model-dependent experiments that could not yet be done with single cells. Thus, simulations were performed to suggest the physiological significance of X-ROS signaling beyond that which is directly measurable experimentally and to gain insight into how X-ROS signaling may be altered in disease states and may contribute to pathology.
Mechanisms of X-ROS signaling
The simulation results shown in Figs. 3 and 4 assume that ROS is produced locally in the membranes of subspace. To test this assumption, the next set of simulations explores the consequences of global ROS production during stretch, i.e., at sarcolemmal and T-tubular membranes everywhere in the cell. In the case of localized ROS release, when a cardiomyocyte is stretched, the concentration of subspace ROS ([ROS]ds) (Fig. 3 A) sharply increases due to rapid ROS production during the process of stretching (first few milliseconds), but the decrease is also sharp initially due to the decrease in the ROS production rate (after the stretching is done and the myocyte is held at a constant length), as well as to the ROS efflux from the subspace toward the bulk myoplasm contributing to the myoplasmic ROS ([ROS]i) (Fig. 3 B). This sharp increase and decline of [ROS]ds makes the sudden twofold increase of spark rate within 0–1 s of the stretch possible while making sure that, similar to the experimental results, the spark frequency does not increase even more during the 1–2 or 2–3 s after stretching (Fig. 3 A, solid circles). In the case of global ROS release, the stretching results in the same ROS production pattern in both the subspace and the myoplasm (Fig. 6, A and B). Hence, there is no significant net efflux of ROS to or from the subspace, which is why the [ROS]ds and [ROS]i are consistent over time. This reduces the rate of decline in the [ROS]ds and results in higher spark frequency during the 1–2 s compared to the 0–1 s after stretching. Hence, simulations with local ROS production better captured this aspect of the experimental results than did the simulations with global ROS production. Therefore, the model favors the hypothesis that ROS signaling during stretching likely occurs locally in or near the dyad.
The model assumes that ROS oxidation of the RyR2s is a reversible process. To test this assumption, simulations were performed that assumed that the oxidation of RyR2s by ROS was irreversible, i.e., that the switch from mode 1 to mode 2 in the model was irreversible. With X-ROS signaling irreversibly oxidizing the RyR2s, the spark frequency increases abruptly (Fig. 7 A) as the number of channels in mode 2 goes from 1.1% to 85% within 1 s of stretching and to 97% within 2 s of stretching (data not shown here). The number of channels in mode 2 continues to increase until all the channels are oxidized, but due to the depletion of SR Ca2+ ([Ca2+]NSR), the spark frequency gradually goes to a steady-state value and does not change even when the myocyte is released from stretch (Fig. 7 B). Had the oxidation always been irreversible, even at the nanomolar concentration of ROS (resting condition), then the average spark frequency would have been much higher with all the RyR2s in mode 2 (Fig. 7 C). The stretch-induced X-ROS signaling would have no effect on the spark frequency. These results suggest that X-ROS signaling does not cause irreversible oxidation, because irreversible oxidation should result in no change in spark frequency when the myocyte is released from stretch after 10 s of continuous stretching.
Figure 7.

Simulations demonstrating the consequences of irreversible oxidation of RyR2s. (A) Ca2+ spark frequency when stretch-induced ROS results in irreversible oxidization of RyR2s. (B) The sudden increase in Ca2+ spark frequency after stretching depletes the [Ca2+]NSR, which stabilizes at a new steady-state value. (C) The Ca2+ spark frequency when ROS is at resting level results in irreversible oxidization of RyR2s so that almost all RyR2s switch to mode 2 with time so that stretching has no effect on spark rate. n = 20 simulations. To see this figure in color, go online.
As an additional test of the model, simulation data were compared to experiments other than those used to constrain model parameters. The first set of experiments test how the model responds to prolonged stretch. The experimental Ca2+ spark counts in Fig. 5 B of Prosser et al. were normalized to the minimum and maximum Ca2+ spark count of the simulation results so that the comparisons would be more illustrative (12). As seen in Fig. 8 A, the simulation results in the return of spark rate to its prestretch value, as does the experimental spark rate, and the average spark rate remains the same poststretching.
Figure 8.
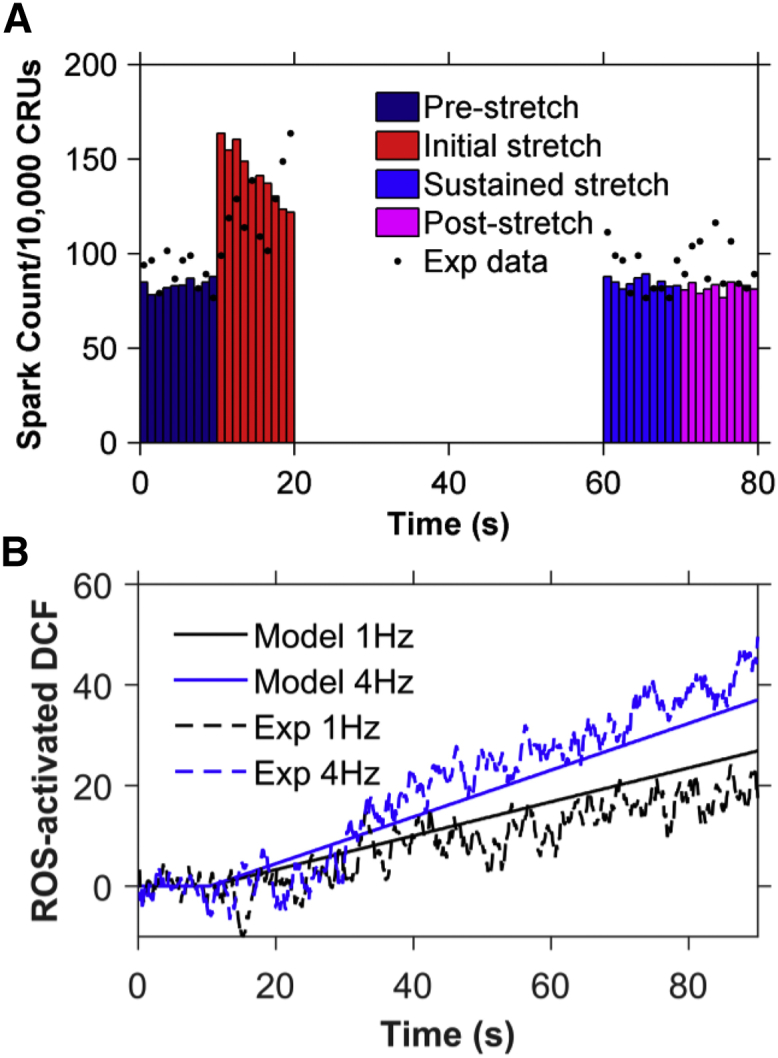
Comparison of simulation results modeled for 8% stretch (11) to experimental results for 10% stretch (12). Experimental data were normalized to the model data to compensate for the difference in the amount of stretch. (A) Ca2+ spark histograms for 1 s bins when the model is simulated for 80 s and the myocyte is stretched from 10 to 70 s (n = 11 simulations). The spark frequency returns to its prestretch value during the last 10 s of stretching, as seen in the experimental data, represented by black dots. (B) Comparison of simulated values (solid lines) to experimental values (dashed lines) of the total concentration of activated DCF at 1 Hz (black) and 4 Hz (blue) of cyclic stretching from 10 to 90 s. To see this figure in color, go online.
The second set of simulations explores how ROS levels increase with cyclic stretch. The normalized experimental DCF values in Fig. 2 C of Prosser et al. (12) compare well with experimental values over 90 s simulation time at 1 Hz and 4 Hz (Fig. 8 B). This demonstrates that X-ROS signaling is enhanced and graded by the frequency of stretch, as the DCF concentration is elevated at 4 Hz in comparison to 1 Hz. Furthermore, it suggests that the ROS dynamics are in agreement with experimental results. These two results indicate that the model can simulate experiments not used to constrain the model.
Physiological implication of X-ROS signaling
In the beating heart, ventricular cardiac myocytes undergo regular (rhythmic) contractions and relaxations. Accompanying each contraction cycle is a period of stretching (diastolic filling) and shortening (pumping) separated by isometric force increase and isometric relaxation. Given that stretching affects Ca2+ spark dynamics in ventricular myocytes, the next three series of numerical experiments seek to understand what impact the contraction cycle may have on X-ROS signaling. To understand how the stretching of ventricular myocytes can have an impact on ROS dynamics and subsequent Ca2+ dynamics, alternating equal periods of stretching and release of stretch were applied at 1 Hz, 2 Hz, and 4 Hz starting from the resting unstretched condition (Fig. 5). During this process, [ROS]ds and [ROS]i were calculated as a function of time. No periods of isometric force or relaxation were applied.
Oscillation of [ROS]ds and [ROS]i were observed. At 1 Hz frequency, the subspace ROS oscillates between 1.43 μM and 6.84 μM and the myoplasmic ROS oscillates between 515 nM and 734 nM (Fig. 9 A). At 2 Hz frequency, the subspace ROS oscillates between 4.25 μM and 7.08 μM and the myoplasmic ROS between 770 nM and 831 nM (Fig. 9 B). At 4 Hz frequency, the subspace ROS oscillates between 5.92 μM and 7.2 μM and the myoplasmic ROS oscillates between 889 nM and 903 nM (Fig. 9 C). Although the sustained elevation of [ROS]i during cyclic stretching and release of stretch has been demonstrated experimentally (12), neither calibration of the concentration nor oscillations of the signal could be measured.
Figure 9.

Subspace and myoplasmic ROS concentration are elevated when the ventricular cardiac myocyte is cyclically stretched with equal periods of stretching and release of stretch from 10 to 30 s at (A) 1 Hz, (B) 2 Hz, and (C) 4 Hz. To see this figure in color, go online.
The higher ROS concentration in the subspace is thought to oxidize protein targets. In this model, we focused on changes in RyR2 [Ca2+]i sensitivity only as described in the presentation of the model. This increased sensitivity of RyR2 led to the increase in Ca2+ spark frequency (Fig. 10 A) and the resting [Ca2+]i (Fig. 10 B). The Ca2+ spark frequency and [Ca2+]i increase further as the frequency increases from 1 to 2 Hz, with little additional change as frequency increases even more to 4 Hz. This is due to the increase in the fraction of channels (FoC) in mode 2 (M2) with the increase in stretching-release of stretch frequency (Fig. 10 D).
Figure 10.

Analysis of Ca2+ dynamics for the protocol from Fig. 9 reveal that the small variations in spark rate lead to fluctuations in myoplasmic calcium that are governed by the fraction of channels in mode 2. (A) Ca2+-spark count. (B) [Ca2+]i. (C) [Ca2+]NSR. (D) Fraction of channels (FoC) in mode 2 (M2) when stretched (from 10 to 30 s) at 1 Hz, 2 Hz, and 4 Hz (n = 20 simulations). The myocyte is stretched and released from stretch continuously from 10 to 30 s. The beats before 10 s show the response without stretching. If the ROS-induced activation of RyRs were not present, this level of sparks would persist regardless of stretching. To see this figure in color, go online.
We also used the model to study the details of a more physiological sequence of numerical experiments. In this case, the myocyte is stretched before an electrical depolarization produces an action potential (AP) that initiates EC coupling and the [Ca2+]i transient. The heart rate was set to 1 Hz. Before each AP, the ventricular cardiac myocyte was stretched for 200 ms to mimic diastolic filling starting at one of the following times: 1) 0 ms (i.e., from 0 to 200 ms), 2) 200 ms (i.e., from −200 to 0 ms), 3) 400 ms (i.e., from −400 to −200 ms), 4) 600 ms (i.e., from −600 to −400 ms), and 5) 800 ms (i.e., from −800 to −600 ms), where 0 is the time of application of the stimulus for the AP. The results of these five different simulation cases, along with the result for control myocytes (that have not been stretched), were compared. We observed that the peak value of [Ca2+]i (Fig. 11 A) and the peak value of RyR2 Po (not shown) were maximal when the myocyte was stretched 200 ms before the application of stimulus. In this situation, the stimulus occurs when the ROS concentration is highest. As a result, the [Ca2+]NSR is depleted most as well (Fig. 7 B). There is also a decline of the peak [Ca2+]i and [Ca2+]NSR with each successive beat (Fig. 11).
Figure 11.

Simulations of a 200 ms period of stretching at different points during the cardiac cycle at 1 Hz pacing during beats 11–30. Electrical stimulation occurs at 0 ms. (A and B) Comparison of maximum values reached by (A) [Ca2+]i and (B) [Ca2+]NSR at each beat while the ventricular cardiac myocyte is stretched from 0 to 200 ms, −200 to 0 ms, −400 to −200) ms, −600 to −400 ms, and −800 to −600 ms from the time point of application of stimulus. The stretching protocol is shown in Fig. S1. A maximal increase in peak Ca2+ transient amplitude is observed when the stretching immediately precedes electrical excitation (−200 to 0 ms). (C) Decline of the peak Ca2+ seen in (A) with the continuing heartbeat during stretching requires reduction of the SR Ca2+ content. The protocol for −200 to 0 ms (cyan bars) was used with [Ca2+]NSR held constant. When [Ca2+]NSR is constant, the corresponding peak [Ca2+]i is also constant. To see this figure in color, go online.
The peak [Ca2+]i decreases with the heartbeat number in each of the five simulations (see, for example, Fig. 11 A). To ascertain whether depletion of [Ca2+]NSR is the underlying cause for this decrease of peak [Ca2+]i as the heartbeat continues, similar simulations with constant [Ca2+]NSR were performed (Fig. 11 C) for stretching of the myocyte 200 ms before the application of stimulus. The result clearly shows that with constant [Ca2+]NSR, the resulting peak [Ca2+]i does not decrease with the heartbeat number.
To gain further insight into X-ROS signaling, the stimulation protocol used in Fig. 11 was repeated and a 10 s period of stretching was imposed from stimulation 11 through stimulation 20. The stretching occurred 200 ms before the 11th stimulation. The peak RyR2 Po increased abruptly with the 11th stimulation and then declined gradually (Fig. 12 A). The peak [Ca2+]i transient followed the same time course (Fig. 12 B). This demonstrates that with an abrupt increase of ROS production, EC coupling is affected as the RyR2 Po increases and the [Ca2+]i also transiently increases. The peak Po of the Ca2+ channels increases due to the increase in the fraction of channels in mode 2, and this leads to an increase in the fraction of channels in the open state of mode 2 (O2) (Fig. 12 D).
Figure 12.

Continuous stretching of cells from 10 to 20 s displays a transient increase in peak [Ca2+]i followed by a recovery toward control. This is caused by an increase in Po followed by a decline in both Po and SR Ca2+ load. The opposite is seen during release of stretch. (A–C) Peak Po (A), peak [Ca2+]i (B), and peak [Ca2+]NSR (C) at each beat while the ventricular cardiac myocyte is stretched (beats 11–20) (red bars) and not stretched (black bars). (D) Detailed breakdown of peak Po in (A) into the fractions of channels in O1 and in O2. To see this figure in color, go online.
Oxidative stress
OS is the condition where the concentration of ROS overwhelms the chemical reducing power of the myocyte. This can occur either through increased ROS production or through a decreased reducing capacity of the myocyte. To study the effect of sustained OS in the myocyte, simulations were carried out with a decreased concentration of the primary cellular reducing biochemical, glutathione. Reduced glutathione (GSH) is estimated experimentally to be present in the rat ventricular myocytes at a concentration of 1–10 mM (20, 21). Given this variability, we chose to report the fraction of GSH. In the simulation, the GSH was reduced to 50% and 10% of the control level, as can occur in disease states (22, 23) (see Eqs. 6 and 7). Fig. 13 A shows that with decreases in GSH, there is an increase in the Ca2+ spark rate during both stretching and release of stretch. Furthermore, the recovery of Ca2+ spark rate after stretching is slowed when GSH decreases. This results in increased [Ca2+]i both at rest and during stretching (Fig. 13 B) and decreased [Ca2+]NSR (Fig. 13 C) as a result of the increased SR Ca2+ leak.
Figure 13.

Decreasing the reducing capacity by lowering GSH leads to increased spark activity and Ca2+ mobilization during stretching from 10 to 20 s. Shown are traces for the [GSH]/[GSH]control ratio assuming values of 1 (black) (control), 0.5 (red), and 0.1 (blue). Comparison of (A) Ca2+-spark count, (B) [Ca2+]i, and (C) [Ca2+]NSR. To see this figure in color, go online.
Furthermore, when the myocyte is acutely stretched 200 ms before each beat, the decrease in GSH results in a slight increase in RyR2 Po (Fig. 14 A) and peak [Ca2+]i (Fig. 14 B) due to an increase in the fraction of channels in mode 2 (Fig. 14 C). However, the peak Po and peak [Ca2+]i decrease with heartbeat number (Fig. 14, A and B) due to the accompanying decrease in [Ca2+]NSR (Fig. 14 D). This is attributable to increased [ROS]ds and [ROS]i (Fig. 14, E and F). Thus, the model illustrates how a large decrease in the reducing capacity of the cell could dramatically elevate global ROS concentrations during X-ROS signaling, possibly to damaging levels, leading to the progression of pathological conditions.
Figure 14.

Lowering of the reducing capacity (GSH ratio) from Fig. 13 during 1 Hz pacing with myocyte stretching for 200 ms before each stimulus leads to increased [ROS] and increased Ca2+ release. (A–D) Comparison of (A) peak Po, (B) peak [Ca2+]i, (C) the corresponding fraction of channels (FoC) in mode 2 (open, closed, and inactivated), and (D) peak [Ca2+]NSR at each beat. (E and F) Presence of (E) [ROS]ds and (F) [ROS]i in the myocyte due to cyclic stretching and release of stretch. To see this figure in color, go online.
Discussion
The computational model presented here suggests the underlying mechanisms of regulation of EC coupling by ROS and predicts both physiological and pathophysiological roles of X-ROS signaling. Experiments indicate that stretching a cardiac myocyte triggers ROS production from Nox2, which is localized to the sarcolemmal and T-tubule membranes. The model suggests the following four predictions: 1) X-ROS signaling is local: [ROS] is produced locally near the RyR2 complex during X-ROS signaling and increases by an order of magnitude more than the global ROS signal during myocyte stretching; 2) X-ROS enhances EC coupling: X-ROS activation just before the AP, which could correspond to ventricular filling, optimally increases the magnitude of the Ca2+ transient; 3) X-ROS signaling is attenuated during prolonged stretch: during prolonged stretching, the X-ROS-induced increase in spark rate is attenuated so that sustained stretching alone no longer significantly increases SR Ca2+ leak; and 4) OS affects X-ROS signaling during disease: when the chemical reducing capacity of the cell is decreased, X-ROS signaling increases SR Ca2+ leak and global OS, thereby increasing the possibility of arrhythmia.
Local ROS signaling
The model suggests that this raises local ROS in the dyadic subspace significantly and hence affects the nearby RyR2s by increasing the opening rate of these channels. ROS currently cannot be imaged with the precision needed to identify local domains. We have performed simulations in which X-ROS signaling occurs either locally in the dyad or globally. The simulations with local X-ROS signaling simulate experimental data effectively. However, simulations with global ROS production failed to simulate experimental data adequately. This suggests that X-ROS signaling occurs locally. The implications of highly localized signaling of X-ROS are that it enables the ROS-dependent modulation of RyR2s while maintaining myoplasmic [ROS] at relatively low levels. This has the advantage of limiting the targets activated by X-ROS signaling.
The RyR2 channel is assumed in the model to be the main target for X-ROS signaling. The effect of ROS on RyR2 was described by a mode-switching mechanism where the ROS-dependent oxidation of RyR2 increases their open probability. The model suggests that this is a reversible process as simulations with irreversible oxidation of RyR2s fail to simulate the experimental data. A mechanistic model of the RyR2 and CRUs has thus been developed that is able to demonstrate the abrupt increase in Ca2+ sparks in the presence of stretch-induced ROS and the immediate fall in the Ca2+ spark rate when ROS concentration decreases to its control level after release of stretch. In our four-state model of RyR2, the RyR2 behaves differently in quiescent cells, where [ROS]ds is thought to be in the nanomolar range, compared to acutely stretched cells, where [ROS]ds is in the micromolar range. Upon stretching of a cardiomyocyte, those RyR2s that are in mode 1 in the presence of a nanomolar concentration of ROS can switch to mode 2, which has higher open probability, due to the abrupt elevation of ROS to the micromolar level, leading to the increased Ca2+ spark rate. This increase in the Ca2+ spark rate causes a corresponding decrease in [Ca2+]NSR and increase in [Ca2+]i. It should be noted that there are additional targets of ROS in the myocyte. For example, the L-type calcium channel can display increased open probability when its thiol groups are oxidized, and calcium/calmodulin-dependent kinase II (CaMKII) can also be activated by oxidation (4, 24, 25). The SR Ca2+ -ATPase (SERCA) can be inhibited when oxidized, but the effect of oxidation by ROS on the Na+-Ca2+ exchanger (NCX) is controversial (4, 26). Study of the contribution of these other targets is left for future work.
The increase in intracellular [ROS] is consistent with levels observed experimentally. The levels of ROS in different cells can vary widely. At the low end of the spectrum, a study using Amplex red dye in neurons measured [H2O2] below the detection threshold of 7 nM at rest that increased to 66 nM after treatment with insulin (27). On the other hand, Escherichia coli display a somewhat higher [H2O2] of 200 nM (28). Muscle, however, seems to have higher ROS levels. We found two studies estimating ROS concentration in the heart. In a computational study, the Cotassa model has [ROS] transients peaking above 100 μM during metabolic oscillations (29). Experimental studies in isolated cardiac myocytes have biochemically measured [H2O2] at 15 μM in control hearts, at 50 μM after 30 min of ischemia, and at 100 μM 2 min after reperfusion (30). Skeletal muscles, whose mitochondria produce ROS at 40% the rate of cardiac mitochondria, experience a 50- to 100-fold increase in ROS going from rest to exercise (18). Cardiac myocytes seem to have the ability to survive high ROS levels. In experiments, cardiac myocytes have been exposed to ROS levels as high as 10 mM without cell death (31). In fact, exposing skeletal muscle to increasing doses of H2O2 (up to 1 mM) increases endurance (32).
X-ROS signaling enhances EC coupling
During contraction of the heart, cardiac cells undergo cyclic periods of stretching and release of stretch. Comparing this cyclic process of elongation and shortening at 1 Hz, 2 Hz, and 4 Hz demonstrates that [ROS]ds and [ROS]i increase with increasing frequency of stretching and release of stretch. Accompanying the higher rate of [ROS]ds production is a higher Ca2+ spark count, and hence a higher [Ca2+]i, with the cycle of stretching and release of stretch at 2 Hz and 4 Hz compared to that at 1 Hz. This increase seems to plateau at 4 Hz. This suggests that X-ROS signaling may increase the gain of EC with increases in pacing rate.
Furthermore, during electrical pacing, the model predicts that X-ROS signaling leads to a modest increase in the amplitude of the [Ca2+]i transient. This was accomplished by inducing a 200 ms period of stretching (and ROS production) at different times during the cardiac cycle. Interestingly, the biggest effect of the frequency of stretching seems to be the increase in myoplasmic ROS (Fig. S2 in the Supporting Material), with a small effect on [Ca2+]i (this matches our unpublished experimental observations). This potentiation of the [Ca2+]i transient is maximal when the 200 ms period of stretching immediately precedes the AP. The model shows that under these conditions, [ROS]ds is maximal when the AP begins and triggers the Ca2+ transient. Teleologically, this makes sense, as the filling of the ventricles with blood stretches the myocytes immediately before contraction. Hence, the stretching of the ventricular wall combined with X-ROS signaling seems to optimize Ca2+ release during contraction. Of note, the experimentally measured increase in free [Ca2+]i may fall short of that predicted by the model due to the subsequent increase in myofilament Ca2+ buffering that occurs during stretching (33).
X-ROS signaling is attenuated during prolonged stretch
The model suggests that prolonged distension of the wall (10 s), and the accompanying stretching of the myocyte, enhances Ca2+ release modestly. However, with prolonged stretch, the X-ROS production is attenuated, consistent with experiments. Furthermore, this small potentiation of Ca2+ release is attenuated by depletion of the NSR due to the increased RyR2 Ca2+ leak. This is similar to the results of Trafford and colleagues (34), which showed that increasing RyR2 open probability pharmacologically resulted in a transient increase in the Ca2+ transient, which then returned to the control amplitude after several beats (34). This recovery was due to changes in [Ca2+]NSR (34, 35). The opposite effect was seen with washout, i.e., there was a transient decrease in Ca2+-transient amplitude that returned to the control level after several beats.
OS affects X-ROS signaling during disease
OS occurs when the cellular ROS levels rises. The model suggests that when the removal of ROS is impaired, the systolic and diastolic spark rates increase due to an increase in the level of cellular ROS. An example of a disease in which ROS removal is impaired due to reduction in the available glutathione pool is HF (36). Increased Ca2+ leak has been observed in HF and has been implicated in arrhythmia (37). Although increased X-ROS signaling might not be the primary cause of the increased leak, it could contribute to it. Similarly, if the rate of ROS production increases, the cellular ROS levels will also rise. X-ROS signaling is enhanced in muscular dystrophy (mdx) by increased microtubule density transmitting stretching to the NADPH oxidase (13). In fact, muscle cells from mdx mice show an increased susceptibility to OS (38, 39). This increase in SR Ca2+ leak likely plays a role in arrhythmia. In fact, inhibition of NADPH oxidase reduces the propensity for arrhythmia in the mdx heart (40). The model also predicts that a significant depletion of reducing compounds could result in a dramatic change in redox status of the myocyte, driving the cell toward pathology. Lowering the GSH concentration by factors observed in disease states elevated the [ROS]i, which significantly increased the [Ca2+]i and depleted the [Ca2+]NSR.
Other considerations
During sarcomere lengthening, there is an observed increase in force that is thought to be due to an increase in troponin affinity for Ca2+ independent of Ca2+ level. During a single stretch from rest, the spontaneous spark rate can double due to X-ROS signaling. Furthermore, the model suggests that during the initial twitch, the calcium transient amplitude increases by 20%. This increase in the Ca2+ transient amplitude may be partially obscured and offset by the increased myofilament Ca2+ sensitivity, i.e., increased Ca2+ buffering, a feature not included in the model presented here, but left for future work. Therefore, it is possible that the stretch activation of Ca2+ release might be also involved in force-length effects. However, that is speculative, and further studies are planned to explore this topic more thoroughly.
The model suggests that during the AP, the myocyte spark count increases by 15.6% when X-ROS signaling is added. This means that additional sites are seeing elevated calcium in the form of Ca2+ sparks. Others might be seeing calcium elevations as nonspark openings (15). Low-affinity cellular Ca2+ sensors (e.g., calmodulin, Kd 5 μM (41)), will only be activated during RyR2 opening. Hence, the increased spark activity, though only modestly affecting Ca2+ release, can activate molecules such as calmodulin, which can then act on downstream targets like CaMKII to alter cell function. In fact, there is evidence that CaMKII is activated during stress by Nox2-ROS production at the release sites and that CaMKII directly increases RyR2 open probability (42, 43). Dries and co-workers (42) observed that RyR2s that are in release sites with intact dyadic structure are regulated by Nox2-ROS and CaMKII during high-frequency stimulation. However, orphaned sites without adjacent T-tubules (and therefore presumably far from Nox2) did not show the same frequency-dependent regulation by ROS and CaMKII. Furthermore, Jian and co-workers (43) suggest that the increase of RyR2 open probability with mechanical stress can occur via the synergistic effects of Nox2-ROS production and CaMKII activation, as well as nitric oxide synthase signaling (38). Finally, computational modeling by Saucerman and Bers has demonstrated that local Ca2+ signaling in the dyadic cleft affects targets of calmodulin such as calcineurin and CaMKII differently than in the bulk myoplasm, supporting the idea that the increase in spark activity during stretching may play a further signaling role (44).
The simulations presented here explore only the effects of X-ROS signaling on RyR2s. However, it is likely that X-ROS acts on multiple targets, such as CaMKII, mechano-sensitive channels (13), and nitric oxide synthase (45), and when these targets are affected in concert, the consequences may be more dramatic. Inclusion of these effects likely will be possible in the future, as we and others carry out new relevant experiments. The experiments used to constrain the modeling might have some of these effects present. If this is the case, the model will need to be reparametrized when new information is included. Hence, the effects of X-ROS signaling are likely greater than its effects on the size of the Ca2+ transient and will require further detailed study.
ROS has many targets in the cell and multiple sources. Here, we have considered ROS production by NADPH-oxidase in response to stretch and how that might affect the RyR. Future work should explore other targets, such as SERCA pumps, L-type channels, the NCX, and the sarcolemmal Ca2+ ATPase (4). Other sources of ROS production, such as mitochondria and xanthine oxidase, should also be considered.
In summary, this model for X-ROS signaling has been validated using available data and simulates the stretch-induced increase in spark rate and ROS production. The model suggests that the signaling is local and affects RyR2s in the dyad. It also suggests that as a result, the increase in sparks leads to activation of local calcium-dependent signaling. The model has been used to understand the physiological implication of X-ROS signaling, suggesting that it augments EC coupling gain with increased pacing frequency. The model suggests that diastolic stretching of the ventricular wall due to blood filling the ventricle optimally increases Ca2+ release from the SR during systole to maximize contraction. Furthermore, during prolonged stretching, the stretching alone is not likely to augment calcium release. During OS, however, there will be an increased level of ROS and increased RyR2 activity due to X-ROS signaling.
Author Contributions
S.L. developed the model, wrote the code, designed and ran simulations, analyzed results, and wrote the article. T.M.H.-T. wrote the code. B.L.P. designed the simulations, analyzed results, and wrote the article; W.J.L. designed the simulations, analyzed results, and wrote the article. M.S.J. developed the model, designed simulations, analyzed results, and wrote the article.
Acknowledgments
This research was supported by National Institutes of Health grants 5R01HL105239 (W.J.L. and M.S.J.), 5R01HL106059 (W.J.L.), and 5U01HL116321 (M.S.J. and W.J.L.), and R00-HL114879 from the National Heart, Lung and Blood Institute (B.L.P.).
Editor: James Sneyd.
Footnotes
Two figures are available at http://www.biophysj.org/biophysj/supplemental/S0006-3495(15)01004-8.
Supporting Material
References
- 1.Mieyal J.J., Chock P.B. Posttranslational modification of cysteine in redox signaling and oxidative stress: Focus on s-glutathionylation. Antioxid. Redox Sig. 2012;16:471–475. doi: 10.1089/ars.2011.4454. [DOI] [PMC free article] [PubMed] [Google Scholar]
- 2.Sun J., Xin C., Meissner G. Cysteine-3635 is responsible for skeletal muscle ryanodine receptor modulation by NO. Proc. Natl. Acad. Sci. USA. 2001;98:11158–11162. doi: 10.1073/pnas.201289098. [DOI] [PMC free article] [PubMed] [Google Scholar]
- 3.Marengo J.J., Hidalgo C., Bull R. Sulfhydryl oxidation modifies the calcium dependence of ryanodine-sensitive calcium channels of excitable cells. Biophys. J. 1998;74:1263–1277. doi: 10.1016/S0006-3495(98)77840-3. [DOI] [PMC free article] [PubMed] [Google Scholar]
- 4.Zima A.V., Blatter L.A. Redox regulation of cardiac calcium channels and transporters. Cardiovasc. Res. 2006;71:310–321. doi: 10.1016/j.cardiores.2006.02.019. [DOI] [PubMed] [Google Scholar]
- 5.Boraso A., Williams A.J. Modification of the gating of the cardiac sarcoplasmic reticulum Ca2+-release channel by H2O2 and dithiothreitol. Am. J. Physiol. 1994;267:H1010–H1016. doi: 10.1152/ajpheart.1994.267.3.H1010. [DOI] [PubMed] [Google Scholar]
- 6.Eu J.P., Sun J., Meissner G. The skeletal muscle calcium release channel: coupled O2 sensor and NO signaling functions. Cell. 2000;102:499–509. doi: 10.1016/s0092-8674(00)00054-4. [DOI] [PubMed] [Google Scholar]
- 7.Xu L., Eu J.P., Stamler J.S. Activation of the cardiac calcium release channel (ryanodine receptor) by poly-S-nitrosylation. Science. 1998;279:234–237. doi: 10.1126/science.279.5348.234. [DOI] [PubMed] [Google Scholar]
- 8.Marks A.R. Cardiac intracellular calcium release channels: role in heart failure. Circ. Res. 2000;87:8–11. doi: 10.1161/01.res.87.1.8. [DOI] [PubMed] [Google Scholar]
- 9.Terentyev D., Györke I., Györke S. Redox modification of ryanodine receptors contributes to sarcoplasmic reticulum Ca2+ leak in chronic heart failure. Circ. Res. 2008;103:1466–1472. doi: 10.1161/CIRCRESAHA.108.184457. [DOI] [PMC free article] [PubMed] [Google Scholar]
- 10.Cheng H., Lederer W.J., Cannell M.B. Calcium sparks: elementary events underlying excitation-contraction coupling in heart muscle. Science. 1993;262:740–744. doi: 10.1126/science.8235594. [DOI] [PubMed] [Google Scholar]
- 11.Prosser B.L., Ward C.W., Lederer W.J. X-ROS signaling: rapid mechano-chemo transduction in heart. Science. 2011;333:1440–1445. doi: 10.1126/science.1202768. [DOI] [PubMed] [Google Scholar]
- 12.Prosser B.L., Ward C.W., Lederer W.J. X-ROS signalling is enhanced and graded by cyclic cardiomyocyte stretch. Cardiovasc. Res. 2013;98:307–314. doi: 10.1093/cvr/cvt066. [DOI] [PMC free article] [PubMed] [Google Scholar]
- 13.Khairallah R.J., Shi G., Ward C.W. Microtubules underlie dysfunction in Duchenne muscular dystrophy. Sci. Signal. 2012;5:ra56. doi: 10.1126/scisignal.2002829. [DOI] [PMC free article] [PubMed] [Google Scholar]
- 14.Wagner E., Lauterbach M.A., Lehnart S.E. Stimulated emission depletion live-cell super-resolution imaging shows proliferative remodeling of T-tubule membrane structures after myocardial infarction. Circ. Res. 2012;111:402–414. doi: 10.1161/CIRCRESAHA.112.274530. [DOI] [PMC free article] [PubMed] [Google Scholar]
- 15.Williams G.S., Chikando A.C., Jafri M.S. Dynamics of calcium sparks and calcium leak in the heart. Biophys. J. 2011;101:1287–1296. doi: 10.1016/j.bpj.2011.07.021. [DOI] [PMC free article] [PubMed] [Google Scholar]
- 16.D’Autréaux B., Toledano M.B. ROS as signalling molecules: mechanisms that generate specificity in ROS homeostasis. Nat. Rev. Mol. Cell Biol. 2007;8:813–824. doi: 10.1038/nrm2256. [DOI] [PubMed] [Google Scholar]
- 17.Chen K., Keaney J.F., Jr. Evolving concepts of oxidative stress and reactive oxygen species in cardiovascular disease. Curr. Atheroscler. Rep. 2012;14:476–483. doi: 10.1007/s11883-012-0266-8. [DOI] [PMC free article] [PubMed] [Google Scholar]
- 18.Barbieri E., Sestili P. Reactive oxygen species in skeletal muscle signaling. J. Signal Transduct. 2012;2012:982794. doi: 10.1155/2012/982794. [DOI] [PMC free article] [PubMed] [Google Scholar]
- 19.Handayaningsih A.E., Iguchi G., Takahashi Y. Reactive oxygen species play an essential role in IGF-I signaling and IGF-I-induced myocyte hypertrophy in C2C12 myocytes. Endocrinology. 2011;152:912–921. doi: 10.1210/en.2010-0981. [DOI] [PubMed] [Google Scholar]
- 20.Wendell P.L. Measurement of oxidized glutathione and total glutathione in the perfused rat heart. Biochem. J. 1970;117:661–665. doi: 10.1042/bj1170661. [DOI] [PMC free article] [PubMed] [Google Scholar]
- 21.Friedman H.S., Colvin O.M., Griffith O.W. Glutathione protects cardiac and skeletal muscle from cyclophosphamide-induced toxicity. Cancer Res. 1990;50:2455–2462. [PubMed] [Google Scholar]
- 22.Shite J., Qin F., Liang C. Antioxidant vitamins attenuate oxidative stress and cardiac dysfunction in tachycardia-induced cardiomyopathy. J. Am. Coll. Cardiol. 2001;38:1734–1740. doi: 10.1016/s0735-1097(01)01596-0. [DOI] [PubMed] [Google Scholar]
- 23.Renjini R., Gayathri N., Srinivas Bharath M.M. Oxidative damage in muscular dystrophy correlates with the severity of the pathology: role of glutathione metabolism. Neurochem. Res. 2012;37:885–898. doi: 10.1007/s11064-011-0683-z. [DOI] [PubMed] [Google Scholar]
- 24.Hool L.C. Evidence for the regulation of L-type Ca2+ channels in the heart by reactive oxygen species: mechanism for mediating pathology. Clin. Exp. Pharmacol. Physiol. 2008;35:229–234. doi: 10.1111/j.1440-1681.2007.04727.x. [DOI] [PubMed] [Google Scholar]
- 25.Erickson J.R., Joiner M.L., Anderson M.E. A dynamic pathway for calcium-independent activation of CaMKII by methionine oxidation. Cell. 2008;133:462–474. doi: 10.1016/j.cell.2008.02.048. [DOI] [PMC free article] [PubMed] [Google Scholar]
- 26.Galan C., Jardín I., Rosado J.A. Role of oxidant scavengers in the prevention of Ca2+ homeostasis disorders. Molecules. 2010;15:7167–7187. doi: 10.3390/molecules15107167. [DOI] [PMC free article] [PubMed] [Google Scholar]
- 27.Storozhevykh T.P., Senilova Y.E., Pomytkin I.A. Mitochondrial respiratory chain is involved in insulin-stimulated hydrogen peroxide production and plays an integral role in insulin receptor autophosphorylation in neurons. BMC Neurosci. 2007;8:84. doi: 10.1186/1471-2202-8-84. [DOI] [PMC free article] [PubMed] [Google Scholar]
- 28.González-Flecha B., Demple B. Homeostatic regulation of intracellular hydrogen peroxide concentration in aerobically growing Escherichia coli. J. Bacteriol. 1997;179:382–388. doi: 10.1128/jb.179.2.382-388.1997. [DOI] [PMC free article] [PubMed] [Google Scholar]
- 29.Cortassa S., Aon M.A., O’Rourke B. A mitochondrial oscillator dependent on reactive oxygen species. Biophys. J. 2004;87:2060–2073. doi: 10.1529/biophysj.104.041749. [DOI] [PMC free article] [PubMed] [Google Scholar]
- 30.Slezak J., Tribulova N., Singal P.K. Hydrogen peroxide changes in ischemic and reperfused heart. Cytochemistry and biochemical and x-ray microanalysis. Am. J. Pathol. 1995;147:772–781. [PMC free article] [PubMed] [Google Scholar]
- 31.Hayashi H., Miyata H., Yamazaki N. Effects of hydrogen peroxide on action potentials and intracellular Ca2+ concentration of guinea pig heart. Cardiovasc. Res. 1989;23:767–773. doi: 10.1093/cvr/23.9.767. [DOI] [PubMed] [Google Scholar]
- 32.Shortt C.M., O’Halloran K.D. Hydrogen peroxide alters sternohyoid muscle function. Oral Dis. 2014;20:162–170. doi: 10.1111/odi.12084. [DOI] [PubMed] [Google Scholar]
- 33.Janssen P.M., de Tombe P.P. Uncontrolled sarcomere shortening increases intracellular Ca2+ transient in rat cardiac trabeculae. Am. J. Physiol. 1997;272:H1892–H1897. doi: 10.1152/ajpheart.1997.272.4.H1892. [DOI] [PubMed] [Google Scholar]
- 34.Trafford A.W., Díaz M.E., Eisner D.A. Stimulation of Ca-induced Ca release only transiently increases the systolic Ca transient: measurements of Ca fluxes and sarcoplasmic reticulum Ca. Cardiovasc. Res. 1998;37:710–717. doi: 10.1016/s0008-6363(97)00266-6. [DOI] [PubMed] [Google Scholar]
- 35.Jafri M.S., Rice J.J., Winslow R.L. Cardiac Ca2+ dynamics: the roles of ryanodine receptor adaptation and sarcoplasmic reticulum load. Biophys. J. 1998;74:1149–1168. doi: 10.1016/S0006-3495(98)77832-4. [DOI] [PMC free article] [PubMed] [Google Scholar]
- 36.Hill M.F., Palace V.P., Singal P.K. Reduction in oxidative stress and modulation of heart failure subsequent to myocardial infarction in rats. Exp. Clin. Cardiol. 2005;10:146–153. [PMC free article] [PubMed] [Google Scholar]
- 37.Chelu M.G., Wehrens X.H. Sarcoplasmic reticulum calcium leak and cardiac arrhythmias. Biochem. Soc. Trans. 2007;35:952–956. doi: 10.1042/BST0350952. [DOI] [PubMed] [Google Scholar]
- 38.Rando T.A., Disatnik M.H., Franco A. Muscle cells from mdx mice have an increased susceptibility to oxidative stress. Neuromuscul. Disord. 1998;8:14–21. doi: 10.1016/s0960-8966(97)00124-7. [DOI] [PubMed] [Google Scholar]
- 39.Spassov A., Gredes T., Kunert-Keil C. Increased oxidative stress in dystrophin deficient (mdx) mice masticatory muscles. Exp. Toxicol. Pathol. 2011;63:549–552. doi: 10.1016/j.etp.2010.04.006. [DOI] [PubMed] [Google Scholar]
- 40.Gonzalez D.R., Treuer A.V., Hare J.M. NADPH oxidase-2 inhibition restores contractility and intracellular calcium handling and reduces arrhythmogenicity in dystrophic cardiomyopathy. Am. J. Physiol. Heart Circ. Physiol. 2014;307:H710–H721. doi: 10.1152/ajpheart.00890.2013. [DOI] [PMC free article] [PubMed] [Google Scholar]
- 41.Chin D., Means A.R. Calmodulin: a prototypical calcium sensor. Trends Cell Biol. 2000;10:322–328. doi: 10.1016/s0962-8924(00)01800-6. [DOI] [PubMed] [Google Scholar]
- 42.Dries E., Bito V., Macquaide N. Selective modulation of coupled ryanodine receptors during microdomain activation of calcium/calmodulin-dependent kinase II in the dyadic cleft. Circ. Res. 2013;113:1242–1252. doi: 10.1161/CIRCRESAHA.113.301896. [DOI] [PubMed] [Google Scholar]
- 43.Jian Z., Han H., Chen-Izu Y. Mechanochemotransduction during cardiomyocyte contraction is mediated by localized nitric oxide signaling. Sci. Signal. 2014;7:ra27. doi: 10.1126/scisignal.2005046. [DOI] [PMC free article] [PubMed] [Google Scholar]
- 44.Saucerman J.J., Bers D.M. Calmodulin mediates differential sensitivity of CaMKII and calcineurin to local Ca2+ in cardiac myocytes. Biophys. J. 2008;95:4597–4612. doi: 10.1529/biophysj.108.128728. [DOI] [PMC free article] [PubMed] [Google Scholar]
- 45.Prosser B.L., Ward C.W. Mechano-chemo transduction tunes the heartstrings. Sci. Signal. 2014;7:pe7. doi: 10.1126/scisignal.2005214. [DOI] [PMC free article] [PubMed] [Google Scholar]
Associated Data
This section collects any data citations, data availability statements, or supplementary materials included in this article.