Abstract
Since diseases of the liver and bile ducts are common, a clinician is faced by the need to implement an appropriate diagnostic process. It is necessary to apply diagnostic methods that enable appropriate assessment of the most common pathologies of the liver, i.e. fibrosis, steatosis and focal lesions, as well as initial assessment of the bile ducts. These goals can be achieved using ultrasound methods based on conventional sonography, contrast-enhanced sonography and elastography. The assessment of fatty liver and bile duct dilatation using ultrasound reaches satisfactory levels of sensitivity and specificity. The usage of contrast agents enables unambiguous differentiation between benign and malignant focal lesions, frequently allowing them to be identified accurately without the assistance of other imaging modalities. Elastography has enabled reliable assessment of liver fibrosis. Its results are comparable to those of the standard method, i.e. liver biopsy.
Keywords: fatty liver, elastography, CEUS, bile ducts
Abstract
W związku z powszechnym występowaniem chorób wątroby i dróg żółciowych klinicysta stoi przed problemem wdrożenia odpowiedniej diagnostyki. Istnieje potrzeba stosowania metod diagnostycznych umożliwiających odpowiednią ocenę najczęstszych patologii wątroby, to jest włóknienia, stłuszczenia miąższu wątroby, różnicowania zmian ogniskowych, czy wstępną ocenę patologii dróg żółciowych. Na osiągnięcie tych celów pozwala zastosowanie metod ultrasonograficznych opartych na klasycznej ultrasonografii, ultrasonografii z wykorzystaniem kontrastów dożylnych i elastografii. Ultrasonograficzna ocena stłuszczenia wątroby i poszerzenia dróg żółciowych osiąga zadowalającą czułość i specyficzność. Zastosowanie kontrastów dożylnych pozwala na jednoznaczne różnicowanie między łagodnymi a złośliwymi zmianami ogniskowymi, często umożliwiając prawidłową ich identyfikację bez konieczności stosowania innych metod badań obrazowych. Zastosowanie metody elastografii umożliwiło wiarygodną ocenę włóknienia wątroby, z wynikami porównywalnymi do standardowej metody, jaką jest biopsja wątroby.
Fatty liver
A clinician's problem
Steatosis is the most common hepatic abnormality in developed countries. It can be found in over 20% of adults(1). Steatosis consists in increased accumulation of triglycerides in the cytoplasm of hepatocytes and can be of the micro- or macrovesicular nature. It is closely associated with the epidemics of metabolic syndrome, obesity and insulin resistance, and constitutes a hepatic manifestation of these conditions, so-called non-alcoholic fatty liver disease (NAFLD). Another common cause of liver steatosis is alcoholic liver disease (ALD) which is suspected in individuals who consume more than 20–30 g of ethanol daily (respectively for women and men). Less commonly, liver steatosis can be caused by drugs (e.g. steroids, methotrexate), improper nutrition (malnutrition, rapid weight loss) and other factors (Reye syndrome, HCV infection, parenteral nutrition). A liver biopsy is a gold standard in diagnosing liver steatosis. It enables semi-quantitative grading (5 grades: 0%, 1–5%, 6–33%, 34–66%, >67%; norm to 5%), the specification of the steatosis type (micro- or macrovesicular) and determination whether necrotic and inflammatory lesions (so-called non-alcoholic steatohepatitis, NASH), which make up an unfavorable prognostic factor, coexist.
The possibility to identify and assess liver steatosis using non-invasive techniques is associated with the following benefits(1, 2):
the confirmation of liver steatosis in imaging in a person with typical NAFLD or ALD risk factors renders the further detailed diagnostic process of a hepatopathy unnecessary (once other common causes, such as viral hepatitis, have been ruled out);
in addition to the assessment of live function, quantitative assessment of fatty liver would enable future monitoring of NAFLD and ALD treatment efficacy;
owing to the widespread character of NAFLD, the donor liver can be assessed before transplantation (the risk of the primary function failure of the transplanted liver in macrovesicular steatosis).
Role of ultrasound
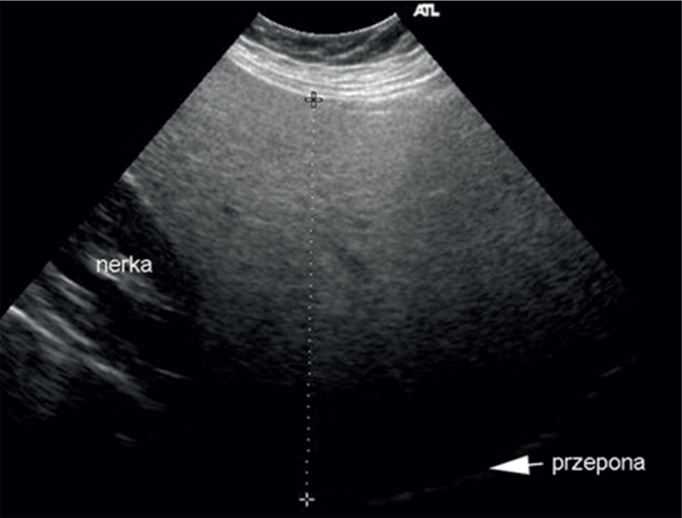
Fatty liver is a benign abnormality that consists in the accumulation of lipids in hepatocytes. It is considered a pathology if at least 5% of hepatocytes are affected(3). The most common conditions with liver steatosis are NAFLD, hepatitis C, alcoholic disease, chemotherapy and metabolic syndrome. If it is accompanied by inflammation, the term steatohepatitis is used. It is associated with a worse prognosis(4). Histological evaluation and a liver biopsy remain a gold standard in diagnosing liver steatosis(5). This method is characterized by a range of disadvantages, including: sample error associated with irregular distribution of fat in the liver, too low mass of the organ (1/50,000 of the liver mass), invasiveness of the procedure, which makes it unreliable as a screening method, and possible complications, such as bleeding or pneumothorax(6). Moreover, non-invasive methods of fatty liver assessment are also available. They include radiological and ultrasound examinations(7, 8). Ultrasound imaging is worth particular attention since it is cost-effective and not burdened with a risk associated with exposure to radiation. Standard ultrasound enables liver steatosis to be diagnosed when it involves more than 30% of hepatocytes. In an ultrasound image, the liver presents itself as a hyperechoic organ in comparison with the right renal cortex (Fig. 1)(9).
Fig. 1.
Fatty liver. Hyperechoic parenchyma in comparison with renal cortex echogenicity
Qualitative assessment of the level of steatosis enables three grades to be distinguished: mild, moderate and severe (Tab. 1)(10).
Tab. 1.
Ultrasound features of diffuse liver steatosis
| Mild | Enhanced parenchymal echogenicity |
| Medium | Increased parenchymal echogenicity, disturbed visibility of vascular structures in the liver and diaphragm |
| Severe | Increased parenchymal echogenicity, poor visibility of vascular structures in the liver and diaphragm, poor visibility of the posterior segments of the liver |
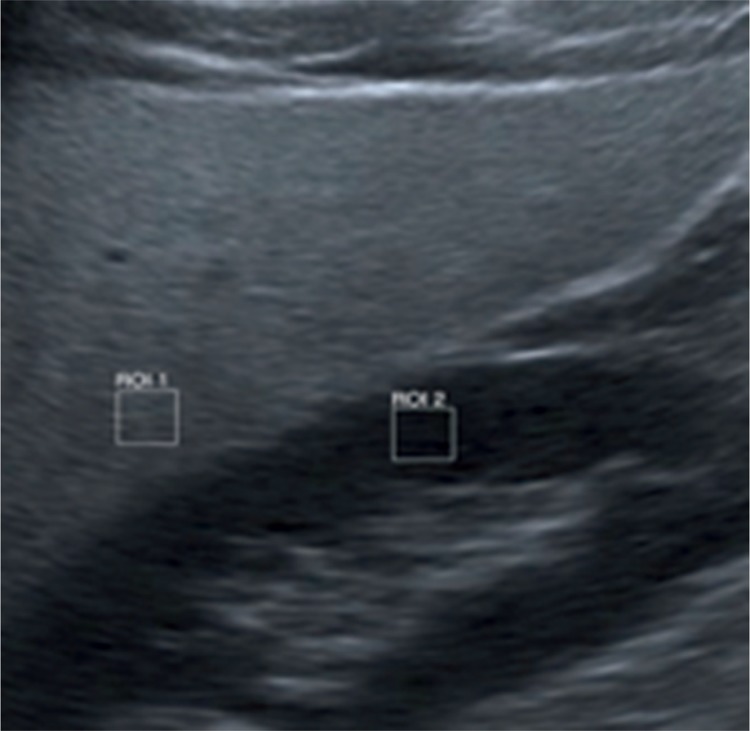
Ultrasound imaging provides reliable results with the sensitivity of 0.857–0.991 and specificity between 0.852 and 0.919(11). Techniques enabling quantitative assessment of liver steatosis facilitate the efficacy of detection. One of these methods is the assessment of liver brightness in comparison with the renal cortex (sonographic hepatorenal index, SHRI) (Fig. 2)(12).
Fig. 2.
Quantitative assessment of liver steatosis (SHRI)
The sixth segment of the liver and the upper pole of the right kidney are usually taken into account. After marking regions of interest (ROIs) of the size of at least 400 pixels, they are compared in gray scale. In one of pertinent papers, it has been reported that the cut-off point of SHRI at the level of 1.24 enabled the diagnosis of fatty liver with the sensitivity and specificity of 0.93(13). In a different paper, authors proved that SHRI cut-off points at the level of 1.21, 1.28 and 2.15 enabled the diagnosis of fatty liver greater than 5%, 25% and 50%, respectively, with the sensitivity of 100% and specificity of 70%(14). Another method allowing semi-quantitative evaluation of liver steatosis is CAP (controlled attenuation parameter). This technique measures the loss of energy of an acoustic wave that passes through the hepatic tissue affected by steatosis. This method is used in a FibroScan system by Echosens, which has been developed to measure the grade of liver steatosis(3, 15–17). It has a number of advantages, such as the ease of measurement, painless examination, independence of the examiner, ability to assess steatosis in a quantitative way from the grade that involves 10% of hepatocytes. An undoubted advantage is the fact that the same equipment can be used to obtain information about the grade of steatosis and fibrosis (Fig. 3).
Fig. 3.
FibroScan images: A. normal hepatic parenchyma without steatosis; B. hepatic parenchyma without steatosis with fibrosis
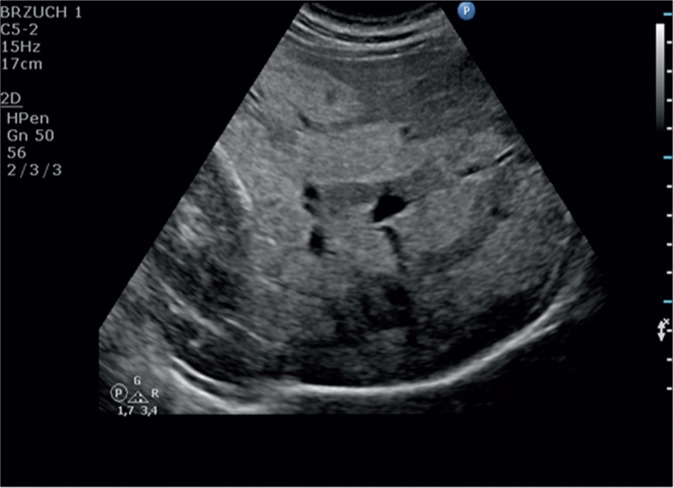
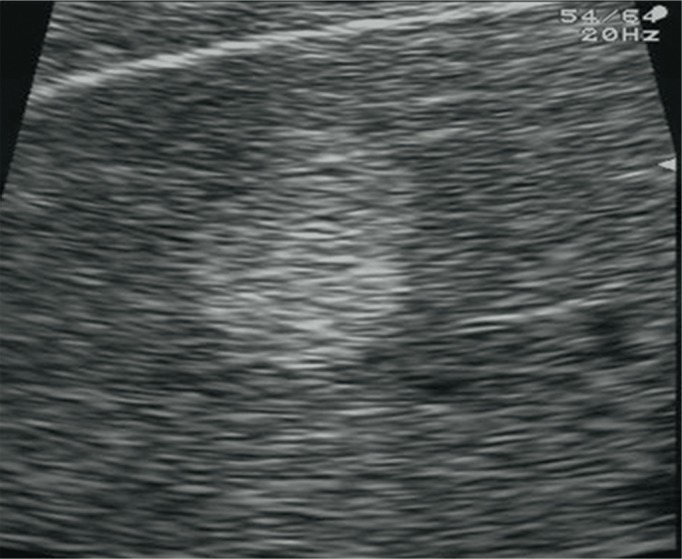
Problems associated with the assessment of liver steatosis can be connected with the distribution of the pathology in the hepatic tissue. It is not always regular and can occur in clusters, thus mimicking focal lesions. In this case, these lesions are localized in the perihilar region, in segment IV as well as in the subcapsular area. Typical features of such lesions are their geographic shapes and no mass effect in relation to the surrounding tissue as well as ductal and vascular structures (Fig. 4).
Fig. 4.
Focal steatosis of the liver parenchyma
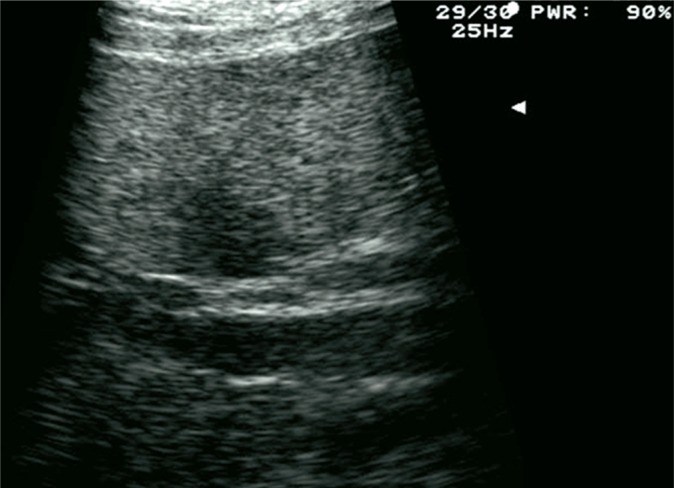
Irregular hypoechoic areas of various sizes may appear in the same localization. They represent foci of lower intensity steatosis (Fig. 5).
Fig. 5.
Focus of hyposteatosis in the liver parenchyma
Another typical localization of hyposteatosis is the region of the gallbladder bed. The method of choice that distinguishes these lesions from neoplastic foci is any contrast-enhanced examination. The behavior of a contrast agent within focal steatosis and hyposteatosis is the same as in the surrounding hepatic tissue.
Focal lesions in the liver
A clinician's problem
Since imaging has become widespread, incidentally detected focal lesions in the liver are a common phenomenon and a frequent cause of medical consultation(18).
A clinician must consider patient's complaints (symptomatic or asymptomatic changes: abdominal pain, vomiting, weight loss, fever, jaundice), medical history (cancer, liver cirrhosis) and drugs used by patients (oral contraceptive pill). Imaging examinations (US, CT, NMRI), or in other cases microscopic tests (cytological and histologic examination) are the most important in determining the nature and grade of lesions, and in selecting a therapeutic method.
Considering the aforementioned circumstances, three scenarios can be outlined concerning how to act when focal lesions are detected in the liver(19):
in asymptomatic patients with no history of cancer, the benign nature of lesions must be confirmed in the first case (cyst, angioma, focal steatosis or focal nodular hyperplasia), which will reduce costs and invasiveness of a further diagnostic process and relieve patient's apprehension;
in patients with the history of cancer or symptoms that suggest a neoplastic disease, the metastatic character of lesions must be ruled out (usually neoplasms of the lungs, breast and the gastrointestinal tract);
in patients with liver cirrhosis or portal hypertension, hepatocellular carcinoma should be ruled out.
Role of ultrasound
Owing to its unique properties, the liver is a frequent target of metastases from malignant neoplasms of other organs. This is because of a double supply of portal and arterial blood, considerable volume of flowing blood and a significant role of the liver in biochemical processes. All these factors make it an ideal place for rapid tumor growth(20). That is why post-mortem examinations reveal metastases in the liver in 25–50% of patients with diagnosed cancer(21). As for malignant lesions, the role of hepatocellular carcinoma is increasing. It is associated with cirrhosis and/or viral hepatitis in 80% of cases(22). Benign pathologies, which are detected in 20% of post-mortem examinations(23), constitute a considerably more common pathology. Such lesions include simple cysts, angiomas, FNH (focal nodular hyperplasia), focal steatosis or adenomas.
The first-choice examination in the assessment of focal lesions is standard ultrasound due to its availability, cost-effectiveness and non-invasive nature. Unfortunately, such an examination results in merely 26–35% of correct diagnoses of benign lesions and 28–39% of malignant ones(24). This modality is the most effective with respect to angiomas and simple cysts (Fig. 6 and 7).
Fig. 6.
Liver angioma
Fig. 7.
Simple cysts of the liver
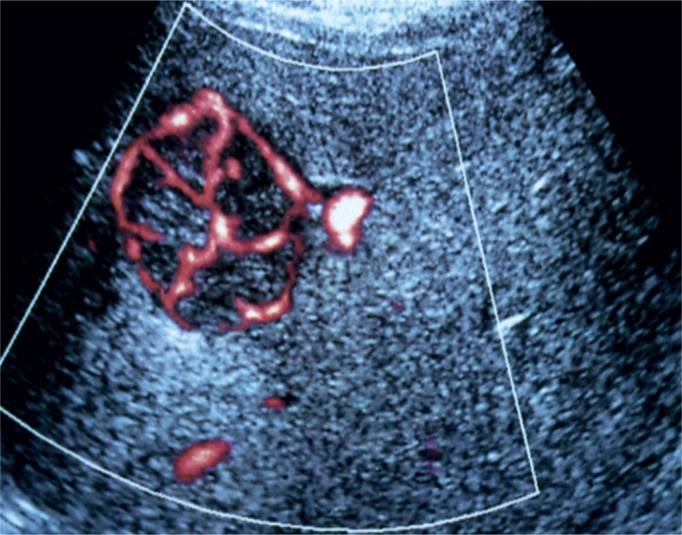
The color Doppler and power Doppler techniques increase the accuracy of certain diagnoses and has a lower influence on the sensitivity of the examination. This is of particular significance in typical lesions in FNH, manifested as a spoke-wheel pattern (Fig. 8), or HCC (hepatocellular carcinoma), in which a basket pattern can be observed(25).
Fig. 8.
Spoke-wheel presentation in a Doppler US examination, typical of FNH
A breakthrough in ultrasound imaging of focal lesions in the liver has been brought by the introduction of contrast agents, the most common of which is SonoVue (Bracco, Geneva, Switzerland). The sensitivity and specificity of contrast-enhanced ultrasound (CEUS) are comparable or even superior to those of contrast-enhanced computed tomography or magnetic resonance imaging(26). These values are at the level of approximately 88% for sensitivity and 81% for specificity. The equipment used in contrast-enhanced examinations must be fitted with a low mechanical index option and pulse-inversion harmonic imaging that do not break down or degrade microbubbles of an intravenous contrast agent. The test consists in the assessment of three vascular phases: the arterial (early) phase lasting 15–35 s after injection, portal phase (35–90 s) and delayed venous phase (90–240 s). The image enables the differentiation between benign and malignant lesions as well as allows a detailed diagnosis to be made in each of these two groups (Tab. 2).
Tab. 2.
Characteristics of focal lesions in the liver in a contrast-enhanced ultrasound examination
| Lesion | Arterial phase | Delayed phase |
|---|---|---|
| Cyst | No enhancement | No enhancement |
| Focal steatosis | Enhancement identical to normal liver, no mass effect | Enhancement identical to normal liver, no mass effect |
| Abscess | Irregularly enhancing rim, no central enhancement | Hypoechoic rim, no central enhancement |
| Angioma | Peripheral to central enhancement, frequently nodular | Iso- or hyperechoic peripheral enhancement, the entire lesion can be enhanced |
| FNH | Spoke-wheel enhancement | Isoechogenicity |
| Adenoma | Central enhancement | Isoechogenicity |
| Vascularized metastases | Uniform enhancement | Hypoechogenicity |
| Non-vascularized metastases | Peripheral enhancement | Hypoechogenicity |
| HCC | Strong enhancement | Hypoechogenicity/ sometimes isoechogenicity |
Adverse effects of using contrast agents involve headache, nausea, skin rash and anaphylaxis but they are observed in 0,002% of cases(27).
Liver fibrosis
A clinician's problem
In chronic parenchymal diseases of the liver (both inflammatory and metabolic), the long-term activation of hepatic stellate cells by inflammation leads to fibrosis, i.e. an increase in the number of collagen fibers in the extracellular matrix at the expense of hepatocytes. The most advanced stage of fibrosis is liver cirrhosis with parenchymal remodeling and arteriovenous shunts. The gold standard in the diagnosis of fibrosis and cirrhosis is liver biopsy which distinguishes between five grades of fibrosis according to the METAVIR classification (F0 – no fibrosis, F4 – cirrhosis). An alternative to histologic assessment is non-invasive evaluation of fibrosis, which includes ultrasonography.
Non-invasive methods of fibrosis assessment in patients with chronic liver diseases enable:
the selection of patients with chronic hepatitis B and C to anti-viral treatment(28, 29); because of the risk of progression, costs and drug adverse effects, patients eligible for treatment are those with fibrosis ≥1 in the METAVIR classification with a concomitant HBV infection and ≥2 with a concomitant HCV infection.
the monitoring of treatment efficacy in numerous liver diseases(30, 31); effective treatment is one that results in the stopping of fibrosis progression, and in certain cases fibrosis is reversible (fibrosis reduction by ≥1 grade);
referring patients with controlled cirrhosis (frequently asymptomatic ones) to endoscopic examinations to evaluate them for portal hypertension and implementing primary prevention of esophageal bleeding(32);
identification of patients who require oncological surveillance for early detection of hepatocellular carcinoma(33); the surveillance concerns patients with liver cirrhosis irrespective of the etiology, with chronic active hepatitis B and HCV infection with METAVIR F3 fibrosis.
Role of ultrasound
The assessment of the hepatic parenchyma using conventional ultrasonography is not characterized by satisfactory levels of sensitivity and specificity(34). Diffuse parenchymal heterogeneity is a feature of fibrosis. The sensitivity increases with fibrosis progression. By considering other features, such as irregular hepatic structure with nodular remodeling, increased caudate to right lobe ratio or the presence of fluid in the abdominal cavity, satisfactory levels of sensitivity and specificity in the diagnosis of the final stage of fibrosis, i.e. cirrhosis, can be obtained(35). Doppler techniques may be useful in assessing advanced cirrhosis with portal hypertension. The features taken into account in portal hypertension are: mono- or biphasic flow in the hepatic vein (triphasic flow is normal), or slower flow in the portal vein. These features are not specific enough for a certain assessment of portal hypertension(36). The patency of the umbilical vein or reverse flow in the portal vein can be certain indicators of portal hypertension.
The goal of a clinician is to identify fibrosis in the earliest stage possible thanks to which the elimination of hepatotoxic factors is possible and the process of fibrosis can be stopped or, in certain cases, reversed. The gold standard in this case is liver biopsy. However, because of its invasive nature, possible complications and sample non-representativeness, other methods are being researched. The method used to achieve this goal is elastography which is based on the interpretation of the velocity of acoustic wave propagation in the hepatic parenchyma. Transient elastography (FibroScan), acoustic radiation force impulse imaging (ARFI), shear wave mode elastography (SWE) and strain elastography are available and broadly used.
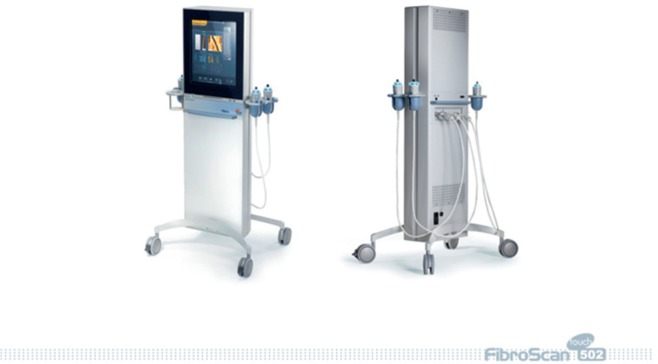
Measurement results in the FibroScan technique are expressed in kPa in a range from 2.5 to 75 kPa. Reliable results can be obtained by taking 10 measurements, 60% of which should be accurate. The upper limit for normal liver tissue stiffness is 5.3 kPa. Significant fibrosis, expressed as METAVIR F ≥ 2, corresponds to the range of 7.2–7.6 kPa, and liver cirrhosis – to the values above 12.5 kPa. The basic limitation of this method is patient's obesity and ascites. Reliable results may be obtained in patients whose BMI is below 28 kg/m2 (Fig. 9)(37).
Fig. 9.
FibroScan system
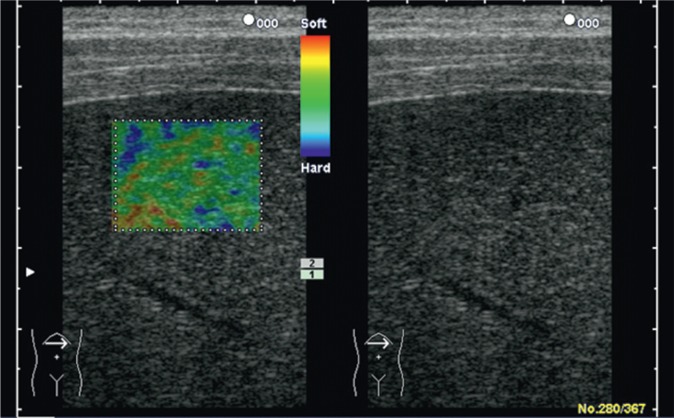
An even greater range of possibilities is provided by elastography techniques available in standard ultrasound machines thanks to which the operator is able to observe the liver and choose a place for tissue elasticity measurement. The greatest number of data we have concern color-coded real-time sonoelastography as well as elastography using the AFRI and SWE techniques. In the first technique mentioned above, the degree of mechanical tissue deformation, caused by compression with an ultrasound transducer, is presented as a color map in which the proportion of given colors is analyzed. The colors correspond to tissue stiffness (Fig. 10).
Fig. 10.
Normal liver in color-coded real-time sonoelastography
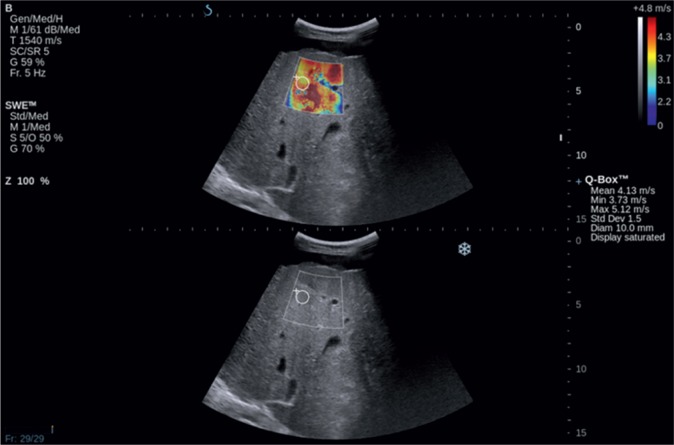
AFRI and SWE techniques use tissue deformation induced by acoustic impulses that produce shear waves whose speed is directly proportional to tissue stiffness. The advantage of SWE is the generation of the image of tissue elasticity on a color map. It enables one to select the most optimal localization in which quantitative measurements (expressed as kPa or m/s) can be performed (Fig. 11). Studies carried out so far have shown that values obtained in healthy individuals range from 4.92 to 5.39 kPa whereas the same parameters in patients suffering from cirrhosis exceed 11.4 kPa(38).
Fig. 11.
SWE elastography. Liver cirrhosis
The size of the liver
A clinician's problem
In various pathologies, the size of the liver can remain unchanged, be greater (Tab. 3) or reduced (e.g. end-stage cirrhosis, liver developmental disorders). An objective measure of the liver size is the volume or mass of the organ in relation to the body surface, which cannot be determined in a physical examination(39). The sensitivity and specificity of the physical examination in determining liver enlargement are low. This results in a failure to diagnose hepatomegaly or mistaking the normal liver for enlarged one. The clinical evaluation of the size of the liver is therefore made just for rough assessment. It consists in determining the degree of liver dullness in the midclavicular line(40). In normal conditions, the superior border of dullness is localized along the 6th intercostal space, and the inferior one is found along the costal margin. The distance determined in such a way does not exceed 12–13 cm. In slim patients, the inferior edge of the liver can be palpable on inspiration under the costal margin. In pathologies associated with increased pulmonary volume (emphysema, asthma) both borders are moved downwards without affecting the range of dullness.
Tab. 3.
Causes of hepatomegaly(41)
| Chronic parenchymal diseases | alcoholic liver disease non-alcoholic fatty liver disease autoimmune liver diseases viral hepatitis |
| Neoplastic diseases | primary hepatic neoplasms (hepatocellular carcinoma and cholangiocarcinoma) secondary hepatic neoplasms (metastases) benign focal lesions (angioma, adenoma, focal nodular hyperplasia, cysts) |
| Right ventricular failure | |
| Hematologic diseases | leukemia lymphoma myeloproliferative syndromes (e.g. polycythemia vera, myelofibrosis) |
| Rare causes | amyloidosis sarcoidosis Budd–Chiari syndrome glycogenosis |
To sum up, the clinical assessment of the size of the liver must be verified and the degree of changes must be determined using imaging techniques. Moreover, these examinations are used in the further stages of the initial diagnostic process of hepatomegaly (parenchymal diseases, infiltrations, focal lesions, vascular pathologies) and in determining whether these changes are diffuse (parenchymal and storage diseases) or limited (e.g. focal lesions, left lobe hypertrophy in cirrhosis).
Role of ultrasound
Hepatomegaly is frequently the only sign of an ongoing inflammation. The liver size is usually evaluated in the longitudinal or anteroposterior size of the right lobe in the right midclavicular line. It should not exceed 15 cm. In practice, the size of the liver is compared to the pole of the right kidney, which should be comparable in normal conditions. In certain situations, e.g. the anatomic variant referred to as Riedel lobe, mistakes in interpretation can occur(42). Other abnormalities that suggest hepatitis include: the starlit sky pattern, in which increased echogenicity of the periportal areas coexists with hypoechoic liver parenchyma. However, insufficient sensitivity of this image makes it not very useful in daily practice(43). Hyperechogenicity and irregular echogenicity in the parenchyma are much more common in chronic hepatitis, which is mainly associated with parenchymal steatosis or fibrosis.
Bile ducts
A clinician's problem
Acute and/or recurring pain in the right upper quadrant is a frequent cause of medical consultation, both in out-patient clinics and in hospitals(44). The differential diagnosis mainly involves diseases of the liver, gallbladder and bile ducts, but it should also include other abdominal and thoracic organs (Tab. 4). Apart from a physical examination and doctor-patient interview, laboratory tests deliver significant diagnostic information (CBC, CRP, liver function tests, amylase, creatinine, troponin or general urinalysis). Of all imaging modalities, ultrasonography is the method of the first choice and of the greatest usefulness in assessing pain in the right upper quadrant irrespective of other symptoms (fever, leukocytosis or Murphy's sign). This has been confirmed by the recommendations of the American College of Radiology(45). Only when a US result is ambiguous or when a more detailed analysis of complications is required, or other organs need to be evaluated, computed tomography or magnetic resonance imaging are recommended. No signs of lesions in the bile ducts in a US examination does not rule out bile duct diseases. Microlithiasis and sphincter of Oddi dysfunction must be considered in such cases(46).
Tab. 4.
Causes of pain in the right upper quadrant(44)
| Bile duct diseases | choledocolithiasis cholecystitis cholangitis |
| Liver diseases | abscess hepatitis liver tumors Budd–Chiari syndrome |
| Pancreatic diseases | acute and chronic pancreatitis pancreatic cancer |
| Kidney diseases | nephrolithiasis pyelonephritis |
| Stomach diseases | gastritis ulcers |
| Intestinal diseases | appendicitis small bowel inflammation colitis diverticulitis intussusception |
| Pulmonary diseases | pneumonia pulmonary embolism |
| Other | costochondritis shingles myocardial infarction |
When referring a patient to an ultrasound examination, a clinician expects the assessment of the liver (focal lesions), pancreas (features of acute or chronic pancreatitis) and, above all, the gallbladder and bile ducts (presence of stones, inflammatory changes, width of the bile ducts)
Role of ultrasound
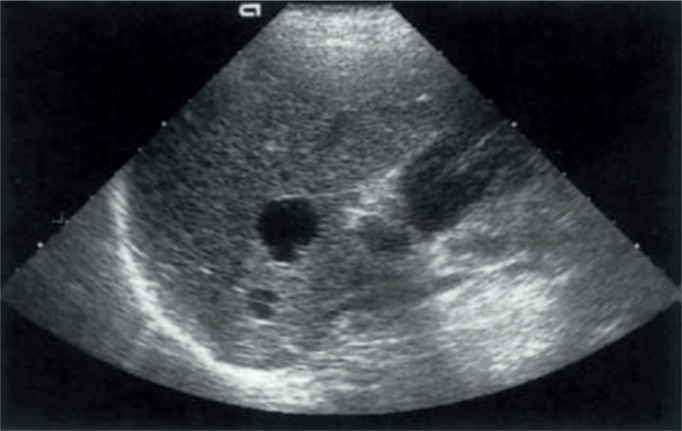
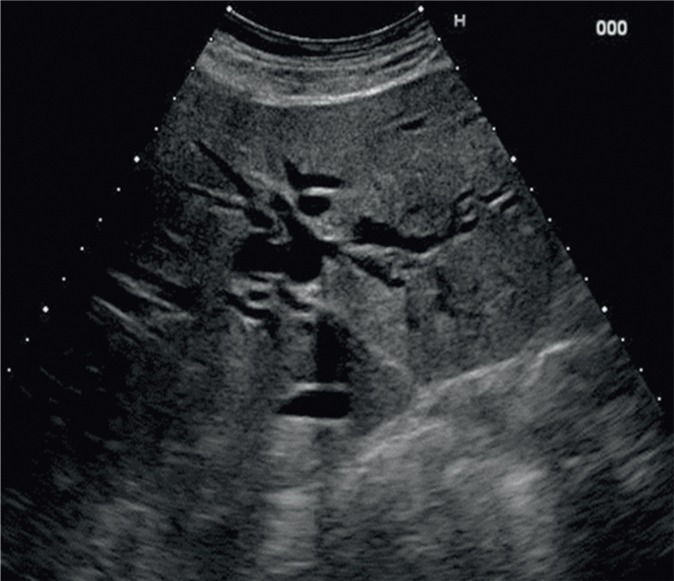
Ultrasound imaging is commonly considered the first-choice method in the diagnostic process of bile duct diseases. They are usually manifested by patency disorders that result in the dilation of the intra- and/or extrahepatic fragments. The width of the common bile duct, which does not exceed 6 mm in healthy individuals, is measured at the crossing with the right hepatic artery. The history of cholecystectomy and advanced age of a patient are associated with greater normal ranges. The diameter of the intrahepatic bile ducts may amount to 2 mm or constitute not more than 40% of the diameter of the accompanying portal vein branch. Biliary dilatation is detected by ultrasonography with the sensitivity of 85–95% (Fig. 12)(47).
Fig. 12.
Dilatation of the intrahepatic bile ducts
The dilatation of the intrahepatic bile ducts is identified with the sensitivity of 92%, and its cause – with the accuracy of 71%(48). The reasons for dilatation vary and are associated with patency impairment (Tab. 5).
Tab. 5.
Reasons for patency disorders of the bile ducts(49)
| Non-neoplastic reasons | Neoplastic reasons | External pressure |
|---|---|---|
| Choledocolithiasis Hemobilia Congenital anomalies of the bile ducts (Caroli disease, inborn bile duct cysts) Purulent cholangitis Parasitic diseases HIV-related cholangiopathy PSC* |
Cholangiocarcinoma Gallbladder cancer Pancreatic cancer Ampulla of Vater carcinoma Metastases |
Mirizzi's syndrome Pancreatitis Lymphadenopathy |
PSC – primary sclerosing cholangitis
The most common pathology is choledocolithiasis. However, the presence of a structural collection does not lead to bile duct dilatation in each case – this happens in merely 50–67% of cases(50). Small collections, with the diameter <5 mm, are particularly troublesome since they do not always have acoustic shadows(48). Of bile duct tumors, which are altogether rare, the most common is cholangiocarcinoma. If the infiltration involves the outflow of the left and right hepatic ducts, the disease is referred to as Klatskin tumor. Cholangiocarcinoma is more common in high-risk groups, including patients with PSC, bile duct cysts and parasitic infections.
Conclusions
Conventional ultrasound imaging remains a valuable tool in the initial diagnosis of liver diseases. It plays an important role in the assessment of liver steatosis and bile duct diseases. Ultrasound techniques enable a reliable assessment of liver fibrosis, and enriching ultrasound imaging with contrast agents allow focal lesions in the liver to be identified and differentiated correctly.
Conflict of interest
Authors do not report any financial or personal links with other persons and organizations, which might affect negatively the content of this publication and/or claim authorship rights to this publication.
References
- 1.Chalasani N, Younossi Z, Lavine JE, Diehl AM, Brunt EM, Cusi K, et al. The diagnosis and management of non-alcoholic fatty liver disease: practice guideline by the American Association for the Study of Liver Diseases, American College of Gastroenterology, and the American Gastroenterological Association. Hepatology. 2012;55:2005–2023. doi: 10.1002/hep.25762. [DOI] [PubMed] [Google Scholar]
- 2.Schwenzer NF, Springer F, Schram C, Stefan N, Machann J, Schick F. Non-invasive assessment and quantification of liver steatosis by ultrasound, computed tomography and magnetic resonance. J Hepatol. 2009;51:433–445. doi: 10.1016/j.jhep.2009.05.023. [DOI] [PubMed] [Google Scholar]
- 3.Sasso M, Miette V, Sandrin L, Beaugrand M. The controlled attenuation parameter (CAP): a novel tool for the non-invasive evaluation of steatosis using FibroScan. Clin Res Hepatol Gastroenterol. 2012;36:13–20. doi: 10.1016/j.clinre.2011.08.001. [DOI] [PubMed] [Google Scholar]
- 4.Matteoni CA, Younossi ZM, Gramlich T, Boparai N, Liu YC, Mc-Cullough AJ. Nonalcoholic fatty liver disease: a spectrum of clinical and pathological severity. Gastroenterology. 1999;116:1413–1419. doi: 10.1016/s0016-5085(99)70506-8. [DOI] [PubMed] [Google Scholar]
- 5.Bravo AA, Sheth SG, Chopra S. Liver biopsy. N Engl J Med. 2001;344:495–500. doi: 10.1056/NEJM200102153440706. [DOI] [PubMed] [Google Scholar]
- 6.Rockey DC, Caldwell SH, Goodman ZD, Nelson RC, Smith AD, American Association for the Study of Liver Diseases Liver biopsy. Hepatology. 2009;49:1017–1044. doi: 10.1002/hep.22742. [DOI] [PubMed] [Google Scholar]
- 7.Tobari M, Hashimoto E, Yatsuji S, Torii N, Shiratori K. Imaging of nonalcoholic steatohepatitis: advantages and pitfalls of ultrasonography and computed tomography. Intern Med. 2009;48:739–746. doi: 10.2169/internalmedicine.48.1869. [DOI] [PubMed] [Google Scholar]
- 8.Mehta SR, Thomas EL, Bell JD, Johnston DG, Taylor-Robinson SD. Non-invasive means of measuring hepatic fat content. World J Gastroenterol. 2008;14:3476–3483. doi: 10.3748/wjg.14.3476. [DOI] [PMC free article] [PubMed] [Google Scholar]
- 9.Gerstenmaier JF, Gibson RN. Ultrasound in chronic liver disease. Insights Imaging. 2014;5:441–455. doi: 10.1007/s13244-014-0336-2. [DOI] [PMC free article] [PubMed] [Google Scholar]
- 10.Walas MK, Skoczylas K, Gierbliński I. Standards of the Polish Ultrasound Society – update. The liver, gallbladder and bile ducts examinations. J Ultrason. 2012;12:428–445. doi: 10.15557/JoU.2012.0031. [DOI] [PMC free article] [PubMed] [Google Scholar]
- 11.Bohte AE, van Werven JR, Bipat S, Stoker J. The diagnostic accuracy of US, CT, MRI and 1H-MRS for the evaluation of hepatic steatosis compared with liver biopsy: a meta-analysis. Eur Radiol. 2011;21:87–97. doi: 10.1007/s00330-010-1905-5. [DOI] [PMC free article] [PubMed] [Google Scholar]
- 12.Borges VF, Diniz AL, Cotrim HP, Rocha HL, Andrade NB. Sonographic hepatorenal ratio: a noninvasive method to diagnose nonalcoholic steatosis. J Clin Ultrasound. 2013;41:18–25. doi: 10.1002/jcu.21994. [DOI] [PubMed] [Google Scholar]
- 13.Marshall RH, Eissa M, Bluth EI, Gulotta PM, Davis NK. Hepatorenal index as an accurate, simple, and effective tool in screening for steatosis. Am J Roentgenol. 2012;199:997–1002. doi: 10.2214/AJR.11.6677. [DOI] [PubMed] [Google Scholar]
- 14.Martín-Rodríguez JL, Arrebola JP, Jiménez-Moleón JJ, Olea N, González-Calvin JL. Sonographic quantification of a hepato-renal index for the assessment of hepatic steatosis in comparison with 3T proton magnetic resonance spectroscopy. Eur J Gastroenterol Hepatol. 2014;26:88–94. doi: 10.1097/MEG.0b013e3283650650. [DOI] [PubMed] [Google Scholar]
- 15.Shen F, Zheng RD, Mi TQ, Wang XY, Pan Q, Chen GY, et al. Controlled attenuation parameter for non-invasive assessment of hepatic steatosis in Chinese patients. World J Gastroenterol. 2014;20:4702–4711. doi: 10.3748/wjg.v20.i16.4702. [DOI] [PMC free article] [PubMed] [Google Scholar]
- 16.Kim JK, Lee KS, Choi JR, Chung HJ, Jung da H, Lee KA, et al. Usefulness of the controlled attenuation parameter for detecting liver steatosis in health checkup examinees. Gut Liver. 2015;9:405–410. doi: 10.5009/gnl14202. [DOI] [PMC free article] [PubMed] [Google Scholar]
- 17.Chon YE, Jung KS, Kim SU, Park JY, Park YN, Kim do Y, et al. Controlled attenuation parameter (CAP) for detection of hepatic steatosis in patients with chronic liver diseases: a prospective study of a native Korean population. Liver Int. 2014;34:102–109. doi: 10.1111/liv.12282. [DOI] [PubMed] [Google Scholar]
- 18.Marrero JA, Ahn J, Rajender Reddy K, American College of Gastroenterology ACG Clinical Guideline: the diagnosis and management of focal liver lesions. Am J Gastroenterol. 2014;109:1328–1347. doi: 10.1038/ajg.2014.213. [DOI] [PubMed] [Google Scholar]
- 19.Marin D, Furlan A, Federle MP, Midiri M, Brancatelli G. Imaging approach for evaluation of focal liver lesions. Clin Gastroenterol Hepatol. 2009;7:624–634. doi: 10.1016/j.cgh.2009.03.024. [DOI] [PubMed] [Google Scholar]
- 20.Robinson PJ. Imaging liver metastases: current limitations and future prospects. Br J Radiol. 2000;73:234–241. doi: 10.1259/bjr.73.867.10817037. [DOI] [PubMed] [Google Scholar]
- 21.Hohmann J, Albrecht T, Hoffmann CW, Wolf KJ. Ultrasonographic detection of focal liver lesions: increased sensitivity and specificity with microbubble contrast agents. Eur J Radiol. 2003;46:147–159. doi: 10.1016/s0720-048x(02)00053-0. [DOI] [PubMed] [Google Scholar]
- 22.Larcos G, Sorokopud H, Berry G, Farrell GC, et al. Sonographic screening for hepatocellular carcinoma in patients with chronic hepatitis or cirrhosis: an evaluation. Am J Roentgenol. 1998;171:433–435. doi: 10.2214/ajr.171.2.9694470. [DOI] [PubMed] [Google Scholar]
- 23.Karhunen PJ. Benign hepatic tumours and tumour like conditions in men. J Clin Pathol. 1986;39:183–188. doi: 10.1136/jcp.39.2.183. [DOI] [PMC free article] [PubMed] [Google Scholar]
- 24.Leen E, Becker D, Bolondi L, Steinbach R, Weskott H, Stacul F, et al. Prospective, open-label, multi-centre study evaluating the accuracy of unenhanced versus SonoVue® enhanced ultrasonography in the characterization of focal liver lesions. Ultrasound Med Biol. 2003;29:1–12. [Google Scholar]
- 25.Harvey CJ, Albrecht T. Ultrasound of focal liver lesions. Eur Radiol. 2001;11:1578–1593. doi: 10.1007/s003300101002. [DOI] [PubMed] [Google Scholar]
- 26.Guang Y, Xie L, Ding H, Cai A, Huang Y. Diagnosis value of focal liver lesions with SonoVue®-enhanced ultrasound compared with contrast-enhanced computed tomography and contrast-enhanced MRI: a meta-analysis. J Cancer Res Clin Oncol. 2011;137:1595–1605. doi: 10.1007/s00432-011-1035-8. [DOI] [PMC free article] [PubMed] [Google Scholar]
- 27.Torzilli G. Adverse effects associated with SonoVue use. Expert Opin Drug Saf. 2005;4:399–401. doi: 10.1517/14740338.4.3.399. [DOI] [PubMed] [Google Scholar]
- 28.Juszczyk J, Boron-Kaczmarska A, Cianciara J, Flisiak R, Gladysz A, Halota W, et al. Zalecenia terapeutyczne na rok 2013: leczenie przeciwwirusowe przewlekłego wirusowego zapalenia wątroby typu B. Przegl Epidemiol. 2013;67:383–391. [PubMed] [Google Scholar]
- 29.EASL Recommendations on Treatment of Hepatitis C 2015. J Hepatol. 2015;63:199–236. doi: 10.1016/j.jhep.2015.03.025. Available from: www.easl.eu/medias/cpg/HEPC-2015/Full-report.pdf. [DOI] [PubMed] [Google Scholar]
- 30.Ellis EL, Mann DA. Clinical evidence for the regression of liver fibrosis. J Hepatol. 2012;56:1171–1180. doi: 10.1016/j.jhep.2011.09.024. [DOI] [PubMed] [Google Scholar]
- 31.Berzigotti A, Castera L. Update on ultrasound imaging of liver fibrosis. J Hepatol. 2013;59:180–182. doi: 10.1016/j.jhep.2012.12.028. [DOI] [PubMed] [Google Scholar]
- 32.Garcia-Tsao G, Sanyal AJ, Grace ND, Carey W, Practice Guidelines Committee of the American Association for the Study of Liver Diseases; Practice Parameters Committee of the American College of Gastroenterology Prevention and management of gastroesophageal varices and variceal hemorrhage in cirrhosis. Hepatology. 2007;46:922–938. doi: 10.1002/hep.21907. [DOI] [PubMed] [Google Scholar]
- 33.European Association for the Study of the Liver; European Organisation for Research and Treatment of Cancer. EASL-EORTC Clinical Practice Guidelines: Management of hepatocellular carcinoma. J Hepatol. 2012;56:1430. doi: 10.1016/j.jhep.2011.12.001. [DOI] [PubMed] [Google Scholar]
- 34.Choong CC, Venkatesh SK, Siew EP. Accuracy of routine clinical ultrasound for staging of liver fibrosis. J Clin Imaging Sci. 2012;2:58. doi: 10.4103/2156-7514.101000. [DOI] [PMC free article] [PubMed] [Google Scholar]
- 35.Colli A, Fraquelli M, Andreoletti M, Marino B, Zuccoli E, Conte D. Severe liver fibrosis or cirrhosis: accuracy of US for detection – analysis of 300 cases. Radiology. 2003;227:89–94. doi: 10.1148/radiol.2272020193. [DOI] [PubMed] [Google Scholar]
- 36.Sudhamshu KC, Sharma D, Chataut SP. Hepatic vein waveforms in liver cirrhosis re-evaluated. Hepatol Int. 2011;5:581–585. doi: 10.1007/s12072-010-9226-y. [DOI] [PMC free article] [PubMed] [Google Scholar]
- 37.Bota S, Herkner H, Sporea I, Salzl P, Sirli R, Neghina AM, et al. Metaanalysis: ARFI elastography versus transient elastography for the evaluation of liver fibrosis. Liver Int. 2013;33:1138–1147. doi: 10.1111/liv.12240. [DOI] [PubMed] [Google Scholar]
- 38.Ferraioli G, Tinelli C, Dal Bello B, Zicchetti M, Filice G, Filice C, et al. Accuracy of real-time shear wave elastography for assessing liver fibrosis in chronic hepatitis C: a pilot study. Hepatology. 2012;56:2125–2133. doi: 10.1002/hep.25936. [DOI] [PubMed] [Google Scholar]
- 39.Linguraru MG, Sandberg JK, Jones EC, Petrick N, Summers RM. Assessing hepatomegaly: automated volumetric analysis of the liver. Acad Radiol. 2012;19:588–598. doi: 10.1016/j.acra.2012.01.015. [DOI] [PMC free article] [PubMed] [Google Scholar]
- 40.Talley NJ, O'Connor S. Clinical Examination: A Systematic Guide to Physical Diagnosis. Sydney: Churchill Livingstone Elsevier; 2007. [Google Scholar]
- 41.Douglas G, Nicol F, Robertson C. Macleod's Clinical Examination. Edinburgh: Churchill Livingstone Elsevier; 2009. [Google Scholar]
- 42.Tchelepi H, Ralls PW, Radin R, Grant E. Sonography of diffuse liver disease. J Ultrasound Med. 2002;21:1023–1032. doi: 10.7863/jum.2002.21.9.1023. [DOI] [PubMed] [Google Scholar]
- 43.Giorgio A, Amoroso P, Fico P, Lettieri G, Finelli L, de Stefano G, et al. Ultrasound evaluation of uncomplicated and complicated acute viral hepatitis. J Clin Ultrasound. 1986;14:675–679. doi: 10.1002/jcu.1870140903. [DOI] [PubMed] [Google Scholar]
- 44.Krishnan M, Middleton WD. Ultrasonographic evaluation of right upper quadrant pain in emergency departments. Ultrasound Clin. 2011;6:149–161. [Google Scholar]
- 45.Yarmish GM, Smith MP, Rosen MP, Baker ME, Blake MA, Cash BD, et al. American College of Radiology Appropriateness Criteria: RUQ Pain. J Am Coll Radiol. 2014;11:316–322. doi: 10.1016/j.jacr.2013.11.017. [DOI] [PMC free article] [PubMed] [Google Scholar]
- 46.Ahmed F, Fogel EL. Right upper quadrant pain and a normal abdominal ultrasound. Clin Gastroenterol Hepatol. 2008;6:1198–1201. doi: 10.1016/j.cgh.2008.06.020. [DOI] [PubMed] [Google Scholar]
- 47.Yarmenitis SD. Ultrasound of the gallbladder and the biliary tree. Eur Radiol. 2002;12:270–282. doi: 10.1007/s00330-001-1251-8. [DOI] [PubMed] [Google Scholar]
- 48.Rubens DJ. Ultrasound imaging of the biliary tract. Ultrasound Clin. 2007;2:391–413. [Google Scholar]
- 49.Rumack CM, Wilson SR, Charboneau JW, Levine D, editors. Diagnostic Ultrasound. St. Louis: Mosby; 2011. [Google Scholar]
- 50.Hunt DR. Common bile duct stones in non-dilated bile ducts? An ultrasound study. Australas Radiol. 1996;40:221–222. doi: 10.1111/j.1440-1673.1996.tb00389.x. [DOI] [PubMed] [Google Scholar]


