

Abstract
Objective
To compare results of obese patients with knee osteoarthritis (OA) who, after an intensive weight loss regimen, received 1 year of either dietary support (D), a knee-exercise program (E), or “no attention” (C; control group).
Methods
We conducted a randomized, 2-phase, parallel-group trial. A total of 192 obese participants with knee OA were enrolled; the mean age was 62.5 years and 81% were women with a mean entry weight of 103.2 kg. In phase 1, all participants were randomly assigned to 1 of 3 groups and began a dietary regimen of 400–810 and 1,250 kcal/day for 16 weeks (2 8-week phases) to achieve a major weight loss. Phase 2 consisted of 52 weeks' maintenance in either group D, E, or C. Outcomes were changes from randomization in pain on a 100-mm visual analog scale, weight, and response according to the Outcome Measures in Rheumatology-Osteoarthritis Research Society International criteria.
Results
Mean weight loss for phase 1 was 12.8 kg. After 1 year on maintenance therapy, the D group sustained a lower weight (11.0 kg, 95% confidence interval [95% CI] 9.0, 12.8 kg) than those in the E (6.2, 95% CI 4.4, 8.1 kg) and C (8.2, 95% CI 6.4, 10.1 kg) groups (P = 0.002 by analysis of covariance [ANCOVA]). Adherence was low in the E group. All groups had statistically significant pain reduction (D: 6.1; E: 5.6; and C: 5.5 mm) with no difference between groups (P = 0.98 by ANCOVA). In each group 32 (50%), 26 (41%), and 33 (52%) participants responded to treatment in the D, E, and C groups, respectively, with no statistically significant difference in the number of responders (P = 0.41).
Conclusion
A significant weight reduction with a 1-year maintenance program improves knee OA symptoms irrespective of maintenance program.
INTRODUCTION
Osteoarthritis (OA) is the most common joint disease. Currently, OA affects more than 20 million Americans, and this number is expected to double over the next 2 decades 1,2. In Britain, a study of those age ≥85 years showed that 52% were affected by OA 3. Risk factors include obesity, injuries, surgery, and occupational load 4,5. Obesity and OA share pathogenic features; the development of one disease increases the risk of the other 6–8. As the average weight of the population increases, severe health consequences will ensue 9. The burden of obesity includes an increased number of nonfatal diseases, including OA imposing substantial medical costs from treatment and productivity losses 10. Accordingly, obesity must be taken seriously in any discussion of health 11, including that of the joints 2,10.
Current treatments can effectively target obesity in patients with coexistent obesity and OA, with short-term efficacy of weight loss comparable to that of a joint replacement 12. A meta-regression analysis showed that function in obese knee OA patients could be significantly improved when weight was reduced more than 5.1%, at the rate of 0.24% per week, indicating that physical function of overweight patients with knee OA improves even after a moderate weight reduction regimen 13. Accordingly, the Osteoarthritis Research Society International (OARSI) guidelines strongly recommended that overweight OA patients with lower extremity OA lose weight and maintain a lower weight level 14–16.
There are no definitive data on whether weight loss is beneficial for reducing OA progression 17. However, available results from different study designs support the notion that intensive dietary-induced weight loss and exercise interventions may slow disease progression 8. Weight loss may be induced by using a low-energy diet strategy 18. Continuous dietary counseling is recommended to maintain weight loss, but in OA patients reinforcements of other activities for pain and disability improvement after weight loss may also be desirable. Exercise is recommended to improve pain and disability 19; exercise is also recommended as a means of losing weight and maintaining weight loss in the general population when it is combined with dietary change 20. Weight loss and exercise for obese OA patients are recommended by most guidelines 21. However, the effects of continuous dietary counseling and exercise on weight loss maintenance and clinical outcomes remain to be clarified.
This study aimed to compare the symptomatic outcomes of 1) one year of continuous dietary support from a dietician, and 2) one year of a specialized knee exercise program with 3) a “no attention” control group, all after an initial 16-week weight loss program to obtain a clinically significant weight loss in obese knee OA patients.
Significance & Innovations.
This study is important in the sequence required to provide the evidence base for justifying weight loss and maintenance in osteoarthritis (OA) management.
This trial showed that following an intensive 16-week dietary weight loss run-in program, pain reduction was maintained similarly in all groups with no difference between continuous dietary consultancy, knee exercises, and no treatment.
Compliance with the dietary program was better than with the knee-exercises program; the obese with knee OA could not be induced to exercise as instructed. A dietary program with partial use of formula diet and dietitian support may prevent subsequent weight gain for up to 1 year.
Diet and knee exercises both result in maintenance of the primary outcome (symptoms) and the choice of one or the other has to be based on other factors, e.g., patient preferences.
PATIENTS AND METHODS
Trial design and participants
The CAROT study (Influence of Weight Loss or Exercise on Cartilage in Obese Knee Osteoarthritis Patients Trial) was designed as a pragmatic randomized controlled trial with blinded outcome assessors. Participants were prescreened via telephone using a series of standard questions concerning eligibility and recruited November 2007 through August 2008 at the Department of Rheumatology, Frederiksberg Hospital, Denmark. The inclusion and exclusion criteria for the study attempted to ensure that the therapy would exclude as few participants as possible from participation and would be directly relevant to health care practitioners 22. Individuals age ≥50 years and above with confirmed knee OA based on clinical symptoms, including pain, and on standing radiographs in at least 1 joint compartment were eligible for inclusion 23. All participants were obese, as defined by a body mass index (BMI) ≥30 kg/m2. Participants were excluded if they had any of the following: lack of motivation to lose weight, inability to speak Danish, planned antiobesity surgery, total knee alloplasty (TKA), or receiving pharmacologic therapy for obesity. In the case of both knees having OA symptoms, the worst knee was defined as the index knee and participants asked to concentrate their answers accordingly. Participants were asked not to change any medication or nutritional supplements during the study. All participants gave written informed consent for the study, which was approved by the ethics committee of the Capital Region of Denmark [H-B-2007-088] and registered with ClinicalTrials.gov (NCT00655941). The procedures followed were in accordance with the ethical standards of the responsible committee on human experimentation (institutional and national) and with the Helsinki Declaration of 1975, as revised in 2000.
Randomization and allocation concealment
All participants entered an initial 16-week intensive dietary therapy, inducing a major weight loss 24–27, after which participants were informed about the group allocation over the following 52 weeks; patients were randomly assigned with the use of minimization to one of 3 subsequent treatment groups with an equal allocation ratio (1:1:1) 28,29. The participants were stratified according to sex, body weight at baseline, and weight loss (first 8 weeks of phase 1). The concealed allocation was done on the basis of all the participants entering the study at baseline. Each randomization list was drawn up by the biostatistician (RC) and given to the secretariat at the Parker Institute who subsequently informed the participant where to meet in the maintenance period, securing a concealed allocation. The random assignment prevented knowledge of forthcoming allocations by study participants and personnel recruiting participants to the trial.
Interventions
Initially, all participants went through a 16-week intensive dietary weight loss intervention, which has been described in detail previously (see Supplementary Appendix A, available in the online version of this article at http://onlinelibrary.wiley.com/doi/10.1002/acr.22504/abstract) 25.
Dietary program
The objective of the 1-year trial weight loss maintenance program was to focus on long-term lifestyle modifications and help participants reach their weight loss goals. During the year-long maintenance phase, the participants met weekly at the dietary unit at the Parker Institute, attending sessions that lasted approximately 1 hour (1 session per week, for a total 52 possible sessions). The participants were weighed, and formula products were handed out. Participants were advised to use 1 formula product a day to enhance weight loss 30. They could choose between a liquid shake and a snack bar, which were provided free of charge by the manufacturer (The Cambridge Weight Plan) 31. Details of the visits are given in Supplementary Appendix B (available in the online version of this article at http://onlinelibrary.wiley.com/doi/10.1002/acr.22504/abstract).
Exercise program
Participants underwent a 3-day/week exercise program consisting of a warm-up phase (10 minutes), a circuit-training phase (45 minutes), and a cool down/stretching phase (5 minutes). The exercise intervention was divided into 4 periods of 12 weeks and 1 period of 4 weeks (total 52 weeks). The idea was to gradually translate the exercise from supervised facility-based exercises to unsupervised home-based exercises. Details of the exercise program are given in Supplementary Appendices A and B, available in the online version of this article at http://onlinelibrary.wiley.com/doi/10.1002/acr.22504/abstract).
Control group program
The control group served as a usual care comparison group and no attention was provided to the participants after the first 16 weeks of therapy. However, all patients allocated to this group were informed that they would be contacted after 52 weeks and would then have an option to enter another active intervention program, i.e., the LIGHT (long-term intervention with group-wise dietary consulting supported by meal replacements maintaing weight loss in patients with concomitant obesity and knee osteoarthritis) study (NCT00938808).
Outcome measures
The co-primary outcome of this trial was the patients' self-reported pain on a 100-mm visual analog scale (VAS) and the number of patients responding according to the Outcome Measures in Rheumatology (OMERACT)–OARSI responder criteria 32. The 3 items of the OMERACT-OARSI responder criteria were assessed using 100-mm VAS with separate results for pain, disability, and global evaluation by the patient. The secondary outcomes were other patient-reported outcomes for symptoms of knee OA, as perceived by patients prior to and after intervention (weeks 0, 16, and 68), obtained via the 5 subscales of the Knee injury and Osteoarthritis Outcome Score (KOOS) questionnaires 33; the 5 subscales are pain, other symptoms, function in daily living, function in sport and recreation, and knee-related quality of life. The KOOS subscales are normalized, with 100 indicating no knee problems and 0 indicating extreme knee problems 33. At all time points, the participants also reported health-related quality of life 34 using the Short-Form 36 (SF-36) health survey 35. From the taxonomy of the SF-36, having 3 levels, our objective was to explore the third level, with 2 summary measures that aggregate scales: the physical component summary and the mental component summary measure 36. We applied the Danish version of the SF-36 health survey 37.
Radiographs, anthropometry, and gait speed
Bi-plane, weight-bearing, semiflexed nonfluoroscopic radiographs were taken of both knees at a 15° knee flexion at baseline and at 68 weeks. Body composition was evaluated by full body dual x-ray absorptiometry [DXA] scans (LUNAR DPX-IQ, Lunar Corporation). Physical function was assessed by the 6-minute walk test (6MW) 38, which was performed indoors on a predefined 100-meter route. The patients walked the route as many times as possible in 6 minutes (i.e., at maximal speed). Results of the 6MW test were recorded as meters covered in 6 minutes.
Adverse events
Adverse events were noted using nonleading questions at all clinic visits, including at baseline. All events were coded according to the Medical Dictionary for Regulatory Activities as currently required by all regulatory authorities, including the US Food and Drug Administration and the European Agency for the Evaluation of Medicinal Products. Routine laboratory tests, including measurement of serum glucose levels for estimating effects on glucose homeostasis and administration of liver function tests, were performed at baseline and together with each of the subsequent outcome assessments (i.e., at weeks 8, 16, and 68).
Statistical analysis
CAROT was designed as a superiority trial. The sample size was calculated to detect differences between the 2 maintenance groups after 68 weeks, corresponding to a moderate effect size in the VAS pain scores for the pairwise comparison of the control group with each of the 2 competing maintenance regimens. A sample size of 64 per group would be required to obtain a power of at least 80% to detect a mean difference of 12.5 mm by VAS. Therefore, the 192 knee OA patients were included in the intent-to-treat (ITT) population (see Supplementary Appendix A, available in the online version of this article at http://onlinelibrary.wiley.com/doi/10.1002/acr.22504/abstract). All confirmatory data analyses were carried out according to a prespecified analysis plan. Analyses were done applying SAS software (version 9.2). At week 68, the diet or exercise groups were compared with the control group by analyses of covariance (ANCOVA) for mean changes from baseline in all the continuous outcome data. The model included the change as the dependent variable, with treatment group as a main effect and the baseline score as an additional covariate. The proportion of patients responding to therapy (OMERACT-OARSI and >10% weight loss) and those reporting adverse events were analyzed; the chi-square test was performed to evaluate the differences between the diet, exercise, and control groups.
The ITT population was defined as all individuals entering the initial weight loss phase. To preserve the ITT population, missing data were replaced using the baseline observation carried forward technique, an imputation technique considered conservative in weight loss trials even if data are not missing at random 39. This assumption would imply, for symptom scores, that the patients had no improvement from entering the study (i.e., a conservative estimate). Further, we elaborated on different scenarios, for the purpose of sensitivity analyses, using different aspects of analysis populations and imputation techniques to see if the results were robust to different (plausible) assumptions about the missing data 40. The estimates corresponding to the “as observed population” are available in Supplementary Appendix C (available in the online version of this article at http://onlinelibrary.wiley.com/doi/10.1002/acr.22504/abstract).
RESULTS
Participant flow and characteristics
The total number of persons pre-screened via telephone during the 9 months recruitment period was 388 (Figure 1). Of these, 187 (48%) were ineligible, and 9 (2%) declined to participate at the screening visit. The patient characteristics of the 192 individuals included as the ITT population are presented in Table1. The typical participant was a 62-year-old woman, with a BMI of 37 kg/m2, representing 25–30 kg of excess body weight. Table1 also shows the Kellgren/Lawrence scores and the KOOS scores of the participants. Of the 192 patients, 170 (89%) had bilateral knee OA, with 21 (12%) having a TKA on the contralateral knee. Of the 192 patients being randomized, 175 (91%) completed the study of the first (16-week) phase 24. The 17 study participants who did not complete the first phase of the study were not different from those who remained in terms of age, sex, BMI, initial radiographic score, knee pain, or physical function 24. During the following 1-year symptom and weight maintenance program, 16 of the 175 patients (9.1%) who had completed the first phase dropped out of the study (Figure 1). The dropout rate was significantly lower in the D group that was assigned the diet maintenance program (1 patient of 56, 1.8%) than in participants assigned to the C group (control group) program (9 patients of 61, 14.8%; P = 0.0078) and the E group (exercise maintenance) program (6 patients of 58, 10.3%; P = 0.050). There was an overall completion rate in favor of the dietary maintenance program when comparing the attrition rate in the 3 groups (χ2 = 6.06, 2 df, P = 0.048).
Figure 1.
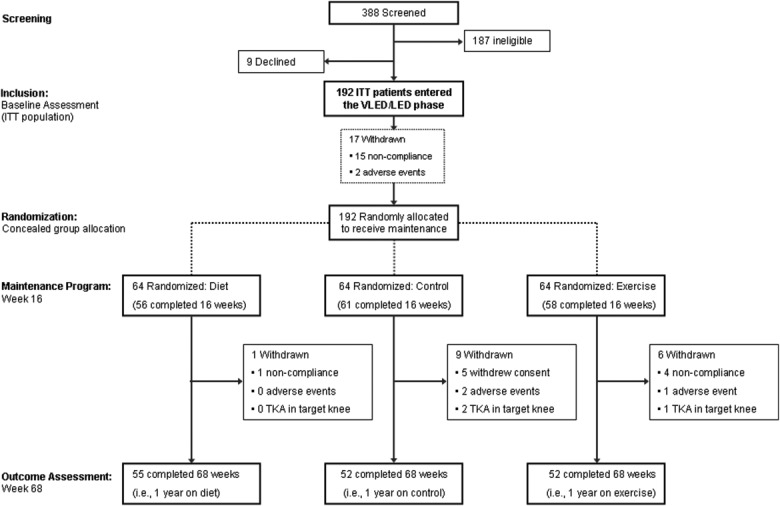
Study flow diagram of enrollment, randomization, and followup. Ineligibility at screening was mostly due to young age or too low body mass index for participation. ITT = intent-to-treat; VLED = very low energy diet; LED = low energy diet; TKA = total knee arthroplasty.
Table 1.
Baseline characteristics of the patients*
| Variable | Control (n = 64) | Diet (n = 64) | Exercise (n = 64) | |||
|---|---|---|---|---|---|---|
| Age, years | 61.7 ± 6.8 | 63.0 ± 6.5 | 62.9 ± 5.8 | |||
| Female sex, no. (%) | 51 (80) | 52 (81) | 52 (81) | |||
| Height | 166 ± 9 | 166 ± 8 | 166 ± 8 | |||
| Duration of OA symptoms, median (IQR) years | 8.0 (4.5–13.0) | 8.0 (3.8–10.0) | 9.5 (4.8–15.0) | |||
| K/L radiographic reading, no. (%) | ||||||
| I | 4 (6) | 3 (5) | 10 (16) | |||
| II | 24 (38) | 24 (39) | 23 (36) | |||
| III | 25 (39) | 22 (35) | 21 (33) | |||
| IV | 11 (17) | 13 (21) | 10 (16) | |||
| K/L radiographic reading, 0–4 | 2.7 ± 0.8 | 2.7 ± 0.9 | 2.5 ± 0.9 | |||
| Joint space width, median (IQR) mm† | 2.0 (0.0–3.6) | 2.5 (0.0–3.8) | 2.6 (0.0–3.8) | |||
| Anthropometric and gait speed variables | ||||||
| Body weight, kg | 105.0 ± 16.1 | 103.6 ± 14.8 | 101.0 ± 14.0 | |||
| Body mass index, kg/m2 | 37.9 ± 5.3 | 37.6 ± 4.5 | 36.5 ± 4.4 | |||
| Lean body mass, gm | 51,309.3 ± 9,348.4 | 51,053.2 ± 8,447.0 | 50,266.0 ± 8,511.1 | |||
| Fat mass, gm | 48,028.4 ± 10,381.3 | 47,353.3 ± 9,233.7 | 45,748.5 ± 9,107.5 | |||
| Six-minute walk, meters | 443.19 ± 91.44 | 439.87 ± 74.60 | 446.92 ± 94.27 | |||
| KOOS, 0–100‡ | ||||||
| Pain | 54.3 ± 16.2 | 59.1 ± 15.7 | 58.5 ± 16.3 | |||
| Symptoms | 58.8 ± 18.1 | 62.0 ± 15.0 | 61.3 ± 18.1 | |||
| Function in daily living | 58.3 ± 16.6 | 60.9 ± 18.7 | 60.5 ± 17.0 | |||
| Function in sport and recreation | 22.1 ± 19.4 | 21.3 ± 18.7 | 24.5 ± 21.6 | |||
| Knee-related quality of life | 36.1 ± 15.3 | 38.4 ± 16.8 | 40.0 ± 17.3 | |||
| Questions applicable for OMERACT-OARSI response§ | ||||||
| VAS pain, 0–100 | 46.7 ± 19.7 | 39.5 ± 21.3 | 43.6 ± 20.0 | |||
| VAS disability, 0–100 | 47.7 ± 21.9 | 42.1 ± 23.4 | 41.5 ± 21.8 | |||
| VAS patient global assessment, 0–100 | 37.3 ± 24.3 | 32.0 ± 21.9 | 34.0 ± 22.9 | |||
| SF-36 health survey | ||||||
| Mental component summary, 0–100 | 52.4 ± 13.3 | 54.7 ± 11.2 | 53.2 ± 10.4 | |||
| Physical component summary, 0–100 | 33.5 ± 9.0 | 33.7 ± 8.1 | 34.1 ± 9.1 | |||
Values are the mean ± SD unless indicated otherwise. OA = osteoarthritis; IQR = interquartile range; K/L = Kellgren/Lawrence; KOOS = Knee Injury and Osteoarthritis Outcome Score; OMERACT = Outcome Measures in Rheumatology; OARSI = Osteoarthritis Research Society International; VAS = visual analog scale; SF-36 = Short Form 36 health survey.
For joint space width there were a number of images that were not possible to evaluate; estimates are based on n = 61 for control, n = 53 for diet, and n = 59 for exercise.
Lower scores indicate more severe disease.
Higher scores indicate more severe disease.
Changes in body weight and compliance to therapy
As presented in Figure 2, all 3 randomized groups from the ITT population, but especially the D group, succeeded in maintaining weight loss after 1 year of maintenance therapy. Group D, which underwent the continuous dietary maintenance program, had an average weight change at 68 weeks from baseline of −11.0 kg (95% confidence interval [95% CI] −12.8, −9.1 kg), whereas the weight change in the exercise group was −6.2 kg (95% CI −8.1, −4.4 kg), and the control group had an average weight change of −8.2 kg (95% CI −10.1, −6.4 kg) (see Table2). This comparison is illustrated in Figure 2, with a statistically significant interaction between group and time (P < 0.0001). After 68 weeks, the dietary maintenance program was more effective in maintaining lower body weight than both the exercise group (difference −4.7 kg [−7.4, −2.1 kg]; P = 0.0005) and the control group (difference −2.7 kg [−5.4, −0.1 kg]; P = 0.043). There was no statistically significant difference between the exercise and control groups (P = 0.14). In terms of weight loss responders, there was also a statistically significant difference between groups (P = 0.002); more patients randomized to the dietary maintenance program successfully lost more than 10% of their body weight from baseline (55% [42–67%]), than did the exercise group (27% [16–37%]; P = 0.00072) and the control group (31% [20–43%]; P = 0.0058).
Figure 2.
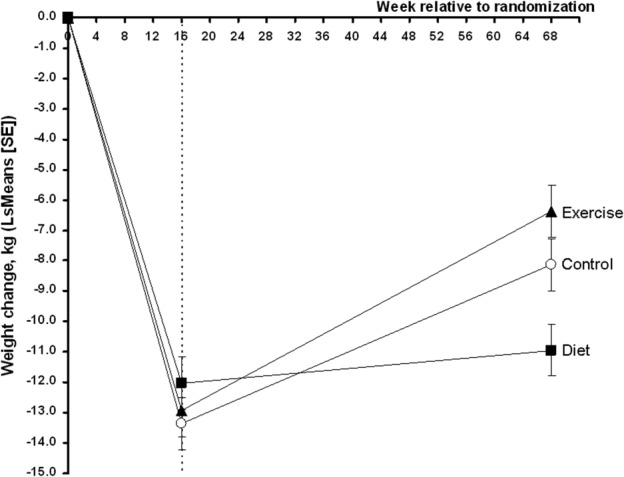
Changes in body weight over time were explored using a repeated-measures analysis of covariance (via PROC MIXED): a factor for group, a factor for time, and a factor for the interaction between them. The outcome at baseline was applied as covariate. Values are least squares (LS) means and error bars indicate SE of the LS means.
Table 2.
Change in outcome measures from baseline at 68 weeks*
| Outcome variable | Control (n = 64) | Diet (n = 64) | Exercise (n = 64) | P |
|---|---|---|---|---|
| OMERACT-OARSI response, no. (%) | 33 (52) | 32(50) | 26(41) | 0.407 |
| VAS pain, mm | −5.5 (−10.5, −0.5) | −6.1 (−11.1, −1.1) | −5.6 (−10.5, −0.6) | 0.982 |
| VAS disability, mm | −9.0 (−14.4, −3.6) | −7.5 (−12.8, −2.1) | −7.6 (−13.0, −2.2) | 0.910 |
| VAS patient global assessment, mm | −6.1 (−11.1, −1.1) | −5.1 (−10.1−0.1) | −4.6 (−9.6, 0.4) | 0.916 |
| Weight change, kg | −8.23 (−10.09, −6.36) | −10.96 (−12.83, −9.09) | −6.24 (−8.11, −4.38) | 0.002 |
| Weight change, % change from baseline | −7.84 (−9.59, −6.10) | −10.79 (−12.53, −9.05) | −6.17 (−7.91, −4.42) | 0.001 |
| Major weight loss (>10%), no. (%) | 20 (31) | 35 (55) | 17 (27) | 0.002 |
| Body mass index, kg/m2 | −2.9 (−3.6, −2.2) | −4.0 (−4.7, −3.3) | −2.3 (−3.0, −1.6) | 0.003 |
| Lean body mass, gm | −1,168.9 (−1,614.7, −723.1) | −1,010.3 (−1,455.9, −564.7) | −873.7 (−1,323.2, −424.2) | 0.655 |
| Fat mass, gm | −5,978.1 (−7,564.9, 4,391.4) | −8,984.9 (−10,569.0, −7,400.7) | −4,796.6 (−6,398.0, −3,195.3) | 0.001 |
| Six-minute walk, meters | 22.89 (7.900, 37.889) | 37.519 (22.757, 52.281) | 38.478 (23.715, 53.240) | 0.266 |
| Joint space width, mm† | 0.0 (−0.1, 0.1) | −0.1 (−0.2, 0.1) | −0.1 (−0.3, 0.0) | 0.543 |
| Joint space width, median (IQR) mm‡ | 0.0 (0.0–0.1) | 0.0 (−0.1, 0.1) | 0.0 (0.0, 0.0) | 0.651 |
| KOOS, score 0–100§ | ||||
| Pain | 8.7 (4.9, 12.4) | 7.6 (3.8, 11.3) | 6.8 (3.1, 10.5) | 0.791 |
| Symptoms | 5.9 (2.2, 9.6) | 7.4 (3.6, 11.1) | 4.5 (0.8, 8.2) | 0.565 |
| Function in daily living | 6.2 (2.7, 9.8) | 8.3 (4.7, 11.8) | 8.4 (4.8, 11.9) | 0.640 |
| Function in sport and recreation | 4.7 (0.3, 9.1) | 5.8 (1.4, 10.2) | 6.4 (2.0, 10.8) | 0.860 |
| Knee-related quality of life | 5.4 (1.7, 9.2) | 8.2 (4.5, 11.9) | 5.8 (2.1, 9.5) | 0.538 |
| Short-Form 36¶ | ||||
| Mental component summary | 1.3 (−0.5, 3.2) | −0.3 (−2.1, 1.6) | 0.1 (−1.7, 2.0) | 0.455 |
| Physical component summary | 4.4 (2.5, 6.4) | 5.5 (3.5, 7.4) | 3.8 (1.9, 5.7) | 0.472 |
Values for the continuous data are the least squares mean (95% confidence interval), for the measured change from baseline to the followup assessment. Dichotomous data were analyzed using chi-square statistics. Data were analyzed using analysis of covariance: a factor for group, and the outcome variable at baseline was applied as covariate.
For joint space width there were a number of images that were not possible to evaluate; estimates are based on n = 61 for control, n = 53 for diet, and n = 59 for exercise.
Analyzed using a 1-factor analysis of variance with rank scores in each group.
A normalized score (100 indicating no symptoms and 0 indicating extreme symptoms).
A normalized score (100 indicates best health outcome and 0 indicates very poor health outcome).
During the 52 weeks, the median number of attendances at the dietary session was 32 of 52 possible (61.5%), whereas medical compliance with the facility-based exercise sessions was 7 attendances of 52 possible (13.5%). The median-reported, home-based exercise completion was 4 of 109 anticipated home sessions (4%).
Outcome measures
Across groups, all patients had a reduction in VAS pain after 68 weeks (P < 0.03; within group analyses) independently of the group to which they were randomized to follow after the 16 weeks of clinically significant changes 24. There were, however, no differences in pain reduction between groups (P = 0.98 by ANCOVA). Table2 presents data for the pain reduction in the VAS (mm) after 68 weeks in the diet group (−6.1 mm [95% CI −11.1, −1.1 mm]), the exercise group (−5.6 mm [95% CI −10.5, −0.6 mm]), and the control group (95% CI −5.5 mm [−10.5, −0.5 mm]). As indicated from the overall ANCOVA, there was no difference between any of the groups after 68 weeks (P > 0.86). The observed OMERACT-OARSI success rates were 50% (38–62%) for the diet group, 41% (29–53%) for the exercise group, and 52% (39–64%) for the control group (Table2). The OMERACT-OARSI response rates were successfully maintained across groups, which may be part of the reason for lack of statistically significant difference between the groups (P = 0.41).
Secondary outcomes and adverse events
The occurrence of radiographic progression was assessed from the change in joint space width (i.e., joint space narrowing) after 68 weeks. Only paired images fully valid for interpretation by decision of the radiologist were analyzed, without any statistically significant differences between groups. Among all the other secondary outcomes, some were explored in more detail according to the prespecified statistical analysis plan. When we explored in greater depth the differences in weight loss across groups (P = 0.002 by ANCOVA), this finding was supported by the anthropometric measures from DXA scans of whole body composition in terms of loss of fat mass (P = 0.001 by ANCOVA), but not in loss of lean body mass (P = 0.65 by ANCOVA). The diet group lost significantly more fat mass than did both the control group (−3006.8 gm [−5247.7, −765.8 gm]; P = 0.0088) and the exercise group (−4188.2 gm [−1934.0, −6442.4 gm]; P = 0.0003). In contrast, there was no statistically significant difference in loss of fat mass between the exercise and control groups (P = 0.30). As presented in Table2, there was no statistical difference between the loss in lean body mass between the diet and control groups (P = 0.62), diet and exercise groups (P = 0.67), or exercise and control groups (P = 0.36). Table3 presents all the adverse events, from mild to moderate, reported in each group from week 16 through week 68. No clinically important events or changes in laboratory tests were seen in any of the groups (data not shown).
Table 3.
Adverse events among patients reporting on various constructs of potential side effects after 68 weeks
| Control | Diet | Exercise | ||||||||
|---|---|---|---|---|---|---|---|---|---|---|
| Variable | No. | Count | % | No. | Count | % | No. | Count | % | P* |
| Abdominal and intestinal symptoms | ||||||||||
| Nausea | 52 | 1 | 2 | 55 | 3 | 5 | 52 | 8 | 15 | 0.036† |
| Diarrhea | 51 | 4 | 8 | 55 | 3 | 5 | 52 | 6 | 12 | 0.512† |
| Constipation | 52 | 8 | 15 | 55 | 9 | 16 | 52 | 7 | 13 | 0.914 |
| Flatulence | 52 | 14 | 27 | 55 | 19 | 35 | 52 | 10 | 19 | 0.204 |
| Epigastric pain | 52 | 1 | 2 | 55 | 6 | 11 | 52 | 7 | 13 | 0.082† |
| Vomiting | 52 | 1 | 2 | 55 | 3 | 5 | 52 | 4 | 8 | 0.444† |
| Abdominal pain | 52 | 3 | 6 | 55 | 6 | 11 | 52 | 6 | 12 | 0.622† |
| Heartburn | 51 | 3 | 6 | 55 | 3 | 5 | 52 | 9 | 17 | 0.083† |
| Biliary symptoms | 52 | 0 | 0 | 54 | 2 | 4 | 51 | 4 | 8 | 0.103† |
| Musculoskeletal symptoms | ||||||||||
| Cramps | 49 | 8 | 16 | 54 | 6 | 11 | 52 | 7 | 13 | 0.742 |
| Joint pain | 51 | 12 | 24 | 55 | 15 | 27 | 52 | 12 | 23 | 0.858 |
| Back pain | 50 | 10 | 20 | 54 | 11 | 20 | 52 | 6 | 12 | 0.403 |
| Swollen joints | 51 | 11 | 22 | 55 | 11 | 20 | 52 | 10 | 19 | 0.956 |
| Sciatic pain | 51 | 9 | 18 | 55 | 4 | 7 | 52 | 7 | 13 | 0.270 |
| Central nervous system and psychiatric symptoms | ||||||||||
| Dizziness | 52 | 8 | 15 | 55 | 7 | 13 | 52 | 10 | 19 | 0.651 |
| Headache | 52 | 5 | 10 | 53 | 6 | 11 | 51 | 12 | 24 | 0.095 |
| Anxiety | 52 | 2 | 4 | 53 | 3 | 6 | 50 | 5 | 10 | 0.427† |
| Sleeplessness | 52 | 11 | 21 | 53 | 6 | 11 | 51 | 11 | 22 | 0.302 |
| Fatigue | 52 | 12 | 23 | 53 | 8 | 15 | 51 | 13 | 25 | 0.395 |
| Mood changes | 52 | 5 | 10 | 53 | 5 | 9 | 51 | 13 | 25 | 0.031 |
| Depressive tendencies | 52 | 4 | 8 | 53 | 6 | 11 | 51 | 5 | 10 | 0.818 |
| Skin and subcutaneous symptoms | ||||||||||
| Dry skin | 52 | 6 | 12 | 53 | 4 | 8 | 51 | 6 | 12 | 0.726 |
| Allergic rash | 52 | 4 | 8 | 53 | 5 | 9 | 51 | 7 | 14 | 0.584 |
| Redness | 52 | 2 | 4 | 53 | 4 | 8 | 51 | 7 | 14 | 0.176† |
| Eczema | 51 | 3 | 6 | 53 | 4 | 8 | 51 | 5 | 10 | 0.814† |
| Perianal itching | 52 | 2 | 4 | 53 | 5 | 9 | 51 | 11 | 22 | 0.016 |
| Skin irritation | 52 | 3 | 6 | 53 | 5 | 9 | 51 | 8 | 16 | 0.245 |
| Urticaria | 52 | 1 | 2 | 52 | 3 | 6 | 51 | 3 | 6 | 0.634† |
| Miscellaneous symptoms | ||||||||||
| Sensitive to cold | 52 | 6 | 12 | 53 | 9 | 17 | 51 | 8 | 16 | 0.715 |
| Influenza | 52 | 2 | 4 | 53 | 7 | 13 | 51 | 5 | 10 | 0.232† |
| Hair loss | 52 | 2 | 4 | 53 | 5 | 9 | 51 | 7 | 14 | 0.217† |
| Bad breath | 52 | 5 | 10 | 53 | 6 | 11 | 51 | 9 | 18 | 0.439 |
| Toothache | 52 | 4 | 8 | 52 | 4 | 8 | 51 | 6 | 12 | 0.732† |
Analyzed using chi-square test (4df).
Analyzed using Fisher's exact test when cells had counts <5.
DISCUSSION
In this study of obese knee OA patients, those who were assigned to the dietary intervention regained less weight over a 12-month period than did those assigned to the control group and to the exercise-based intervention. This finding confirms the feasibility of long-term weight loss maintenance in sedentary individuals, in this case patients with mobility limitations due to knee OA. However, no symptomatic superiority could be demonstrated, as the maintenance therapies were equally good on our primary outcome. Therefore, the effect of the run-in phase with a 16-week educational effort 24 appeared to last throughout the following year, whatever the subsequent group allocation. As a motivating factor, all participants had been promised a later resuming of the program (i.e., an invitation for further intervention after the first year (NCT00938808). This incentive could be a decisive difference from the data in our 1-year previous proof-of-concept study 41, demonstrating the effect of dietary intervention compared with no intervention. In the current study, the average decrease in pain on VAS from baseline was about 6 mm in all groups, corresponding to about 15%. The lack of group differences in symptoms, together with group differences in sustaining weight loss, contrasted with the anticipated weight loss dose-response relationship that would predict greater weight loss to yield greater symptom improvement 13.
Dietary intervention was superior to both control and exercise groups in maintaining weight loss. The rapid weight loss obtained by formula products is easy to enforce in a group-based setting 8, with participants in teams of 6 to 8 persons resulting in good compliance and a low dropout rate 12,24,41–43. As a mandatory part of the program, the initial low-energy formula diet should be followed by a long-term lifestyle intervention program. The costs per participant of the full 16-week dietary intervention, including products and teaching in our setting, were only about £1,000 (approximately €1,170), and during the program the participants' expenses for food were presumably low. In comparison, the exercise group was less successful at maintaining the weight loss. This finding is somewhat contrary to the general recommendations of exercise as a way of avoiding weight regain when applied in addition to continuous dietary control.
There are several possible explanations for the poorer weight loss maintenance in the exercise group. Firstly, the exercise program was designed to target knee OA pain and disability rather than high metabolic expenditure. The calories burned through exercise on a daily basis in this context are not significant enough to warrant extra foods or increased portion size. People dramatically overestimate the calories burned through exercise, so they must be reminded that the calories burned in 30 minutes of intensive exercise can be consumed in 30 seconds with an increased portion size or a simple chocolate bar. Furthermore, compliance with the facility-based parts of the exercise program was poor, and compliance with the home-based exercises was similarly poor, if not poorer. In spite of this poor compliance, there were no detectable differences between groups in the primary outcomes. Many of the participants in the exercise group expressed dissatisfaction with their group assignment, as they would have preferred continuous dietary consultations. This dissatisfaction could have affected both the primary and several of the secondary outcomes as well as compliance with the program. Although the neuromuscular exercise program used in the present study has been proved feasible for knee OA patients 44, the low compliance with the program precludes firm conclusions.
Despite differences in the loss of fat mass, there were no differences between the groups when comparing the (anticipated) reduction in lean body mass. Interestingly, the exercise group showed less increase in physical function on the SF-36 than did the 2 other groups, possibly because of that group's poor compliance with the program or dissatisfaction with allocation. Our results with the diet group are consistent with other trials using diets with low carbohydrates and high protein content for weight maintenance after a significant weight loss program 43. According to the changes in fat mass, the dietary intervention group clearly had the most success, with an average loss of fat of about 9 kg, which was 3 kg more than the control group and close to twice as much as the exercise group.
In contrast to the present results, other studies have reported a superior effect of exercise on pain compared with diet in overweight patients with knee OA 45,46. However, these studies also corroborate one aspect of our study, as exercise per se did not cause weight loss 45. It should be noted that a different study design was used, which was not comparable to our design's initial weight loss for all participants. Furthermore, questionnaires, both multi- and one-dimensional, create the problematic phenomenon of response shift (i.e., responders' changing reference points, such as from being healthy to being more disabled) when people evaluate their own pain or function, thereby lacking temporal and contextual consistency 47. This phenomenon could indicate that the participants in the present study tended to underestimate the effects of the treatment during the last year.
The present study recruited all patients with both obesity and knee OA, with no exceptions due to other medical conditions. Adverse effects were mild (not necessarily causal) and compliance with the dietary program was very high. Patients with knee OA are partially immobilized by pain, which leads to a lower energy expenditure, making weight loss particularly difficult. Often, patients with a combination of obesity and other chronic illnesses who have restricted ambulation are faced with this problem and self-selected low energy diets are very difficult to construct successfully. The present results of dietary advice that includes use of a formula weight loss diet confirm previous experiences with similar patient groups and substantiate the importance and necessity of a dietary lifestyle intervention strategy in this patient group. A simple reduction of ordinary food may prove deficient in vitamins and minerals; indeed, many of our participants were below reference range in vitamin D and B12 at baseline 48. Sufficient supply of these vital food ingredients may be obtained from formula diets, which may be used in full or in part for periods to support and maintain weight loss.
The present study demonstrated no difference in effect of a dietary intervention or a specialized knee exercise program on knee symptoms in knee OA patients following an intensive weight loss. However, we found a more long-lasting effect on weight obtained with a dietary intervention, including the use of formula diet, group therapy, and education. This finding could suggest that patients with combined obesity and functional limitations precluding exercise participation may benefit from a dietary program alone 49. The CAROT study differed somewhat from other large trials, such as the Arthritis, Diet, and Activity Promotion Trial (ADAPT) 50 and IDEA 46, which focused on diet, exercise, or both in combination. A common conclusion of all 3 trials is that diet is mandatory for weight loss, while exercise has been prescribed with varying compliance and effect. In the ADAPT and IDEA (effects of intensive diet and exercise on knee joint loads, inflammation, and clinical outcomes among overweight and obese adults with knee osteoarthritis) studies, clinical improvement in pain depended on the exercise.
As illustrated previously 13, on the basis of the changes in pain scores reported in the ADAPT study 50, the clinical efficacy can be documented only when weight loss is added to an exercise treatment. That was likely due to the fact that compared with the control group, the dietary intervention failed regarding both weight reduction and pain relief despite a significant within-group 16% pain reduction following 4.9% weight loss after 18 months of treatment 13; interestingly, this recalls that the “exercise-only” group in the ADAPT study did not experience any significant pain reduction 13,50. This was not the case in the CAROT study, however. As indicated by the very low adherence to the program in the exercise group in the second phase, participants joined our program with the specific intent of losing weight on diet, not by exercising. The weight loss was successfully provided by diet alone in the run-in 16-week period and it may be suspected that the main part of the participants regarded the following year as time to pass before the majority were enrolled subsequently in the LIGHT trial (NCT00938808).
The interpretation of our results may well be that the psychological effect of being on a waiting list for dietary consultancy seems to be equally potent in maintaining a weight loss when compared to half-hearted efforts with exercise. This notion has some implication for planning of coming weight loss programs, which should consider regular followup programs or study extensions as means of maintenance.
Acknowledgments
The authors wish to thank the staff at the Parker Institute and the Department of Radiology, Frederiksberg Hospital for their dedicated work. Special thanks go to Line Rustad (Parker) and Rasmus Bouert (Department of Radiology) for managing the logistics. In addition, we would like to thank all the CAROT participants who made this study possible.
AUTHOR CONTRIBUTIONS
All authors were involved in drafting the article or revising it critically for important intellectual content, and all authors approved the final version to be submitted for publication. Dr. Bliddal had full access to all of the data in the study and takes responsibility for the integrity of the data and the accuracy of the data analysis.
Study conception and design. R. Christensen, Henriksen, Leeds, Astrup, Bliddal.
Acquisition of data. Henriksen, Gudbergsen, P. Christensen, Sørensen, Bartels, Riecke, Aaboe, Frederiksen, Boensen, Bliddal.
Analysis and interpretation of data. R. Christensen, Henriksen, P. Christensen, Bartels, Riecke, Lohmander, Bliddal.
ROLE OF THE STUDY SPONSOR
Cambridge Weight Plan had no role in the study design or in the collection, analysis, or interpretation of the data, the writing of the manuscript, or the decision to submit the manuscript for publication. Publication of this article was not contingent upon the approval of Cambridge Weight Plan.
Supporting Information
Additional Supporting Information may be found in the online version of this article.
Supporting Information Appendix A
Supporting Information Appendix B
Supporting Information Appendix C
REFERENCES
- Lawrence RC, Helmick CG, Arnett FC, Deyo RA, Felson DT, Giannini EH, et al. Estimates of the prevalence of arthritis and selected musculoskeletal disorders in the United States. Arthritis Rheum. 1998;41:778–99. doi: 10.1002/1529-0131(199805)41:5<778::AID-ART4>3.0.CO;2-V. [DOI] [PubMed] [Google Scholar]
- World Health Organization. WHO Technical Report Series (919): the burden of musculoskeletal conditions at the start of the new millenium. 2003. URL: http://whqlibdoc.who.int/trs/WHO_TRS_919.pdf. [PubMed]
- Collerton J, Davies K, Jagger C, Kingston A, Bond J, Eccles MP, et al. Health and disease in 85 year olds: baseline findings from the Newcastle 85+ cohort study. BMJ. 2009;339:b4904. doi: 10.1136/bmj.b4904. [DOI] [PMC free article] [PubMed] [Google Scholar]
- Felson DT. Clinical practice: osteoarthritis of the knee. N Engl J Med. 2006;354(8):841. doi: 10.1056/NEJMcp051726. [DOI] [PubMed] [Google Scholar]
- Blagojevic M, Jinks C, Jeffery A, Jordan KP. Risk factors for onset of osteoarthritis of the knee in older adults: a systematic review and meta-analysis. Osteoarthritis Cartilage. 2010;18:24–33. doi: 10.1016/j.joca.2009.08.010. [DOI] [PubMed] [Google Scholar]
- Felson DT. Weight and osteoarthritis. Am J Clin Nutr. 1996;63(Suppl):430S–2S. doi: 10.1093/ajcn/63.3.430. [DOI] [PubMed] [Google Scholar]
- Lohmander LS, Gerhardsson de Verdier M, Rollof J, Nilsson PM. Engstrom G. Incidence of severe knee and hip osteoarthritis in relation to different measures of body mass: a population-based prospective cohort study. Ann Rheum Dis. 2009;68:490–6. doi: 10.1136/ard.2008.089748. [DOI] [PubMed] [Google Scholar]
- Bliddal H, Christensen R. The management of osteoarthritis in the obese patient: practical considerations and guidelines for therapy. Obes Rev. 2006;7:323–31. doi: 10.1111/j.1467-789X.2006.00252.x. [DOI] [PubMed] [Google Scholar]
- World Health Organization. WHO Technical Report Series (894): obesity. Preventing and managing the global epidemic. 2000. URL: http://apps.who.int/iris/bitstream/10665/42330/1/WHO_TRS_894.pdf?ua=1. [PubMed]
- Wang YC, McPherson K, Marsh T, Gortmaker SL, Brown M. Health and economic burden of the projected obesity trends in the USA and the UK. Lancet. 2011;378:815–25. doi: 10.1016/S0140-6736(11)60814-3. [DOI] [PubMed] [Google Scholar]
- Swinburn BA, Sacks G, Hall KD, McPherson K, Finegood DT, Moodie ML, et al. The global obesity pandemic: shaped by global drivers and local environments. Lancet. 2011;378:804–14. doi: 10.1016/S0140-6736(11)60813-1. [DOI] [PubMed] [Google Scholar]
- Christensen R, Astrup A, Bliddal H. Weight loss: the treatment of choice for knee osteoarthritis? A randomized trial. Osteoarthritis Cartilage. 2005;13:20–7. doi: 10.1016/j.joca.2004.10.008. [DOI] [PubMed] [Google Scholar]
- Christensen R, Bartels EM, Astrup A, Bliddal H. Effect of weight reduction in obese patients diagnosed with knee osteoarthritis: a systematic review and meta-analysis. Ann Rheum Dis. 2007;66:433–9. doi: 10.1136/ard.2006.065904. [DOI] [PMC free article] [PubMed] [Google Scholar]
- Zhang W, Moskowitz RW, Nuki G, Abramson S, Altman RD, Arden N, et al. OARSI recommendations for the management of hip and knee osteoarthritis. Part I: critical appraisal of existing treatment guidelines and systematic review of current research evidence. Osteoarthritis Cartilage. 2007;15:981–1000. doi: 10.1016/j.joca.2007.06.014. [DOI] [PubMed] [Google Scholar]
- Zhang W, Moskowitz RW, Nuki G, Abramson S, Altman RD, Arden N, et al. OARSI recommendations for the management of hip and knee osteoarthritis. Part II: OARSI evidence-based, expert consensus guidelines. Osteoarthritis Cartilage. 2008;16:137–62. doi: 10.1016/j.joca.2007.12.013. [DOI] [PubMed] [Google Scholar]
- Bliddal H, Christensen R. The treatment and prevention of knee osteoarthritis: a tool for clinical decision-making. Expert Opin Pharmacother. 2009;10:1793–804. doi: 10.1517/14656560903018911. [DOI] [PubMed] [Google Scholar]
- Felson DT, Goggins J, Niu J, Zhang Y, Hunter DJ. The effect of body weight on progression of knee osteoarthritis is dependent on alignment. Arthritis Rheum. 2004;50:3904–9. doi: 10.1002/art.20726. [DOI] [PubMed] [Google Scholar]
- Astrup A, et al. Dietary approaches to reducing body weight. Baillieres Best Pract Res Clin Endocrinol Metab. 1999;13:109–20. doi: 10.1053/beem.1999.0009. [DOI] [PubMed] [Google Scholar]
- Zhang W, Nuki G, Moskowitz RW, Abramson S, Altman RD, Arden NK. OARSI recommendations for the management of hip and knee osteoarthritis. Part III: changes in evidence following systematic cumulative update of research published through January 2009. Osteoarthritis Cartilage. 2010;18:476. doi: 10.1016/j.joca.2010.01.013. −99. [DOI] [PubMed] [Google Scholar]
- Shaw K, Gennat H, O'Rourke P, Del Mar C. Exercise for overweight or obesity. Cochrane Database Syst Rev. 2006:CD003817. doi: 10.1002/14651858.CD003817.pub3. [DOI] [PMC free article] [PubMed] [Google Scholar]
- Nelson AE, Allen KD, Golightly YM, Goode AP, Jordan JM. A systematic review of recommendations and guidelines for the management of osteoarthritis: the Chronic Osteoarthritis Management Initiative of the U.S. Bone and Joint Initiative. Semin Arthritis Rheum. 2014;43:701–12. doi: 10.1016/j.semarthrit.2013.11.012. [DOI] [PubMed] [Google Scholar]
- Zwarenstein M, Treweek S, Gagnier JJ, Altman DG, Tunis S, Haynes B, et al. Improving the reporting of pragmatic trials: an extension of the CONSORT statement. BMJ. 2008;337:a2390. doi: 10.1136/bmj.a2390. [DOI] [PMC free article] [PubMed] [Google Scholar]
- Altman R, Asch E, Bloch D, Bole G, Borenstein D, Brandt K, et al. Development of criteria for the classification and reporting of osteoarthritis: classification of osteoarthritis of the knee. Arthritis Rheum. 1986;29:1039–49. doi: 10.1002/art.1780290816. [DOI] [PubMed] [Google Scholar]
- Riecke BF, Christensen R, Christensen P, Leeds AR, Boesen M, Lohmander LS, et al. Comparing two low-energy diets for the treatment of knee osteoarthritis symptoms in obese patients: a pragmatic randomized clinical trial. Osteoarthritis Cartilage. 2010;18:746–54. doi: 10.1016/j.joca.2010.02.012. [DOI] [PubMed] [Google Scholar]
- Christensen P, Bliddal H, Riecke BF, Leeds AR, Astrup A, Christensen R. Comparison of a low-energy diet and a very low-energy diet in sedentary obese individuals: a pragmatic randomized controlled trial. Clin Obes. 2011;1:31–40. doi: 10.1111/j.1758-8111.2011.00006.x. [DOI] [PubMed] [Google Scholar]
- Aaboe J, Bliddal H, Messier SP, Alkjaer T, Henriksen M. Effects of an intensive weight loss program on knee joint loading in obese adults with knee osteoarthritis. Osteoarthritis Cartilage. 2011;19:822–8. doi: 10.1016/j.joca.2011.03.006. [DOI] [PubMed] [Google Scholar]
- Gudbergsen H, Boesen M, Lohmander LS, Christensen R, Henriksen M, Bartels EM, et al. Weight loss is effective for symptomatic relief in obese subjects with knee osteoarthritis independently of joint damage severity assessed by high-field MRI and radiography. Osteoarthritis Cartilage. 2012;20:495–502. doi: 10.1016/j.joca.2012.02.639. [DOI] [PubMed] [Google Scholar]
- Altman DG, Bland JM. Treatment allocation by minimisation. BMJ. 2005;330:843. doi: 10.1136/bmj.330.7495.843. [DOI] [PMC free article] [PubMed] [Google Scholar]
- Moher D, Hopewell S, Schulz KF, Montori V, Gotzsche PC, Devereaux PJ, et al. CONSORT 2010 explanation and elaboration: updated guidelines for reporting parallel group randomised trials. BMJ. 2010;340:c869. doi: 10.1136/bmj.c869. [DOI] [PMC free article] [PubMed] [Google Scholar]
- Heymsfield SB, van Mierlo CA, van der Knaap HC, Heo M, Frier HI. Weight management using a meal replacement strategy: meta and pooling analysis from six studies. Int J Obes Relat Metab Disord. 2003;27:537–49. doi: 10.1038/sj.ijo.0802258. [DOI] [PubMed] [Google Scholar]
- Christensen P, Frederiksen R, Bliddal H, Riecke BF, Bartels EM, Henriksen M, et al. Comparison of three weight maintenance programs on cardiovascular risk, bone and vitamins in sedentary older adults. Obesity (Silver Spring) 2013;21:1982–90. doi: 10.1002/oby.20413. [DOI] [PubMed] [Google Scholar]
- Pham T, van der HD, Altman RD, Anderson JJ, Bellamy N, Hochberg M, et al. OMERACT-OARSI initiative: Osteoarthritis Research Society International set of responder criteria for osteoarthritis clinical trials revisited. Osteoarthritis. Cartilage. 2004;12:389–99. doi: 10.1016/j.joca.2004.02.001. [DOI] [PubMed] [Google Scholar]
- Roos EM, Roos HP, Lohmander LS, Ekdahl C, Beynnon BD. Knee Injury and Osteoarthritis Outcome Score (KOOS): development of a self-administered outcome measure. J Orthop Sports Phys Ther. 1998;28:88–96. doi: 10.2519/jospt.1998.28.2.88. [DOI] [PubMed] [Google Scholar]
- Guyatt G, Schunemann H. How can quality of life researchers make their work more useful to health workers and their patients? Qual Life Res. 2007;16:1097–105. doi: 10.1007/s11136-007-9223-3. [DOI] [PubMed] [Google Scholar]
- Ware JE, Jr, Sherbourne CD. The MOS 36-item short-form health survey (SF-36). I: conceptual framework and item selection. Med Care. 1992;30:473–83. [PubMed] [Google Scholar]
- Ware JE., Jr SF-36 health survey update. Spine (Phila Pa 1976) 2000;25:3130–9. doi: 10.1097/00007632-200012150-00008. [DOI] [PubMed] [Google Scholar]
- Bjorner JB, Damsgaard MT, Watt T, Groenvold M. Tests of data quality, scaling assumptions, and reliability of the Danish SF-36. J Clin Epidemiol. 1998;51:1001–11. doi: 10.1016/s0895-4356(98)00092-4. [DOI] [PubMed] [Google Scholar]
- Enright PL, McBurnie MA, Bittner V, Tracy RP, McNamara R, Arnold A, et al. The 6-min walk test: a quick measure of functional status in elderly adults. Chest. 2003;123:387–98. doi: 10.1378/chest.123.2.387. [DOI] [PubMed] [Google Scholar]
- Ware JH. Interpreting incomplete data in studies of diet and weight loss [letter] N Engl J Med. 2003;348:2136–7. doi: 10.1056/NEJMe030054. [DOI] [PubMed] [Google Scholar]
- White IR, Horton NJ, Carpenter J, Pocock SJ. Strategy for intention to treat analysis in randomised trials with missing outcome data. BMJ. 2011;342:d40. doi: 10.1136/bmj.d40. [DOI] [PMC free article] [PubMed] [Google Scholar]
- Bliddal H, Leeds AR, Stigsgaard L, Astrup A, Christensen R. Weight loss as treatment for knee osteoarthritis symptoms in obese patients: 1-year results from a randomised controlled trial. Ann Rheum Dis. 2011;70:1798–803. doi: 10.1136/ard.2010.142018. [DOI] [PubMed] [Google Scholar]
- Gudbergsen H, Boesen M, Christensen R, Astrup A, Bliddal H. Radiographs and low field MRI (0.2T) as predictors of efficacy in a weight loss trial in obese women with knee osteoarthritis. BMC Musculoskelet Disord. 2011;12:56. doi: 10.1186/1471-2474-12-56. [DOI] [PMC free article] [PubMed] [Google Scholar]
- Larsen TM, Dalskov SM, van Baak M, Jebb SA, Papadaki A, Pfeiffer AF, et al. Diets with high or low protein content and glycemic index for weight-loss maintenance. N Engl J Med. 2010;363:2102–13. doi: 10.1056/NEJMoa1007137. [DOI] [PMC free article] [PubMed] [Google Scholar]
- Ageberg E, Link A, Roos EM. Feasibility of neuromuscular training in patients with severe hip or knee OA: the individualized goal-based NEMEX-TJR training program. BMC Musculoskelet Disord. 2010;11:126. doi: 10.1186/1471-2474-11-126. [DOI] [PMC free article] [PubMed] [Google Scholar]
- Jenkinson CM, Doherty M, Avery AJ, Read A, Taylor MA, Sach TH, et al. Effects of dietary intervention and quadriceps strengthening exercises on pain and function in overweight people with knee pain: randomised controlled trial. BMJ. 2009;339:b3170. doi: 10.1136/bmj.b3170. [DOI] [PMC free article] [PubMed] [Google Scholar]
- Messier SP, Mihalko SL, Legault C, Miller GD, Nicklas BJ, DeVita P, et al. Effects of intensive diet and exercise on knee joint loads, inflammation, and clinical outcomes among overweight and obese adults with knee osteoarthritis: the IDEA randomized clinical trial. JAMA. 2013;310:1263–73. doi: 10.1001/jama.2013.277669. [DOI] [PMC free article] [PubMed] [Google Scholar]
- Ong BN, Hooper H, Jinks C, Dunn K, Croft P, et al. “I suppose that depends on how I was feeling at the time”: perspectives on questionnaires measuring quality of life and musculoskeletal pain. J Health Serv Res Policy. 2006;11:81–8. doi: 10.1258/135581906776318938. [DOI] [PubMed] [Google Scholar]
- Christensen P, Bartels EM, Riecke BF, Bliddal H, Leeds AR, Astrup A. Improved nutritional status and bone health after diet-induced weight loss in sedentary osteoarthritis patients: a prospective cohort study. Eur J Clin Nutr. 66:504–9. doi: 10.1038/ejcn.2011.201. 2011; [DOI] [PMC free article] [PubMed] [Google Scholar]
- Hochberg MC, Altman RD, April KT, Benkhalti M, Guyatt G, McGowan J, et al. American College of Rheumatology 2012 recommendations for the use of nonpharmacologic and pharmacologic therapies in osteoarthritis of the hand, hip, and knee. Arthritis Care Res (Hoboken) 2012;64:465–74. doi: 10.1002/acr.21596. [DOI] [PubMed] [Google Scholar]
- Messier SP, Loeser RF, Miller GD, Morgan TM, Rejeski WJ, Sevick MA, et al. Exercise and dietary weight loss in overweight and obese older adults with knee osteoarthritis: the Arthritis, Diet, and Activity Promotion Trial. Arthritis Rheum. 2004;50:1501–10. doi: 10.1002/art.20256. [DOI] [PubMed] [Google Scholar]
Associated Data
This section collects any data citations, data availability statements, or supplementary materials included in this article.
Supplementary Materials
Supporting Information Appendix A
Supporting Information Appendix B
Supporting Information Appendix C