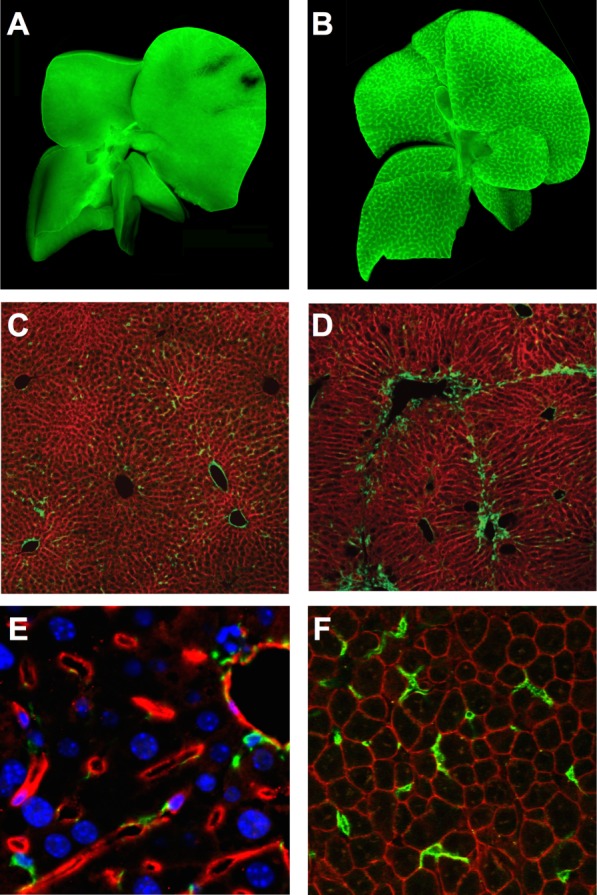
Figure 2.

Labeling of hepatic NPCs with fluorescent reporters. (A and B) Lrat-Cre-driven ZsGreen labeling of qHSCs and aHSCs in whole livers from untreated (A) and CCl4-treated (B) mice. Adapted by permission from Macmillan Publishers Ltd: Nat Commun,12 © 2013. (C and D) Pdgfrb-Cre-driven membranous GFP labeling (green) of qHSCs and aHSCs in Pdgfrb-Cre;mTmG mice following olive oil (control, C) or chronic CCl4 (D) administration. Adapted by permission from Macmillan Publishers Ltd: Nat Med,13 © 2013. (E) Tamoxifen-induced Cdh5-PAC-CreERT2-driven TdTomato (red) labeling of LSECs. Nuclei (blue), α-SMA+ cells (green). Adapted from Supplementary Information to a previous work,29 by permission from the authors. (F) LysM-Cre-driven membranous GFP labeling (green) of macrophages in uninjured liver of LysM-Cre;mTmG mice (K.P.C. and N.C.H., unpublished data).
