Abstract
A terbium-based complex that displays a water exchange CEST resonance well-outside the normal magnetization transfer (MT) frequency range of tissues provides a direct readout of pH by MRI. Deprotonation of the phenolic proton in this complex results in a frequency shift of 56 ppm in a bound water molecule exchange peak between pH 5 and 8. This allows direct imaging pH without prior knowledge of the agent concentration and with essentially no interference from the tissue MT signal.
Keywords: imaging agents, lanthanides, magnetic resonance imaging, magnetization transfer, paraCEST
Graphical Abstract

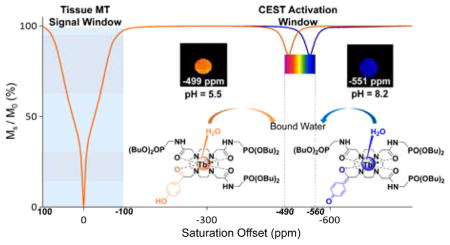
Imaging beyond the MT effect: A pH-responsive MRI contrast agent displays a highly shifted water molecule exchange peak near −550 ppm, well outside the MT window. Additionally, the chemical shift of 56 ppm in this CEST peak is quite sensitive to changes in solution pH. These features make this agent potentially useful for imaging pH in vivo without prior knowledge of the agent concentration and with no masking effect from the inherent tissue MT signal.
MT = magnetization transfer.
Magnetic resonance imaging (MRI) has rapidly developed into one of the most widely used imaging tools in clinical medicine because it provides both anatomic and functional information with high spatial and temporal resolution and no radiation burden. MRI contrast agents are widely used in clinical medicine to enhance contrast between different anatomical structures or pathologies.[1] Current clinically approved MRI contrast agents work by shortening the longitudinal (T1) or transverse (T2) relaxation times of water protons that come into close contact with the agent, thereby providing dynamic data about the tissue distribution of the agents as they clear. However, currently constructed agents are limited in providing biological or physiological information such as pH, enzyme activity, redox status, or the presence of reactive oxygen species (ROS).
Chemical exchange saturation transfer (CEST) agents create MRI contrast using a conceptually different mechanism that relies on one or more slow-to-intermediate chemical exchange processes between two or more magnetically nonequivalent environments (Δω ≧ kex).[2] Saturation of spins in one pool of protons followed by chemical exchange of those spins into the pool of bulk water protons results in a reduction in the intensity of the water signal and hence darkening of the image. Such dynamic exchange processes make this class of MRI contrast agents especially attractive as a platform for creating biological sensors.[3] Other CEST agents have been proposed previously for imaging tissue pH.[4] One of the more attractive approaches is to use other clinically approved agents that also contain exchanging –NH or –OH protons that have distinct CEST signals. The first example was iopamidol, an approved X-ray contrast agent having two different types of –NH protons with somewhat different pH dependencies.[5] Somewhat later, a different X-ray agent, iopromide, was considered as an alternative diaCEST agent for imaging tissue pH using the ratiometric method.[6] Even more recently, a third X-ray agent, iobitridol, containing only a single exchangeable –NH group was used to imaging pH in vivo by varying the power of the applied pre-saturation pulse.[5a, 7] For all diaCEST agents such as these, the intensity of the CEST signal measured only a few ppm downfield of water protons represents the sum of two signals, the CEST signal from the agent itself plus a background signal from tissue MT. Thus, one must assume that the tissue MT signal is independent of changes in pH such that the net effect is only from the CEST reporter molecule. Two different paramagnetic ytterbium complexes, YbDO3A-oAA[8] and YbHPDO3A[9] have also been proposed as paraCEST agents for imaging tissue pH in vivo by MRI. Even though the chemical shifts of the exchanging protons in these complexes are further removed from the water proton resonance, both agents still suffer to some degree by interferences from endogenous tissue signals. The tissue magnetization transfer (MT) signal in particular can play a major role in masking the CEST signal of most biological reporter molecules. The MT signal typically spans a broad frequency range covering ± 100 ppm and the masking effect of MT is typically larger than the CEST signal from all responsive diaCEST agents (Δω < 10 ppm) and most paraCEST agents (Δω < 100 ppm).[10] Thus, the MT signal compromises the general use of CEST to detect and quantify both endogenous and exogenous agents.
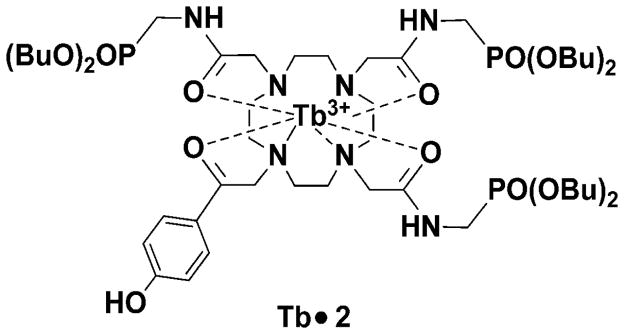
The goal of the present work is to develop a CEST-based pH sensor that can be activated without simultaneous activation of the tissue MT signal. The terbium(III) complex illustrated in Chart 1 displays a single, highly shifted water molecule CEST exchange peak near −550 ppm, well outside the MT window. The pH sensitivity of this complex arises with deprotonation of the single phenolic proton leaving a negative charge on the phenolate oxygen atom. This negative charge is then delocalized through the aromatic ring onto the ketone oxygen which is sensed by the Tb3+ ion as a stronger electron donor which, in turn, results in larger hyperfine shifts on all ligand atoms, including the bound water molecule. Normally, water exchange is too fast in most Tb-based CEST agents to observe a resonance characteristic of an exchanging bound water molecule but, in this complex, the rate of water exchange was further slowed by the presence of the three dibutyl phosphonate groups on the ligand.
The design of Tb•2 was based a previously reported pH sensor platform.[11] It has been widely observed that side-chain groups in LnDOTA-tetraamide complexes such as this play important role in modulating the rate of water exchange from the inner coordination sphere of any Ln3+ ion.[12] The dibutyl phosphonate side-chain groups in this complex were introduced to slow water exchange between the inner-sphere of the central Tb3+ ion and bulk water while maintaining the pH sensitive advantages of phenolic arm. The nine-coordinate Tb•2 complex has a single inner-sphere water molecule that exchanges so slowly with bulk water that 1H NMR signal of the bound water molecule can be observed in a 1:1 mixture of CD3CN/H2O at room temperature. This was our first indication that rate of water exchange (kex) in this complex must be slow compared to the frequency difference between the two water peaks (Δω), hence kex ≤ 2 × 10⁵ s−1. This condition matches the minimal requirements for an optimal CEST agent.[13]
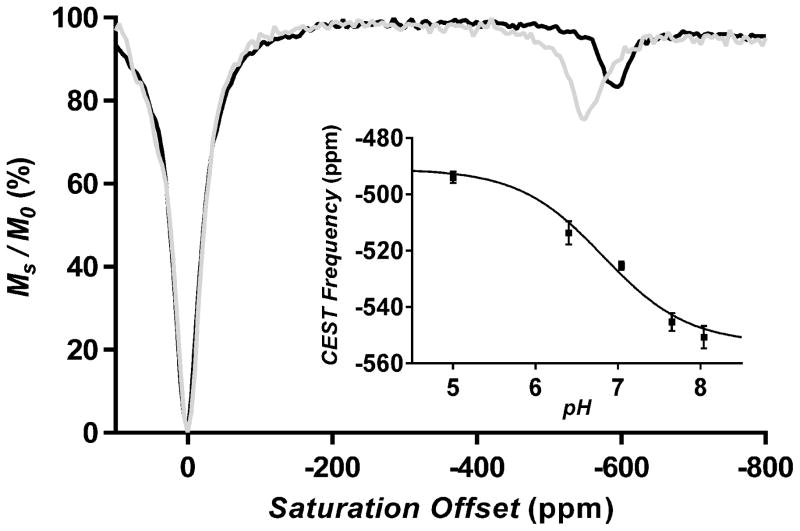
The synthesis of ligand 2 and Tb•2 are described in Supporting Information (Scheme S1). The 1H NMR spectrum of Tb•2 in 50% water in CD3CN shows four highly shifted H4 axial protons of the macrocyclic ring (not shown), indicating that the complex exists largely as a square antiprismatic (SAP) isomer in solution. CEST spectra of Tb•2 were measured in 1 ppm increments over a frequency range of +150 to −700 ppm and at different pH values ranging from 5 to 8 (Figures S1a and S1b). A CEST signal near −550 ppm was identified as an exchanging bound water resonance based upon geometric considerations in comparison to the chemical shifts of other protons in the molecule. This water-based CEST resonance was detectable at saturation power levels as low as 11.7 μT (Figures S1a and S1b). Like the previously reported Eu-based pH sensor,[11] the exchanging water resonance shifts with changes in pH but in this molecule the shifts are much larger, moving 56 ppm between pH 5 and 8 at 310K (Figures 1 inset and S1b). This suggests that Tb•2 may potentially offer a more reliable measure of pH than the previous Eu-based sensor, depending upon the linewidth of the water-based CEST peak in vivo. It is worthwhile to note that the frequency of all CEST exchange peaks in paramagnetic complexes are temperature sensitive as illustrated in Figure 1. As a result, it is important to establish an in vitro pH calibration curve at the same temperature at which the in vivo pH imaging experiments are performed.
Figure 1.
CEST spectra of 20mM Tb•2 agent recorded at pH 8.2 at 298K (black line) and 310K (grey line) in CD3CN/H2O (1:1) with a B1 of 100 μT. The inset shows a plot of the chemical shift of the water exchange CEST peak as a function of pH (T = 310K).
The CEST spectrum of Tb•2 was also unusual in that the intensity of the water exchange peak increases with temperature between 298K and 310K (Figure 1). This indicates that the rate of water exchange in this complex is too slow for optimal CEST at 298K.[14] To validate this, the Swift-Connick method[15] was used to measure the rate of water exchange in Tb•2. Plots of the observed transverse relaxation rate (T2obs−1) versus Tb•2 concentration (mM) at three different temperatures are given in Figures S3 and S4. The transverse relaxivity due to water molecule exchange (r2exch) was then calculated by subtracting the total transverse relaxivity for an equivalent sample of TbTETA, a complex lacking an inner-sphere water binding site, from r2tot at each temperature. It was quite evident from these data that r2exch increases with temperature, consistent with water exchange in Tb•2 lying on the “slow” side of the Swift–Connick peak (see Figures S5-8).[15] The bound water lifetime (τB) in Tb•2 at 298 K estimated from these data was 224 μs at pH 5 and 149 μs at pH 8, consistent with the CEST spectra shown in Figure 1.
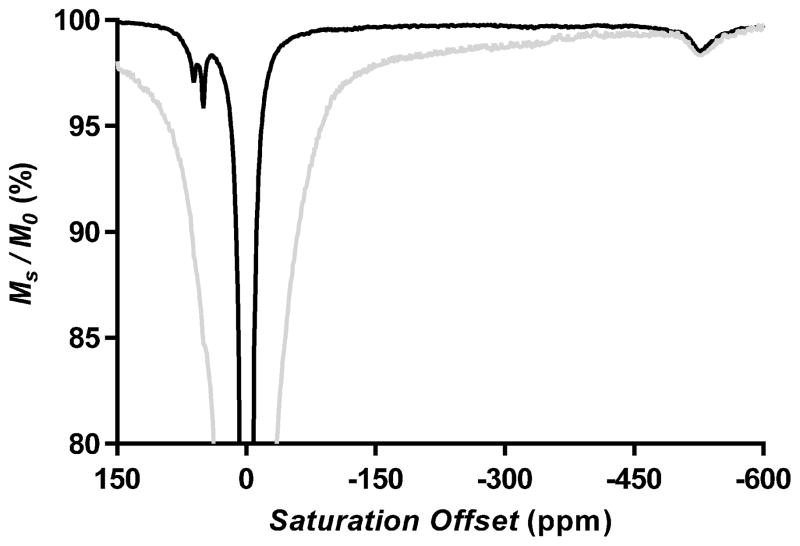
Lanthanide complexes like Tb•2 containing a highly shifted water resonance typically act as efficient T2exch agents and broaden the tissue water signal significantly.[16] The water exchange rates measured here for Tb•2 suggest that this complex may be unusual and not cause significant line broadening in vivo. To evaluate this further, a sample of Tb•2 was added to a 5 mm NMR tube containing 113 mg of minced kidney tissue and CEST spectra were collected. Two CEST spectra of Tb•2 at pH 7 and 310 K with and without tissue are compared in Figures 2 and S2. The spectrum containing tissue showed a typical broad MT signal spanning ±100 ppm clearly obscured the –NH exchange signals of the agent near +50 ppm but had no impact on the intensity and linewidth of the highly shifted Tb3+-bound water signal near −550 ppm. This suggests that the Tb3+-based agents having slow water exchange rates such as Tb•2 will not significantly broaden the tissue water signal in vivo.
Figure 2.
CEST spectra of 20mM Tb•2 agent recorded at 310K and pH 7.0 in CD3CN/H2O (1:1) with B1 of 11.7 μT. Tb•2 agent only: black line; Tb•2 agent mixed with minced kidney tissue of mice: grey line.
To demonstrate the simplicity of using this agent to image pH by MRI, CEST images of phantoms containing solutions of Tb•2 adjusted to different pH values were collected. Initial in vitro imaging experiments were performed on 20 mM solutions of Tb•2 in bundled capillaries (inner diameter 1 mm) using an Agilent 9.4 T small animal system equipped with a micro imaging probe using a gradient echo pulse sequence (TR/TE = 5.2 s/2.9 ms, flip angle = 30°, average = 1). The resulting CEST spectra gave a direct readout of the frequency of the exchanging water resonance as a function of pH (see standard curve in Figure 1 inset). The pH values derived from the CEST images (Figure 3c) perfectly matched those measured by a pH electrode (Figure 3a).
Figure 3.

Images of a phantom containing either water or 20 mM Tb•2 adjusted to the indicated pH (9.4 T, 310 K). (a) Proton density images, (b) CEST resonance frequency maps, and (c) calculated pH values as determined by the calibration curve (inset of Figure 1).
In summary, a pH-responsive CEST agent has been developed that displays an unusually slow water exchange rate for a Tb3+ complex, nearly optimal for CEST at 310K. This feature, together with the large paramagnetic shift induced by the Tb3+ ion in the bound water molecule makes this an attractive system for CEST activation beyond the MT window (100 ppm).[17] The chemical shift of the CEST water exchange peak proved to be quite sensitive to changes in solution pH, thereby making this agent potentially useful for imaging pH in vivo by MRI without knowing the exact tissue concentration of the agent.
Supplementary Material
Figure 4. Chart 1.
Chemical structure of the pH-sensitive paraCEST agent used in this study.
Acknowledgments
The authors thank the NIH (CA115531, EB015908 and EB004582) and the Robert A. Welch Foundation (AT-584) for financial support.
Footnotes
The authors thank the NIH (CA115531, EB004582, EB015908), and Robert A. Welch Foundation (AT-584) for partial support of this work.
Supporting information for this article is available on the WWWunder http://dx.doi.org/
Contributor Information
Xiaojing Wang, Department of Chemistry, University of Texas at Dallas, 800 West Campbell Road, Richardson, TX 75080 (USA).
Dr. Yunkou Wu, Advanced Imaging Research Center, UT Southwestern Medical Center, 5323 Harry Hines Blvd., Dallas, TX 75390 (USA)
Dr. Todd C. Soesbe, Advanced Imaging Research Center, UT Southwestern Medical Center, 5323 Harry Hines Blvd., Dallas, TX 75390 (USA)
Dr. Jing Yu, Department of Chemistry, University of Texas at Dallas, 800 West Campbell Road, Richardson, TX 75080 (USA)
Dr. Piyu Zhao, Department of Chemistry, University of Texas at Dallas, 800 West Campbell Road, Richardson, TX 75080 (USA)
Dr. Garry E. Kiefer, Department of Chemistry, University of Texas at Dallas, 800 West Campbell Road, Richardson, TX 75080 (USA). Macrocyclics, 1309 Record Crossing, Dallas, Texas 75235 (USA)
Prof. A. Dean Sherry, Email: sherry@utdallas.edu, dean.sherry@utsouthwestern.edu, Department of Chemistry, University of Texas at Dallas, 800 West Campbell Road, Richardson, TX 75080 (USA). Advanced Imaging Research Center, UT Southwestern Medical Center, 5323 Harry Hines Blvd., Dallas, TX 75390 (USA)
References
- 1.a) Caravan P, Ellison JJ, McMurry TJ, Lauffer RB. Chem Rev. 1999;99:2293–2352. doi: 10.1021/cr980440x. [DOI] [PubMed] [Google Scholar]; b) Geraldes CF, Laurent S. Contrast Media Mol Imaging. 2009;4:1–23. doi: 10.1002/cmmi.265. [DOI] [PubMed] [Google Scholar]; c) Caravan P. Acc Chem Res. 2009;42:851–862. doi: 10.1021/ar800220p. [DOI] [PubMed] [Google Scholar]
- 2.a) Sherry AD, Woods M. Annu Rev Biomed Eng. 2008;10:391–411. doi: 10.1146/annurev.bioeng.9.060906.151929. [DOI] [PMC free article] [PubMed] [Google Scholar]; b) Hancu I, Dixon WT, Woods M, Vinogradov E, Sherry AD, Lenkinski RE. Acta Radiol. 2010;51:910–923. doi: 10.3109/02841851.2010.502126. [DOI] [PMC free article] [PubMed] [Google Scholar]
- 3.Vinogradov E, Sherry AD, Lenkinski RE. J Magn Reson. 2013;229:155–172. doi: 10.1016/j.jmr.2012.11.024. [DOI] [PMC free article] [PubMed] [Google Scholar]
- 4.Ratnakar SJ, Soesbe TC, Lumata LL, Do QN, Viswanathan S, Lin CY, Sherry AD, Kovacs Z. J Am Chem Soc. 2013;135:14904–14907. doi: 10.1021/ja406738y. [DOI] [PMC free article] [PubMed] [Google Scholar]
- 5.a) Longo DL, Dastru W, Digilio G, Keupp J, Langereis S, Lanzardo S, Prestigio S, Steinbach O, Terreno E, Uggeri F, Aime S. Magn Reson Med. 2011;65:202–211. doi: 10.1002/mrm.22608. [DOI] [PubMed] [Google Scholar]; b) Longo DL, Busato A, Lanzardo S, Antico F, Aime S. Magn Reson Med. 2012 doi: 10.1002/mrm.24513. [DOI] [PubMed] [Google Scholar]
- 6.a) Chen LQ, Howison CM, Jeffery JJ, Robey IF, Kuo PH, Pagel MD. Magn Reson Med. 2014;72:1408–1417. doi: 10.1002/mrm.25053. [DOI] [PMC free article] [PubMed] [Google Scholar]; b) Chen LQ, Randtke EA, Jones KM, Moon BF, Howison CM, Pagel MD. Mol Imaging Biol. 2015:1–9. doi: 10.1007/s11307-014-0816-2. [DOI] [PMC free article] [PubMed] [Google Scholar]
- 7.Longo DL, Sun PZ, Consolino L, Michelotti FC, Uggeri F, Aime S. J Am Chem Soc. 2014;136:14333–14336. doi: 10.1021/ja5059313. [DOI] [PMC free article] [PubMed] [Google Scholar]
- 8.Sheth VR, Li Y, Chen LQ, Howison CM, Flask CA, Pagel MD. Magn Reson Med. 2012;67:760–768. doi: 10.1002/mrm.23038. [DOI] [PMC free article] [PubMed] [Google Scholar]
- 9.Delli Castelli D, Ferrauto G, Cutrin JC, Terreno E, Aime S. Magn Reson Med. 2014;71:326–332. doi: 10.1002/mrm.24664. [DOI] [PubMed] [Google Scholar]
- 10.Woods M, Woessner DE, Sherry AD. Chem Soc Rev. 2006;35:500–511. doi: 10.1039/b509907m. [DOI] [PMC free article] [PubMed] [Google Scholar]
- 11.Wu Y, Soesbe TC, Kiefer GE, Zhao P, Sherry AD. J Am Chem Soc. 2010;132:14002–14003. doi: 10.1021/ja106018n. [DOI] [PMC free article] [PubMed] [Google Scholar]
- 12.Ratnakar SJ, Woods M, Lubag AJ, Kovacs Z, Sherry AD. J Am Chem Soc. 2008;130:6–7. doi: 10.1021/ja076325y. [DOI] [PMC free article] [PubMed] [Google Scholar]
- 13.Zhang S, Merritt M, Woessner DE, Lenkinski RE, Sherry AD. Acc Chem Res. 2003;36:783–790. doi: 10.1021/ar020228m. [DOI] [PubMed] [Google Scholar]; b) Viswanathan S, Kovacs Z, Green KN, Ratnakar SJ, Sherry AD. Chem Rev. 2010;110:2960–3018. doi: 10.1021/cr900284a. [DOI] [PMC free article] [PubMed] [Google Scholar]
- 14.Sherry AD, Wu Y. Curr Opin Chem Biol. 2013;17:167–174. doi: 10.1016/j.cbpa.2012.12.012. [DOI] [PMC free article] [PubMed] [Google Scholar]
- 15.Soesbe TC, Merritt ME, Green KN, Rojas-Quijano FA, Sherry AD. Magn Reson Med. 2011;66:1697–1703. doi: 10.1002/mrm.22938. [DOI] [PMC free article] [PubMed] [Google Scholar]
- 16.Soesbe TC, Ratnakar SJ, Milne M, Zhang S, Do QN, Kovacs Z, Sherry AD. Magn Reson Med. 2014 doi: 10.1002/mrm.25091. [DOI] [PMC free article] [PubMed] [Google Scholar]
- 17.a) Woessner DE, Zhang S, Merritt ME, Sherry AD. Magn Reson Med. 2005;53:790–799. doi: 10.1002/mrm.20408. [DOI] [PubMed] [Google Scholar]; b) McMahon MT, Gilad AA, Zhou J, Sun PZ, Bulte JW, van Zijl PC. Magn Reson Med. 2006;55:836–847. doi: 10.1002/mrm.20818. [DOI] [PMC free article] [PubMed] [Google Scholar]
Associated Data
This section collects any data citations, data availability statements, or supplementary materials included in this article.


