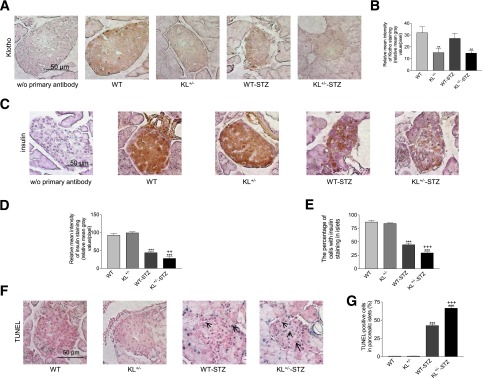
Figure 2.
Immunohistochemical analysis of Klotho and insulin expression and apoptosis in pancreatic islets of mice treated with STZ. KL+/− and WT male mice were injected with STZ or citrate buffer. Animals were killed 5 weeks after the initial injections. A: Representative images of Klotho staining (brown color) in cross sections of mouse pancreatic islets. B: Semiquantification of Klotho staining in pancreatic islets. C: Representative images of insulin staining (brown color) of cross sections of islets. D: Semiquantification of insulin staining in pancreatic islets. E: The percentage of cells with positive insulin staining in pancreatic islets. F: Representative images of TUNEL staining (blue color) in pancreatic islets. Arrows point to apoptotic cells (blue). G: The number of TUNEL-positive apoptotic cells in pancreatic islets. Data = mean ± SEM. n = 4–8 animals/group. **P < 0.05 and ***P < 0.001 vs. the WT group; ++P < 0.01 and +++P < 0.001 vs. the WT-STZ group.

