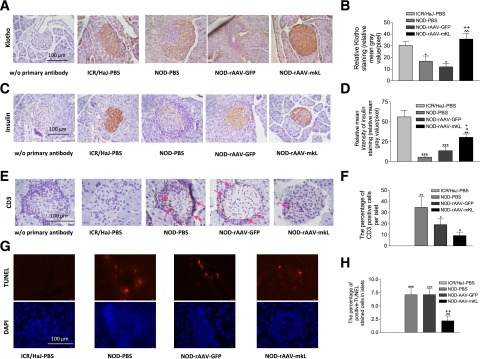
Figure 8.
β-Cell–specific expression of mKL increased insulin storage and attenuated T-cell infiltration and apoptosis in pancreatic islets of NOD mice. A: Representative photomicrograph of Klotho staining (brown color) in cross sections of pancreatic islets. B: Semiquantification of Klotho staining in islets. C: Representative photomicrograph of insulin staining (brown color) in islets. D: Semiquantification of insulin staining in islets. E: Representative images of CD3 staining (brown color, red arrow) in islets. F: The percentage of cells with positive CD3 staining in islets. G: Representative images of apoptotic cells (TUNEL staining, immunofluorescence red color) in islets. H: The percentage of TUNEL-positive cells in islets. Data are mean ± SEM. n = 5 animals/group. *P < 0.05, **P < 0.01, and ***P < 0.001 vs. the ICR/HaJ-PBS group; ^P < 0.05 and ^^P < 0.01 vs. the NOD-PBS group; +P < 0.05 and ++P < 0.01 vs. the NOD–AAV-GFP group.

