

Abstract
BACKGROUND
Unusually large CAG repeat expansions (>60) in exon one of Huntingtin (HTT) are invariably associated with a juvenile-onset form of Huntington’s disease (HD), characterized by a more extensive and rapidly progressing neuropathology than the more prevalent adult-onset form. However, existing mouse models of HD that express the full-length Htt gene with CAG repeat lengths associated with juvenile HD (ranging between ~75 to ~150 repeats in published models) exhibit selective neurodegenerative phenotypes more consistent with adult-onset HD.
OBJECTIVE
To determine if a very large CAG repeat (>200) in full-length Htt elicits neurodegenerative phenotypes consistent with juvenile HD.
METHODS
Using a bacterial artificial chromosome (BAC) system, we generated mice expressing full-length mouse Htt with ~225 CAG repeats under control of the mouse Htt promoter. Mice were characterized using behavioral, neuropathological, biochemical and brain imaging methods.
RESULTS
BAC-225Q mice exhibit phenotypes consistent with a subset of features seen in juvenile-onset HD: very early motor behavior abnormalities, reduced body weight, widespread and progressive increase in Htt aggregates, gliosis, and neurodegeneration. Early striatal pathology was observed, including reactive gliosis and loss of dopamine receptors, prior to detectable volume loss. HD-related blood markers of impaired energy metabolism and systemic inflammation were also increased. Aside from an age-dependent progression of diffuse nuclear aggregates at 6 months of age to abundant neuropil aggregates at 12 months of age, other pathological and motor phenotypes showed little to no progression.
CONCLUSIONS
The HD phenotypes present in animals 3 to 12 months of age make the BAC-225Q mice a unique and stable model of full-length mutant Htt associated phenotypes, including body weight loss, behavioral impairment and HD-like neurodegenerative phenotypes characteristic of juvenile-onset HD and/or late-stage adult-onset HD.
Keywords: Huntington’s disease, juvenile HD, Huntingtin, transgenic mouse, neurodegeneration, body weight deficiency, Translocator Protein 18 kDa (TSPO), brain atrophy, blood markers, Htt aggregates, inclusion bodies
INTRODUCTION
Huntington’s Disease (HD) is a neurodegenerative disorder manifested by involuntary movements, cognitive impairment and psychiatric disturbances [1]. HD is caused by expansion of a CAG triplet within exon 1 of the autosomal dominant Huntingtin (HTT) gene. Though this mutation was discovered almost 20 years ago, the detailed mechanisms of the neurodegeneration present in HD are still unknown, and no treatments exist to slow disease progression [2]. The primary site of neurodegeneration in adult-onset HD is the striatum, however other brain regions are also affected over the course of the disease [3, 4]. Additionally, several peripheral tissues (endocrine tissues, cardiac and skeletal muscle) have been suggested to contribute to HD pathogenesis [5]. The juvenile form of the disease, due to longer CAG repeat lengths (> ~60 repeats), presents with widespread neurodegeneration and can display clinical manifestations distinct from adult-onset HD [6, 7].
A variety of rodent HD models have been developed (for review see [8, 9]). These mouse models can be divided into three groups: transgenic mice expressing the CAG-expanded N-terminal fragment of human HTT (R6/1, R6/2, N171-82Q), transgenic mice expressing full-length mutant human HTT (YAC128, BACHD) and knock-in mice in which the CAG mutation was introduced into the endogenous mouse Htt gene (HdhQ72, HdhQ94, HdhQ111, HdhQ140, HdhQ200). All these models differ from each other with regard to disease symptoms, severity and progression. Mice expressing the N-terminal Htt fragment are characterized by an aggressive phenotype, resulting in rapid death, while those models expressing full-length Htt appear to replicate human pathology more accurately with specific striatal and cortical neurodegeneration, and late, progressive motor impairment (for review see [9]). Though the knock-in mouse models reported to date parallel the human genetic disorder, bearing mutations at the endogenous Htt locus, they display very mild symptoms, akin to the pre-symptomatic stage of human adult-onset HD, and none of these models reproduce the full spectrum of HD symptoms and pathologies. A diverse collection of animal models available, differing in number of CAG repeats, transgene length, transgene locus and polyglutamine (polyQ)/wild-type (WT) Htt ratio may therefore be fundamental for successful studies of the pathological mechanisms of HD and for evaluating the efficacy of interventional strategies. Here we report on the generation of a transgenic Bacterial Artificial Chromosome (BAC) mouse model, expressing full-length mouse Htt with ~225 CAG repeats under the control of the mouse Htt promoter on the endogenous Htt-positive background. This new model displays several phenotypes consistent with juvenile HD and/or late stage of adult-onset HD: motor abnormalities at a young age, early and widespread brain atrophy, severe aggregate load, and reduced body weight. Additionally, other phenotypes consistent with HD are present in these mice, including down-regulation of striatal dopamine receptors and disturbances in plasma levels of markers related to energy metabolism and systemic inflammation. The model is also noteworthy as despite the early onset of neuropathological and motor phenotypes (<3 months), little or no progression of phenotypic severity was observed with age through at least 10 to 15 months of age.
MATERIALS AND METHODS
Generation of C57BL/6J-Tg(BAC225Htt)1Bow mice
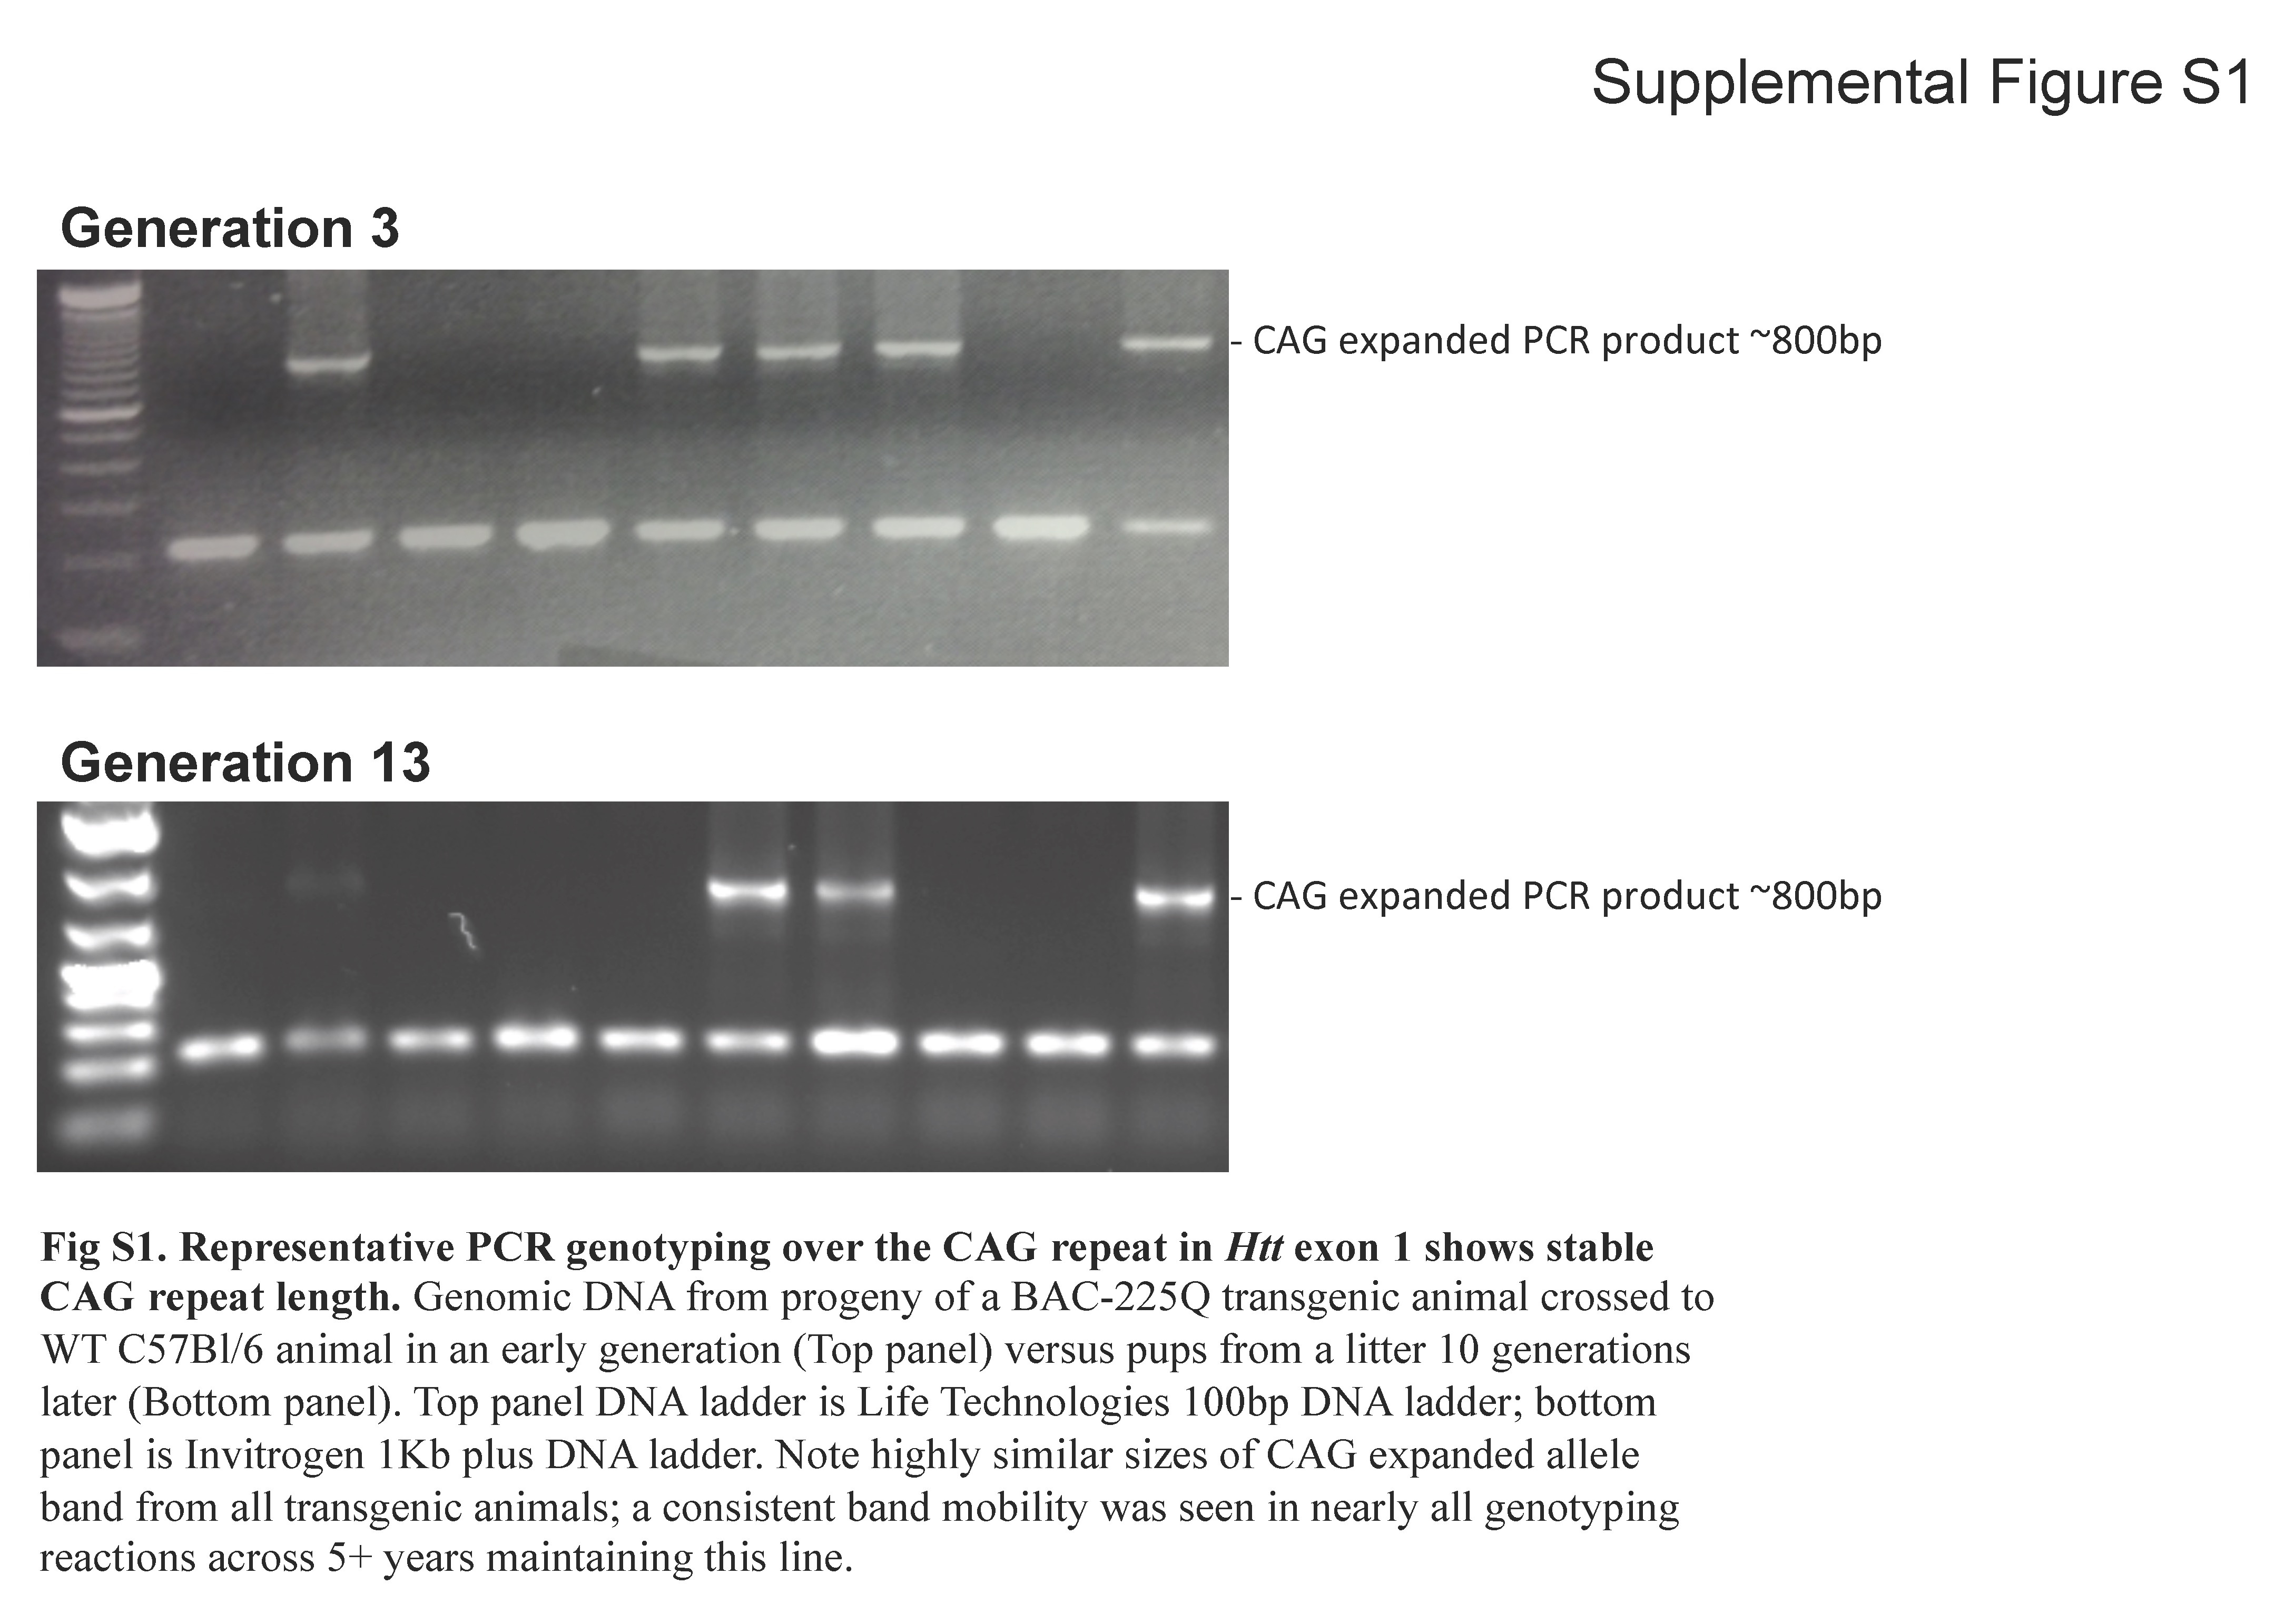
All experiments, designed to minimize animal pain, were carried out with the approval from Vanderbilt University Medical Center Institutional Animal Care and Use Committee. C57BL/6J-Tg(BAC225Htt)1Bow (hereafter called BAC-225Q) transgenic animals were generated by pronuclear injection of fertilized C57BL6/J eggs with a modified bacteria artificial chromosome (BAC RP24-165D1 obtained from CHORI BACPAC resources) covering ~202kb of the mus musculus Htt genomic locus (containing the entire Htt locus plus partial sequence of the flanking genes Grk4 (last 5 out of a total of 16 exons) and Rgs12 (first exon only)) modified to expand the normal CAG repeat to a length of ~225 repeats by a subcloning/BAC recombineering strategy [10]. Detailed information on break points of BAC RP24-165D1 is available on the UCSC genome browser (http://genome.ucsc.edu/index.html). Briefly, the recombineering strategy began by subcloning a 266-CAG repeat from the mutant Atxn7 locus by PCR using genomic DNA of the SCA7 KI mouse model [11]. HindIII and PvuII restriction enzyme recognition sites were engineered into the primers to allow restriction enzyme cloning into the genomic DNA flanking exon 1 of the mouse Htt gene. This construct was used to generate a targeting vector by BAC recombineering using GalK positive and negative selection in the RP24-165D1 BAC. Restriction mapping of BAC fragments and sequencing of the expanded CAG repeat from the BAC was used to validate appropriate targeting. The Vanderbilt Transgenic Shared Resource generated three female BAC positive transgenic founders that were mated to C57BL/6 male mice to test for germline transmission using uncut BAC vector prepared via the Qiagen Large Construct Kit (Qiagen). One of the three founders transmitted the transgenic allele to establish the BAC-225Q line. Expression of full-length mutant Htt protein was confirmed in transgene positive animals by western blotting. Mice were housed in the Vanderbilt University Medical Center Division of Animal Care, and fed ad libitum with standard mouse chow (5LOD; LabDiet). BAC-225Q animals were maintained in their original genetic background (C57BL6/J) and the transgene was transmitted to the offspring from a hemizygous transgenic parent by crossing it with a non-transgenic animal. WT and hemizygous transgenic littermates across multiple litters were used for the experiments. As only a single transgenic line was generated we were not able to test whether any particular phenotypes displayed position effects. To minimize position effects we used only hemizygous transgenic mice for all experiments to ensure at least one functional allele for any genes disrupted from the transgene insertion. Genotyping and analysis of CAG repeat length was performed using genomic DNA isolated from the tail with the following primers, flanking the CAG repeat within Htt: F: 5’-CCCATTCATTGCCTTGCTG-3’, and R: 5’-GCGGCTGAGGGGGTTGA-3’. Agarose gel electrophoresis demonstrated a calculated CAG repeat length in the BAC-225Q animals of between 220–230 repeats. The length of the CAG repeat in the transgene has not detectably changed since transmission from the original founder across >10 generations, suggesting a stable repeat with no detectable intergenerational expansion or contraction (Supplemental Fig. S1). Furthermore, of over 1000 transgenic positive progeny we have seen only a handful of animals with an observable small increase or decrease in the CAG repeat containing PCR product used to genotype the animals. Thus while expansions and contractions are still possible, they were rare events (less than 1 in 200 animals). The basis for the repeat stability is unclear though possible explanations include the genomic location of the transgene insertion site, or relatively low expression level of the transgene mRNA (see results section). Mice were weighed weekly, from four to 43 weeks of age, 2–4 hours before the end of the light phase of the light cycle.
Western blotting
Western blotting was performed as described previously [12]. Briefly, tissue was homogenized on ice in RIPA buffer (50 mM Tris, 150 mM NaCl, 0.1% sodium dodecyl sulfate (SDS), 1% IGEPAL CA-630, 12 mM deoxycholic acid, pH 8.0) supplemented with 1% protease inhibitor cocktail (Sigma). Homogenates were centrifuged at 14,000 x g, for 10 minutes, at 4OC. Protein content was measured by DC assay (Bio-Rad). Samples were mixed with sample buffer (60 mM Tris, 6% SDS, 30% glycerol, 15% β-mercaptoethanol, 0.015% bromophenol blue, pH 6.8) and incubated at 95OC for 5 minutes. The electrophoresis was run using 15 x 22 cm, 10% polyacrylamide gels, overnight at 1050 V x hour with CBS Scientific Vertical Electrophoresis System in running buffer (0.1% SDS, 20 mM Tris-HCl and 192 mM glycine). Next, proteins were transferred to 0.2 μm pore Protran nitrocellulose membrane (Whatman) in transfer buffer (20 mM Tris-HCl, 192 mM Glycine, 10% methanol), at 500 mA, at 4OC for 3 h, using CBS Scientific Electrophoretic Blotting System or the iBlot transfer system. The membrane was blocked with 5% milk in TBST buffer (150 mM NaCl, 56 mM Tris-HCl, 44 mM Trizma base, 0.05% Tween-20) for 3 hours at room temperature (RT) or with Odyssey Blocking Buffer (LI-COR part 927-400000) for 90 mins at RT. The blocked membranes were incubated with mouse anti-Htt 1HU-4C8 antibody (MAB2166, Millipore, 1:5,000 – 1:20,000) or mouse anti-polyglutamine expanded 1C2 antibody (MAB1574, Millipore, 1:5000) diluted in 5% milk in TBST overnight at room temperature. Anti-mouse secondary antibody (Jackson ImmunoResearch Laboratories) was used at 1:10,000 – 1:15,000 dilutions in 5% milk in TBST or in Odyssey Blocking Buffer with 0.1%Tween. The blots were visualized with West Dura Extended Duration Chemiluminescent Substrate (Thermo Fisher Scientific) or using the Li-Cor Odyssey infrared system. Blot quantification was performed with ImageJ (NIH), with the background correction calculated using a signal ratio error model [13].
Rotarod
Three cohorts of animals were used for the rotarod test: the first cohort was examined at 3, 4, 5, 6, 7, 8, 9, 12 and 15 months, the second cohort at 6, 7 and 12 months, and the third cohort at 1.5, 2 and 2.5 months of age. Animals were tested at Vanderbilt Murine Neurobehavioral Core using an Ugo Basile Accelerating Rotarod. Three 10-minute trials per day with a 30 minute interval were performed for 4 consecutive days during the light phase of the light cycle for a total of 12 trials per age point. A single trial consisted of 5 minutes of acceleration phase (from 2 to 40 rpm), followed by 5 minutes of constant phase (40 rpm). For each animal, the average of all the 12 trials was calculated per age point and this value was used to calculate the average for each experimental group and for statistical purposes. ANOVA showed a significant effect of gender on rotarod performance, thus males and females were analyzed separately.
Open field
Open field behavior testing was performed during the dark phase of the light cycle at the Vanderbilt Murine Neurobehavioral Core. Male and female animals, at the age of 3, 6, 9 and 12 months were placed in the ENV-510 open field test chambers (27 cm x 27 cm x 20.3 cm; MED Associates) and monitored for 30 minutes in the dark. The chambers housed 16 infrared beams monitoring X-Y-Z coordinates every 50 milliseconds. Animals were scored for total distance travelled, vertical counts, jump counts and average velocity. Data were recorded and analyzed in Activity Monitor 5.0 (MED Associates). There was no significant influence of gender by ANOVA on open field performance, thus male and female data were pooled for analysis.
Leptin and cytokine measurements in plasma
Blood samples were collected using a submandibular bleeding method [14] with Goldenrod mouse bleeding lancets from mice at 2, 3, 5, 6, 8 and 10 months of age, 2-4 hours before the end of the light phase of the light cycle. Blood was collected to EDTA coated tubes and samples were centrifuged at 1850 x g, for 15 minutes, at 4OC. Plasma was snap frozen in liquid nitrogen and stored at −80OC. Leptin and cytokines (IL-4, IL-6, MIP2, KC, IFNγ, TNFα) were measured by the Vanderbilt Hormone Assay Core using Mouse Adipokine Kit and Mouse Cytokine / Chemokine Kit Panel 1 (Millipore), respectively, according to the manufacturer’s recommendations. Luminex 100 with Xponent 3.1 software was used to quantify the assays. ANOVA failed to find a significant difference by gender, thus male and female data were combined for analysis to maximize statistical power.
Immunohistochemistry
Animals were anesthetized with isoflurane and transcardially perfused with 4% paraformaldehyde (PFA) in 0.1 M phosphate buffer, pH 7.4. The brains were post-fixed in 4% PFA at 4OC for 24 h, immersed in sucrose solutions (15%, 20% and 30%) and frozen. Frozen brains were thawed in cryoprotectant (20% glycerol/2% DMSO) and multiple brains were embedded in a gelatin block and post-fixed in formaldehyde containing cryoprotectant; sections were freeze cut at 35μm, transferred to cryoprotectant, and stored at −20°C (Neuroscience Associates). Sections were stained under free-floating conditions for GFAP (glial fibrillary acidic protein; DAKO, 1:100,000), for Iba-1 (WAKO, 1:40,000), and for polyglutamine, following formic acid antigen retrieval, with biotinylated-4H7H7 (80 ng/ml)[15]. The following general protocol was used: sections were blocked by reacting aldehyde sites with ethanolamine and reducing Schiff bases with ascorbic acid and treating with 0.5% Triton X-100 in PBS, followed by overnight incubation in primary antibody; for glial staining sections were washed, reacted with biotinylated anti-rabbit IgG (Vector), followed by Elite ABC reagent (Vector); peroxidase reactivity was detected with nickel-enhanced DAB using glucose-glucose oxidase to generate hydrogen peroxide in Tris-imidazole buffer. Biotinylated-4H7H7 localization was visualized by reaction with Elite ABC reagent followed by tyramide amplification using biotin-PEG-tyramide and a second reaction with Elite ABC reagent, and the peroxidase detected as above. Sections were mounted on glass slides, dehydrated and processed through alcohols and xylene substitute and cover-slipped with xylene substitute mountant (Shandon). When required mounted sections were lightly counterstained with thionin for Nissl substance.
High resolution digital images were collected on a Nikon Eclipse Ni microscope and minimally manipulated in Photoshop CS5 using consistent adjustments. Staining intensity was quantified in Photoshop by inverting gray scale images, selecting regions of interest with the lasso tool and using the median intensity determined by the Histogram tool.
Volumetric MRI
Mice were perfused with 4% PFA and heads were postfixed in PFA solution. Before imaging, samples were placed in a plastic tube with Fomblin Profludropolyether to prevent dehydration. Samples were imaged using a 9.4 Tesla scanner (vertical bore, Bruker Biospin) using a 15 mm volume coil. 3D T2-weighted Rapid Acquisition with Refocused Echoes (RARE) sequence was used, with the following parameters: RARE factor of 8, Effective Echo Time (TE) = 43.82 ms, Repetition Time = 2000 ms, FOV = 25.6 mm x 14.4 mm x 10 mm, number of average = 4. The image had a matrix size of 256 x 144 x 100, which was zero-filled to 256 x 256 x 128. Signals from tissue outside of the brain were removed from acquired subject image by skull stripping. After initial affine alignment, the intensity-corrected subject T2-weighted image and the atlas T2-weighted image [16] were submitted to a Linux cluster running Large Deformation Diffeomorphic Metric Mapping (LDDMM) [17] using the DiffeoMap software package (www.mristudio.org, X. Li, H. Jiang, and S. Mori, Johns Hopkins University). A topology-preserving mapping between the subject and atlas T2-weighted image was generated by single-channel LDDMM, and inverse mapping (from atlas space to subject space) was applied to the predefined structural segmentations in the atlas space. The segmentation quality of striatum was inspected and manual touch-up was applied when necessary. The volume of the whole brain and the inverse transformed structures were reported in DiffeoMap.
TSPO and dopamine receptor autoradiography
Translocator Protein 18kDa (TSPO) and dopamine receptors (D1, D2) were visualized using quantitative receptor autoradiography. Fresh-frozen brains were sectioned (20 μm) on a freezing cryostat and thaw-mounted onto poly-L-lysine-coated slides (Sigma). [3H]-DPA-713 (83 Ci/mmol; Quotient Bioresearch) autoradiography was used to measure TSPO. Slides were dried at 37°C for 30 min, followed by a prewash in 50 mM Tris-HCl buffer (pH 7.4) for 5 minutes at room temperature. Sections were then incubated in 0.5 nM [3H]-DPA-713 buffer for 30 minutes at room temperature. Non-specific binding was assessed in adjacent sections incubated in the presence of 10 mM PK11195 (Sigma). The reaction was terminated by two 3-minute washes in cold buffer (4°C) and two dips in cold water (4°C). Sections were apposed to Kodak Bio-Max MR films (Sigma) with [3H]-Microscales (Perkin Elmer) for 4 weeks.
[H3]-SCH-23390 (84.3 Ci/mmol; Perkin Elmer) autoradiography was used to measure D1 dopamine receptors. Sections were dried at 37°C for 30 min, followed by a preincubation for 20 min. at room temperature in 50 mM Tris buffer, pH 7.4, containing 120 mM NaCl, 5 mM KCl, 2 mM CaCl2, 1 mM MgCl2. Sections were then incubated at room temperature for 30 min in the same buffer (pH 7.4) containing 1 mM ascorbic acid, 40 nM ketanserin (Sigma), and 1 nM [H3]-SCH-23390. Non-specific binding was defined in adjacent sections incubated in the presence of 5 μM (+)-butaclamol (Sigma). After incubation, sections were rinsed twice for 20 seconds each in cold buffer containing 1 mM ascorbic acid (pH 7.4, 4°C), then dipped in cold distilled H2O (4°C), and dried under a stream of cool air. Sections were apposed to Kodak Bio-Max MR films (Sigma) with [3H]-Microscales (Perkin Elmer) for 5 weeks.
[H3]-Spiperone (85.4 Ci/mmol; Perkin Elmer) autoradiography was used to measure D2 dopamine receptors. Sections were dried at 37°C for 30 min, followed by a prewash for 5 minutes at 36°C in 50 mM Tris buffer, pH 7.1, containing 120 mM NaCl, 5 mM KCl, 2 mM CaCl2, 1 mM MgCl2. Sections were then incubated at 36°C for 30 min in the same buffer (pH 7.1) containing 40 nM ketanserin (Sigma), and 1.4 nM [H3]-Spiperone. Non-specific binding was assessed in adjacent sections incubated in the presence of 1 μM (+)-butaclamol (Sigma). After incubation, sections were rinsed three times for 20 seconds each in cold buffer (4°C), then dipped in cold distilled H2O (4°C), and dried under a stream of cool air. Sections were apposed to Kodak Bio-Max MR films (Sigma) with [3H]-Microscales (Perkin Elmer) for 4 weeks. All images were acquired and quantified using the MCID software (InterFocus Imaging Ltd.).
Statistical Analysis
Two-way univariate and multivariate ANOVA was performed using SPSS Statistics 19 (IBM). Student’s t-test was used for pairwise comparisons between experimental groups (Excel 2008; Microsoft).
RESULTS
Mutant Htt protein is widely expressed in brain of BAC-225Q mice and forms abundant, protein aggregates throughout the brain
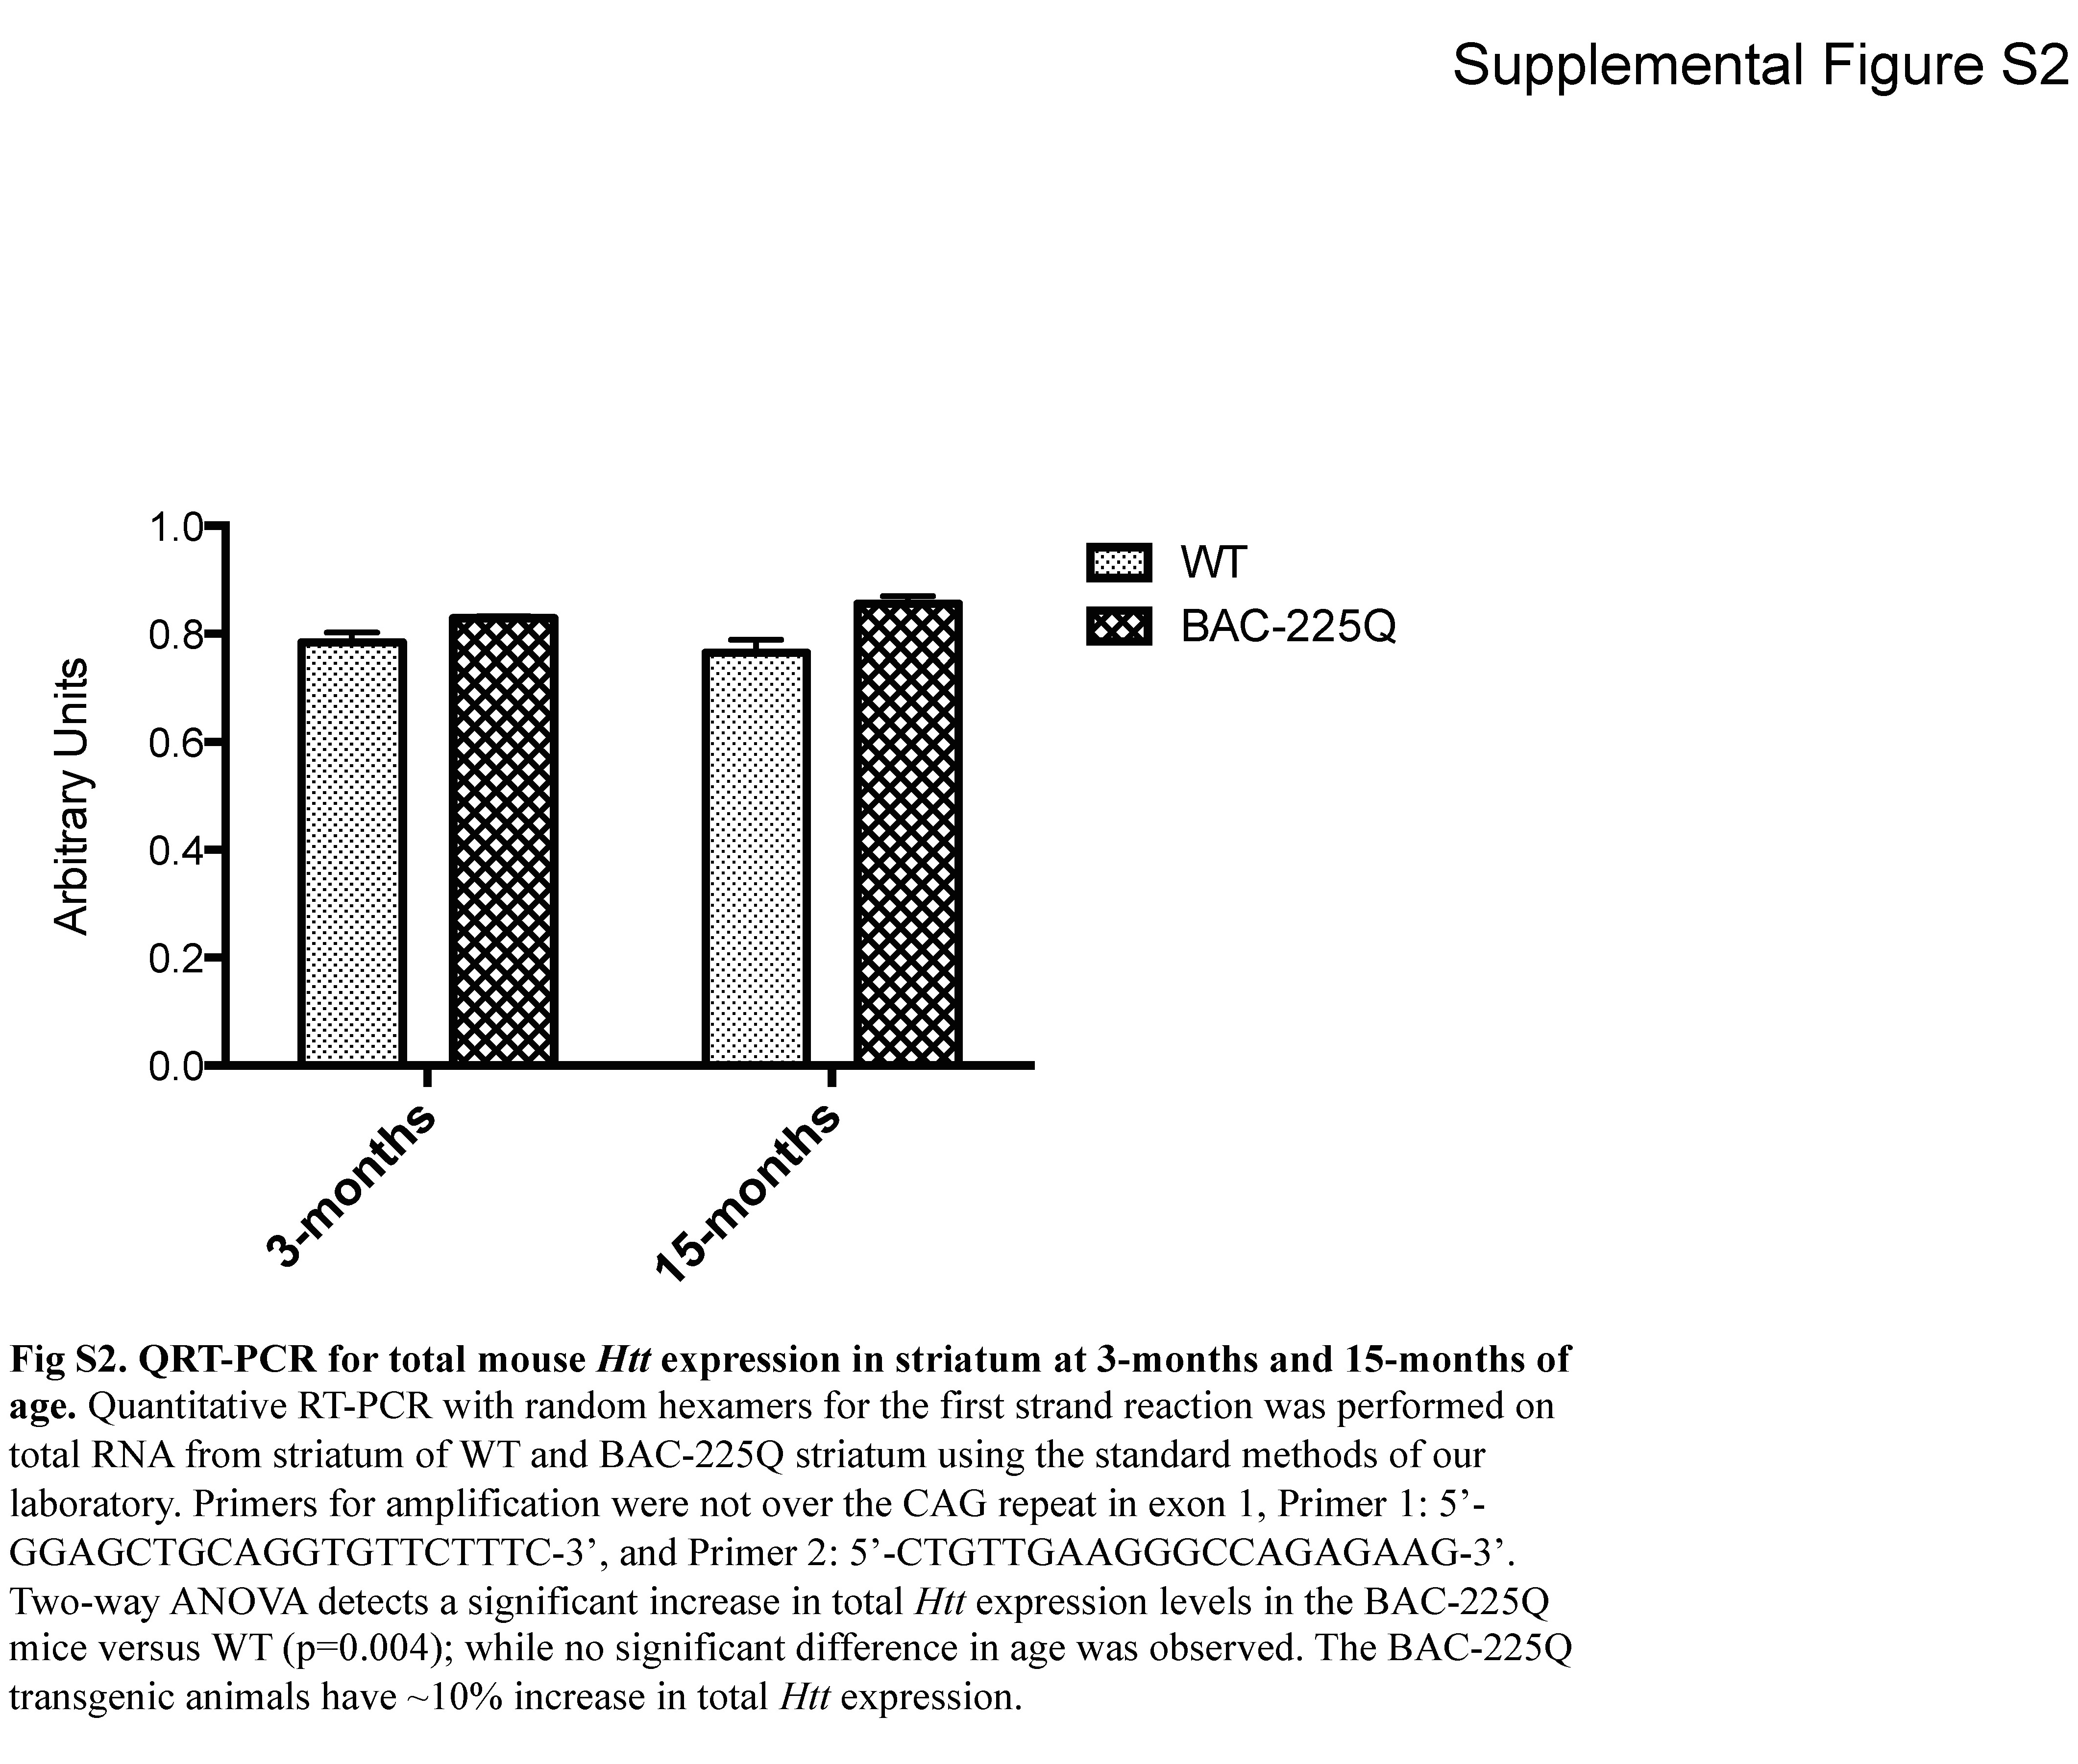
The polyQ-expanded HTT was identified by western blotting with 1HU-4C8 (MAB 2166) antibody as a novel band specific to transgenic tissue, retarded in migration above the WT Htt band, and was present in all examined brain regions of all the analyzed BAC-225Q animals, but not in WT littermates (Fig. 1A). The levels of transgenic protein were approximately 50% lower than those of WT protein in BAC-225Q animals in all analyzed regions, when compared to full-length protein present as a monomer on SDS gel, and no difference in this ratio was found between striata from 3- and 12-month-old mice (Fig. 1A), indicating that there is not a substantial decrease of the extractable expanded mutant Htt protein relative to WT Htt protein over this time frame. Examination of cortical protein extracts in full uncut western blots probed with anti-polyglutamine MAB1574 (1C2 clone) demonstrated the expression of mutant polyglutamine expanded Htt in the BAC-225Q animals, and no abundant Htt protein fragments were seen in either 3-month or 15-month BAC-225Q transgenic animals (Fig. 1B). Furthermore, the levels of extractable mutant Htt protein were similar between 3-month and 15-month BAC-225Q cortex. To determine how mRNA expression levels of the mutant Htt transgenic allele versus the endogenous WT Htt alleles compared to the relative expression levels of the mutant versus WT Htt protein seen by western, we assessed total mouse Htt mRNA levels in striata of 3-month and 15-month old animals by quantitative RT-PCR (Supplemental Fig. S2). This also allowed us to test whether mRNA expression of the mutant Htt transgene was altered by age. Two-way ANOVA demonstrated a significant ~10% increase in total Htt mRNA expression in BAC-225Q animals versus WT (p=0.004), with no significant difference by age (p=0.834).
Fig. 1.

Transgenic polyQ Htt protein is widely expressed in brain of BAC-225Q mice, and accumulates as large neuropil aggregates. (A) The levels of total Htt protein (MAB2166, n=3) were measured by western blotting for Htt protein. Transgenic polyQ Htt is expressed at about half the level of endogenous Htt in striatum (st) of 3-month old animals and cerebellum (ce), cortex (co), hippocampus (hi) and striatum of 12-month old animals. (B) Full uncut gel western blots of cortex extracts from 3-month-old animals were probed for poly-glutamine proteins (MAB1574, clone 1C2). Aside from the full-length mutant Htt protein band (indicated by arrow) no other abundant BAC-225Q specific protein fragments were detected between WT and BAC animals at either 3-months or 15-months of age. Analysis of the same protein extracts with anti-Htt MAB2166 confirmed the absence of mutant Htt protein fragments in the BAC-225Q cortex (data not shown). (C) Mutant Htt immunostaining was performed in cortex of 6-month (left) and 12-month old (right) BAC-225Q mice and WT mice (not shown) with 4H7H7 antibody. Representative fields from two animals (upper and lower) are shown of cortical layers I, II and III. Animals in upper fields had a relatively lower aggregate abundance compared to the animals in the lower fields. Nuclear accumulation is abundant in 6-month old animals, with sparse neuropil aggregates; in contrast 12-month-old animals exhibit extensive and larger neuropil aggregates with concomitant decrease in nuclear immmunoreactivity. All fields are 225μm x 170μm.
An important hallmark of HD is accumulation of HTT aggregates in brain. To identify Htt inclusions we carried out immunohistochemical analysis of brains of 6- and 12-month-old BAC-225Q mice and WT littermates using 4H7H7 antibody (Fig. 1C). We detected an extensive deposition of polyglutamine-containing aggregates in transgenic animals only; staining was variable but predominantly of neuropil aggregates, with additional neuronal nuclear staining only at 6 months of age. We noted a high degree of animal-to-animal variability in the relative abundance of mutant Htt aggregates (Table 1). We quantified the abundance of aggregates in two representative animals of both sexes, one with relatively high and another relatively low aggregate loads at 6 months (Table 1). The most affected regions at 6 months were the hippocampus and associated cortex, and the bed nucleus of the stria terminalis, cerebellar nuclei and Purkinje cells, both superior and inferior colliculi. Striatum at 6 months, however, exhibited minimal neuropil aggregates, but widespread neuronal nuclear staining. These, and additional selected regions with semi-quantitative analysis are shown in Supplemental Fig. S3 and Table 1. There are variable numbers of neuropil aggregates and some neuronal nuclear staining throughout the cerebrum. Studies at 12 months were limited to analysis of cortical regions where a marked reduction in the extent of neuronal nuclear staining was seen together with an increase in the number and size of neuropil aggregates (Fig. 1C).
TABLE 1. Distribution of mutant Htt aggregates at 6 months.
Diffuse nuclear or neuropil aggregate levels were scored from (-) absent, (tr) trace, to (+, ++, +++, or ++++) for increasing abundance. (High) and (Low) indicate representative animals with relatively high or low aggregate density representing the variability between animals of the same sex.
| Neuroanatomical location | Male | Female | |||||||
|---|---|---|---|---|---|---|---|---|---|
|
| |||||||||
| High | Low | High | Low | ||||||
|
| |||||||||
| Nuclear | Neuropil | Nuclear | Neuropil | Nuclear | Neuropil | Nuclear | Neuropil | ||
|
| |||||||||
| Olfactory system | Anterior olfactory nucleus | ++ | ++ | + | ++ | ++ | ++ | tr | ++ |
|
|
|||||||||
| Lateral olfactory tract | - | ++++ | - | ++ | - | ++++ | - | +++ | |
|
| |||||||||
| Cortex | Frontal cortex | +++ | ++ | tr | + | ++ | + | - | ++ |
|
|
|||||||||
| Primary motor cortex | +++ | ++ | + | + | ++ | + | tr | ++ | |
|
|
|||||||||
| Secondary motor cortex | +++ | +++ | + | + | ++ | ++ | + | ++ | |
|
|
|||||||||
| Cingulate cortex | +++ | +++ | + | + | ++ | ++ | + | ++ | |
|
|
|||||||||
| Primary somatosensory cortex | +++ | ++ | + | + | +++ | + | tr | + | |
|
|
|||||||||
| Piriform cortex | ++++ | ++ | + | + | ++++ | ++ | +++ | + | |
|
|
|||||||||
| Secondary somatosensory cortex | ++ | ++ | + | + | +++ | + | tr | + | |
|
|
|||||||||
| Retrosplenial cortex | +++ | +++ | + | + | ++ | ++ | tr | +++ | |
|
|
|||||||||
| Temporal association cortex | ++ | +++ | tr | ++ | + | +++ | - | +++ | |
|
|
|||||||||
| Primary visual cortex | ++ | +++ | + | + | ++ | ++ | - | ++ | |
|
| |||||||||
| Striatum | Nucleus accumbens | +++ | + | + | + | +++ | + | + | + |
|
|
|||||||||
| Ventral pallidum | - | ++ | - | tr | - | ++ | - | ++ | |
|
|
|||||||||
| Caudate/putamen | ++++ | tr | ++ | tr | ++++ | tr | + | tr | |
|
|
|||||||||
| Globus pallidus | - | tr | - | tr | - | + | - | + | |
|
| |||||||||
| Septum | Septohippocampal nucleus | tr | ++ | - | ++ | - | ++ | - | +++ |
|
|
|||||||||
| Lateral septal nucleus | tr | ++ | - | + | - | ++ | - | ++ | |
|
| |||||||||
| Bed nucleus of the stria | Medial | tr | ++++ | - | ++ | tr | +++ | - | ++ |
|
| |||||||||
| Hypothalamus | Magnocellular preoptic nucleus | ++ | + | + | + | +++ | ++ | tr | + |
|
|
|||||||||
| Ventromedial hypothalamic nuclei | - | ++ | - | ++ | - | +++ | - | ++ | |
|
|
|||||||||
| Lateral hypothalamic area | tr | + | - | + | - | + | - | + | |
|
|
|||||||||
| Premammilary nucleus | - | ++ | - | +++ | - | ++ | - | ++ | |
|
| |||||||||
| Thalamus | Laterodorsal thalamic nuclei | ++ | ++ | tr | + | ++ | ++ | ++ | ++ |
|
|
|||||||||
| Ventral thalamic nuclei | +++ | + | + | ++ | +++ | ++ | ++ | ++ | |
|
|
|||||||||
| Medial habenular nucleus | + | ++ | tr | - | + | + | tr | - | |
|
| |||||||||
| Geniculate | Dorsal lateral geniculate nucleus | ++ | + | + | + | ++ | ++ | + | + |
|
|
|||||||||
| Pregeniculate nucleus | + | ++ | - | + | - | ++ | - | ++ | |
|
|
|||||||||
| Medial geniculate | ++ | + | + | + | ++ | + | tr | + | |
|
| |||||||||
| Amygdala | Central amygdaloid nucleus | + | ++ | - | ++ | tr | +++ | - | +++ |
|
|
|||||||||
| Basolateral amygdaloid nucleus | +++ | ++ | + | + | ++ | ++ | - | ++ | |
|
|
|||||||||
| Basomedial amygdaloid nucleus | ++ | +++ | + | ++ | + | +++ | - | +++ | |
|
| |||||||||
| Hippocampus | CA1 | ++++ | - | ++ | - | ++++ | - | tr | - |
|
|
|||||||||
| CA2 | ++ | - | + | - | ++ | - | tr | - | |
|
|
|||||||||
| CA3 | +++ | - | + | - | +++ | - | - | - | |
|
|
|||||||||
| Polymorphic layer (CA4) | + | ++++ | - | +++ | + | ++++ | + | +++ | |
|
|
|||||||||
| Dentate gyrus | + | - | - | - | + | - | - | - | |
|
|
|||||||||
| Subiculum | +++ | +++ | + | +++ | ++ | +++ | tr | +++ | |
|
| |||||||||
| Colliculi | Superior colliculus superficial gray | + | ++ | - | ++ | tr | ++ | - | ++ |
|
|
|||||||||
| Inferior colliculus | + | ++ | - | ++ | + | +++ | - | ++ | |
|
| |||||||||
| Mesencephalon | Red nucleus | + | + | - | - | ||||
|
|
|||||||||
| Pontine nucleus | + | ++ | + | ++ | + | ++ | tr | ++ | |
|
|
|||||||||
| Olivary nuclei | ++ | + | - | + | + | ++ | - | ++ | |
|
| |||||||||
| Cerebellum | Purkinje cell layer | +++ | - | ++ | - | +++ | - | +++ | - |
|
|
|||||||||
| Cerebellar nuclei | - | +++ | - | +++ | - | ++++ | - | +++ | |
BAC-225Q mice are characterized by reduced body weight and early behavioral abnormalities
HD patients experience weight loss [18] and we observed marked reductions in body weight in BAC-225Q mice compared to WT littermates (Fig. 2). In females this reduction was detected before 2 months of age, and was initially driven by slower weight gain and then by total arrest of weight gain. Weight deficiency in males appeared after body weight of BAC-225Q males had reached a plateau (~4.5 months) (Fig. 2). In both WT males and females, body weight continuously increased until the tenth month of age, resulting in strong differences between WT and transgenic mice (23% loss in males and 16% in females).
Fig. 2.

Decreased body weight in BAC-225Q mice relative to WT. Body weight of BAC-225Q animals and their WT littermates was measured from 1st to 10th month of age (n=9–15). Progressively decreased weight is observed in both BAC-225Q males (from 4.5 months, *t-test, p<0.05) and females (from 2 months, #t-test, p<0.05), when compared to WT mice. Three-way ANOVA reveals effect of genotype (F(1,1862)=737.03, p<0.001), effect of gender (F(1,1862)=1877.94, p<0.001), effect of age (F(38,1862)=63.856, p<0.001 and genotype-age interaction (F(38, 1862)=7.742, p<0.001).
To monitor motor performance of BAC-225Q animals, we used the accelerating rotarod test. The first cohort of animals was examined at 3, 4, 5, 6, 7, 8, 9, 12 and 15 months of age. We identified a deficiency in rotarod performance beginning at 3 months of age (performance time loss by 28% in males (Fig. 3A) and 19% in females (data not shown)), this phenotype was static until 7 months of age, but then regressed in older animals (Fig. 3A). Nevertheless, ANOVA showed a strong effect of genotype for both genders. We also found a difference between genders in age-dependent loss of motor deficiency – females were significantly impaired only at 3 and 4 months (data not shown), while males were affected through 9 months of age (Fig. 3A). Despite this apparent recovery in older animals, no genotype-age interaction was found by ANOVA, suggesting that a continued trend toward motor deficiency was present. The loss of rotarod phenotype in BAC-225Q mice at older ages could suggest a training effect, however, we performed rotarod with another cohort of animals, in which the first session was carried out using 6-month-old, rotarod-naïve mice, and then these animals were further tested only at 7 and 12 months of age. In this case, despite a different experimental paradigm than in the first cohort, we obtained the same results – a decreased latency to fall at 6 and 7, but not at 12 months of age in BAC-225Q males, and normal rotarod performance at 6, 7 and 12 months in BAC-225Q females (data not shown). This strongly suggests that factors other than motor skill learning are responsible for the loss of rotarod impairment at later ages in BAC-225Q animals. One possibility is the reduced body weight of the mutant animals compared with WT, as lower body weight is known to be associated with improved performance on rotarod [19, 20].
Fig. 3.

Behavioral abnormalities in BAC-225Q mice. (A) Motor performance was evaluated using accelerating rotarod in 3- to 15-month-old males (n=9–10). Performance of BAC-225Q animals is impaired relative to WT littermates starting from 3 months of age (*t-test, p<0.05). Unexpectedly, this impairment is absent in the aged mice, at 12 and 15 months, and at the earlier time points, between 3rd and 9th month, the rotarod performance deficiency, though present, is not progressive. These observations are confirmed by ANOVA that identifies effect of genotype (F(1,170)=44.744, p<0.001), but not effect of age or genotype-age interaction. (B) Since the rotarod deficit was identified at the earliest examined time point, 3 months of age, another cohort of animals was assessed from 1.5 to 2.5 months (n=9–13). Of the three examined time points, statistically significant difference between BAC-225Q and WT mice is found only at 2 months of age (*t-test, p=0.021), however two-way ANOVA reveals strong effect of genotype on rotarod performance between 1.5 and 2.5 months (F(1,66)=8.048, p=0.006). (C–F) Early hyperactive behavior followed by normalization of the symptoms in BAC-225Q mice. Spontaneous locomotor activity of 3- to 12-month-old mice was examined in open field test (n=16–27). At 3 months of age, (C) longer distance travelled (*t-test, p=0.42) as well as (D) increased vertical counts (*t-test, p=0.023), (E) jump counts (*t-test, p=0.023), and (F) average velocity (*t-test, p=0.022) are observed in BAC-225Q animals compared to WT littermates. These alterations, except (F) average velocity at 6 and 9 months of age (*t-test, p=0.12, p<0.001, respectively) are not found in the later time points. Two-way multivariate ANOVA reveals effect of age on total distance travelled (F(3,151)=10.015, p<0.001), vertical counts (F(3,151)=5.454, p=0.001), jump counts (F(3,151)=13.939, p<0.001), and average velocity (F(1,151)=20.099, p<0.001). Effect of genotype is found for vertical counts (F(1,151)=8.964, p=0.003) and average velocity (F(3,151)=3.356, p=0.021).
Because we identified a rotarod performance decline at age 3 months, we examined one more cohort of mice at a younger age. The analyses at 1.5, 2 and 2.5 months also showed strong effects of genotype for both genders, however the impairment was stronger in females (significant differences at all the three analyzed time points; data not shown) than in males (significant differences were restricted to the 2 months time point only, but the trend was present at 1.5 and 2.5 months) (Fig. 3B). Of note, the rotarod performance impairment in these younger BAC-225Q mice occurs prior to the significant differences in body weight between genotypes.
To determine if there was a relationship between Htt aggregate load and rotarod performance within the BAC-225Q animals we assessed aggregate load in three paired sets of transgenic animals for which we had acquired rotarod data ahead of sacrificing for immunohistochemical analysis. We examined two pairs of animals at 6-months of age (rotarod performance between 1.5 and 2.5 months of age), and one pair of animals at 12 months of age (rotarod performance at 6 and 7 months of age). We focused on the aggregate load of the lateral olfactory tract – as unlike other regions of the brain the lateral olfactory tract had almost exclusively neuropil aggregates at both ages, with minimal nuclear accumulation. In all instances the animal with the higher aggregate load had relatively poor rotarod performance in the preceding months. Paired t-test analysis demonstrated a significant (p=0.011) difference in the ratio of average aggregate load over the average rotarod performance in the animals with relatively higher aggregate load versus the animal with a lower intensity aggregate staining.
To examine spontaneous motor activity we performed the open field test. At 3 months we observed hyperactivity as reflected by increase in total distance travelled, vertical and jump counts, and average velocity in BAC-225Q mice (Fig. 3C-F). This early spontaneous behavioral impairment regressed in older animals.
Summarizing, we identified very early abnormalities in BAC-225Q mice, represented by reduced body weight and behavioral impairment. The body weight deficiency was progressive, and may have been responsible for regression of behavioral impairment, observed at later time points.
Blood markers of HD in BAC-225Q mice
Two important groups of markers identified in the blood of HD patients are those related to inflammation and energy metabolism [21–23]. We analyzed levels of several such biomarkers in BAC-225Q mouse plasma between 2 and 10 months of age. Of the six cytokines measured, two (IL-4 and MIP2) were below detection limit, and for three others (IFNγ, IL-6 and TNFα) no genotype-dependent alterations were observed (data not shown). However, alterations in the concentration of keratinocyte chemoattractant (KC), a murine functional homologue of human IL-8 were detected [24]. We observed increased levels of KC in plasma of 10-month-old BAC-225Q mice, and a trend towards an increase at 6 months (Fig. 4A). Besides cytokines, we examined plasma levels of leptin, a central regulator of energy metabolism [25], and found its levels increased in BAC-225Q mice starting from 6 months of age (Fig. 4B). The significant changes in leptin levels (6 months) occur after a decrease in body weight is observed in BAC-225Q mice (5 months or younger), though whether it represents a cause or effect of the weight phenotype is unclear.
Fig. 4.

Increase in plasma levels of KC and leptin in BAC-225Q mice. The levels of seven HD-associated blood markers were measured in plasma of BAC-225Q mice. IL-4 and MIP2 are below detection limit, for IFNγ, IL-6 and TNFα no differences are found between BAC-225Q and WT mice, but levels of pro-inflammatory chemokine, KC (mouse homologue of human IL-8), and of energy metabolism-regulating hormone, leptin, are altered (n=12-18, n=12–17, respectively, gender balanced). (A) Plasma concentrations of KC are elevated in 10-month-old BAC-225Q animals (*t-test, p=0.014). (B) Leptin levels are increased in BAC-225Q mice at 6, 8 and 10 months of age (*t-test, p<0.001, p=0.002, p=0.038, respectively).
BAC-225Q mice display widespread brain atrophy
To investigate the effect of transgene expression on brain volume we analyzed fixed brains from 3- and 10-month-old female mice using volumetric MRI measurements. We found that total brain volume was decreased by 6.4% in 3 month-old BAC-225Q animals (Fig. 5A). This was an effect of widespread atrophy as we were not able to distinguish any particularly affected region(s). At this age, 13 of a total of 27 brain regions examined, exhibited significantly decreased volumes in BAC-225Q mice compared to WT littermates (Fig. 5A). The affected regions included both gray and white matter. Importantly, volume of the striatum, a primary site of neurodegeneration in adult-onset HD in humans [26], was not changed at this age. The widespread brain atrophy was progressive – at 10 months we observed total brain volume loss by 12% and found 19 of 27 regions to be significantly reduced (Fig. 5B). At this time point we also observed a 10% loss of striatal volume in striatum as well as decreased neocortex volume (another prominent site of neurodegeneration in HD [27, 28]). Other regions affected at 10 months, but not at 3 months included cingulum, stria medullaris, fasciculus retroflexus, fornix, anterior commissure and corpus callosum/external capsule, suggesting a pronounced effect on white matter tracts (Fig. 5). This early, widespread pathology suggest that this mouse model recapitulates features of juvenile-onset HD more so than adult-onset HD.
Fig. 5.

Progressive loss of brain volume in BAC-225Q mice. Brain volumes were measured using MRI volumetric analysis in BAC-225Q mice at 3 and 10 months of age (n=4). (A) Total brain volume (*t-test, p=0.039) and volumes of 13 out of 27 analyzed brain regions (*t-test, p<0.05) are decreased in BAC-225Q mice compared to WT littermates at 3 months of age. (B) At 10 months of age a loss of total brain volume is more prominent (*t-test, p=0.001) and 19 brain regions with decreased volumes (*t-test, p<0.05) are identified.
BAC-225Q mice exhibit widespread gliosis and loss of striatal dopamine receptors
Glial cell activation and neuroinflammation often accompanies neurodegeneration. We analyzed gliosis in BAC-225Q mouse brain by immunohistochemical detection of astrocyte- and microglia-specific markers, GFAP and Iba1, respectively. This analysis revealed no significant increase in gliosis at 6 months (data not shown), but showed a significant increase in staining for markers of both astrogliosis and microgliosis in cortex at 12 months (Fig. 6).
Fig. 6.

Gliosis in 12-month old BAC-225Q mouse brain versus WT mouse brain. Microgliosis and astrogliosis were analyzed by immunohistochemical detection of Iba1 and GFAP, respectively. S1 cortex is shown, with quantification in arbitrary units (* p<0.01 t-test, n=6, 3 animals per genotype, left and right hemispheres). All fields are 200μm x 160μm.
In addition to conventional immunohistochemistry we performed TSPO (Translocator Protein 18 kDA, formerly known as Peripheral Benzodiazepine Receptor (PBR)) autoradiography in several brain regions of BAC-225Q animals. TSPO is a sensitive marker of neuroinflammation and active gliosis [29]. Additionally, to confirm and validate TSPO autoradiography as a marker of neurodegeneration in HD animals, we also performed this assay in an established HD mouse model, YAC128 (JAX, #004938, Bar Harbor, ME, USA), and compared region- and age-specific changes in TSPO activation between both models. YAC128 mice have been shown to display late, adult-onset HD-like pathology characterized by loss of striatal and cortical volumes beginning at 9 to 12 months, respectively, selective striatal neuronal loss from 12 months, rotarod performance deficits from 6 months, and hypoactivity on open field from 12 months [30]. In contrast, as shown in this manuscript, the BAC-225Q animals display early (< 3 months) and more widespread neuropathology. The YAC128 mice are in an FVB genetic background [30], so each line was compared to WT littermates of its own background strain. In BAC-225Q mice, we observed TSPO up-regulation in every analyzed region except hippocampus (Fig. 7A). Interestingly, in some of these regions, the TSPO phenotype was present in spite of an absence of volume loss as measured by MRI (striatum at 3 months and periaqueductal gray and hypothalamus at both time points); in contrast, other regions with volume loss were not accompanied by TSPO up-regulation (thalamus and globus pallidus at 3 months, hippocampus at both time points). These findings suggest that despite widespread and uniform volume loss, there may be regional differences in the mechanisms contributing/accompanying neurodegeneration in BAC-225Q animals. In YAC128 mice, TSPO was up-regulated in striatum at 10 months and thalamus at 6 and 10 months (Fig. 7B). These results indicate a juvenile-like, widespread and early pathology in the BAC-225Q HD model, and validate adult-like, region-specific and late pathology in the YAC128 HD model.
Fig. 7.

Early, widespread up-regulation of TSPO, a neuroinflammation biomarker, in brain of BAC-225Q animals, and late, region-specific up-regulation in YAC128 mice, an established model of adult-onset HD. (A) Binding of [3H]-DPA-713, a ligand of neuroinflammation biomarker, TSPO, was measured in BAC-225Q mice using autoradiography (n=6-8). TSPO is up-regulated in all examined regions except hippocampus. In most of the analyzed regions TSPO pathology starts early – increased ligand binding is observed at 3, 6 and 10 months in periaqueductal gray (*t-test, p=0.017, p<0.001, p<0.001, respectively), hypothalamus (p=0.013, p=0.021, p=0.015, respectively), motor cortex (p=0.018, p<0.001, p<0.001, respectively) and striatum, (p=0.011, p=0.003, p<0.001, respectively) and at 6 and 9 months in globus pallidus (p<0.001, p=0.017, respectively) and thalamus (p<0.001, p=0.003, respectively). (B) To validate TSPO as a marker of ongoing neurodegeneration in HD models, autoradiography experiments were performed also in the most commonly used transgenic model of adult-onset HD, YAC128 mice (n=7–10). Only three regions with increased binding of [3H]-DPA-713 are found, and TSPO phenotype is observed later than in BAC-225Q animals – at 6 months in hypothalamus (*t-test, p=0.026), at 6 and 10 months in thalamus (*t-test, p=0.021, p=0.036, respectively) and at 10 months in striatum (p=0.048). These findings confirm juvenile-like, widespread degeneration in BAC225Q mice and more specific, adult-like degeneration in YAC128 mice.
Striatum is a primary site of pathology in HD [26, 31] and we observed a two-stage pattern of neurodegeneration of this region in the BAC-225Q model (TSPO activation starting at 3 months and volume loss at 10 months). Striatal medium spiny neurons (MSNs) are particularly prone to degeneration in HD [26]. Two main subtypes of MSNs are distinguished by expression of D1 or D2 dopamine receptors, with the latter being more vulnerable in adult-onset HD. To examine MSN subtype involvement in BAC-225Q mouse pathology, we performed a radioligand binding assay in striata of 3, 6 and 10-month-old animals (Fig. 8). YAC128 mice, characterized by striatal MSN loss [30], were also included in this experiment as a positive control and comparison. D1 receptor ligand binding was found to be decreased in BAC-225Q mice at 6 months, however not significantly different than control at 10 months. No alteration in D1 receptor binding was observed in YAC128 mice (Fig. 8A) at either age point. In both models we observed a statistically significant decrease in D2 receptor levels at 6 and 10 months, however BAC-225Q mice exhibited a greater change at both time points (loss of ~30% signal vs loss of ~15% signal in YAC128 mice). In HD patients, striatal neuropathology follows a specific pattern – from caudal to rostral striatum [26]. We analyzed dopamine receptors in striatal subdivisions in BAC-225Q mice, and found a similar spatio-temporal pattern of changes in radioligand binding - starting with D1 loss at 3 months in caudal striatum, followed by a decrease in both receptors at 6 months in all the subdivisions, and a loss of D2 ligand binding at 10 months in the rostral subdivision (Fig. 8B). In YAC128 animals similar changes were seen, but limited only to D2 receptors, and delayed compared to BAC-225Q mice (Fig. 8B).
Fig. 8.

Loss of ligand binding to dopamine receptors in HD mice. (A) Autoradiography experiments using [3H]-SCH1337, D1 receptor ligand and [3H]-spiperone, D2 receptor ligand, were performed in striata of BAC-225Q (n=4-12) and YAC128 animals (n=5–12). In BAC-225Q mice loss of ligand binding to D1 receptor is found at 6 months of age (*t-test, p=0.002), and to D2 receptor - at 6 and 10 months of age (*t-test, p<0.001; p=0.035, respectively). In YAC128 animals only loss of D2 ligand binding is observed (*t-test, p=0.011; p=0.03, at 6 and 10 months respectively). (B) Dopamine receptor ligand binding in striatum was assessed also in spatiotemporal manner. In BAC-225Q mice, the impairment of either receptor is age- and subregion-dependent, starting from D1 ligand binding decrease at 3 months in caudal striatum (*t-test, p=0.039), followed by loss of both receptor types at 6 months in all the three subdivisions (*t-test, p=0.021; p<0.001; p=0.003 for D1, and p<0.001; p<0.001; p=0.006 for D2 in respectively, caudal, medial and rostral striatum), and finally D2 loss at 10 months in rostral striatum (*t-test, p=0.014). In YAC128 animals the pattern of D2 receptor pathology appeared to be similar, but delayed compared to BAC-225Q mice. Loss of D2 ligand binding is observed at 6 months of age in caudal and medial striatum (*t-test, p=0.024, p=0.022, respectively), and at 10 months in medial striatum (*t-test, p=0.012). No changes in D2 receptor binding in rostral subdivision is found up to 10 months of age and no D1 pathology is observed in any part of striatum.
To summarize, we observed early, widespread and progressive loss of brain volumes and found activation of the neuroinflammation marker, TSPO, in BAC-225Q mice. Striatal volume was not affected to a greater degree than other brain regions, though early loss of D1 and D2 dopamine receptors was observed in this region.
DISCUSSION
In this study, we have characterized a novel transgenic model of HD, BAC-225Q, that expresses full-length murine Htt with ~225 CAG repeats under control of the mouse Htt promoter/enhancer contained within the BAC transgene. Expression of CAG-repeat expanded full-length mouse Htt under the native mouse promoter ensures that expression of the transgene is controlled by the same cellular mechanisms as expression of WT Htt in the same animal (as it is in HD patients); contrary to other models in which the human HTT promoter (R6/1, R6/2 [32], YAC72 [33] YAC128 [30], BACHD [34]) or the prion promoter (N171-82Q [35]) is used. Additionally, by using mouse Htt rather than the human gene, this model avoids the potential confounder of unexpected protein-protein interactions between human HTT and native mouse proteins. Of note, other models that express CAG-expanded mouse Htt, like the KI HD models, exhibit late behavioral and neuropathological phenotype [36–39]. By expressing the mouse Htt gene with an expanded repeat of ~225 CAGs, we hypothesized that this new model would exhibit earlier phenotypes than previously published full-length mouse Htt models with shorter CAG repeat lengths. We demonstrate here early and widespread neuropathological phenotypes, with similarities to the neurodegenerative features of juvenile HD. The phenotypes in BAC-225Q animals are detected much earlier than in the Q200 heterozygous knock-in model [39]. Similar to BAC-225Q, the Q200 model expresses mouse transgenic Htt with comparable CAG repeat length under the mouse promoter, and would be expected to exhibit similar pathology. Q200 mice are characterized by weight loss (observed only in females) and some locomotor deficits at 11 months of age (but not rotarod performance which was unaffected up to 18 months). Similar to BAC-225Q animals, Q200 mice displayed loss of both D1 and D2 receptors, but without loss of striatal volume or MSN number up to 18 months of age. Also gliosis was observed later in the Q200 mice, with minimal astrogliosis at 9 months of age. Interestingly, inconsistent with CAG repeat length, but consistent with late phenotype onset, Q200 knock-in mice exhibit specific striatal and cortical, adult-onset pathology in contrast to the widespread pathology observed in the BAC-225Q animals [39].
Despite many juvenile onset HD-like phenotypes, the early motor phenotypes of BAC-225Q mice have similarity to the adult-onset form of HD. The initial hyperactivity of BAC-225Q mice (Fig. 3C–F) is consistent with the initial motor changes observed in adult-onset HD patients who typically display chorea, restlessness and involuntary movements as the first motor symptoms of HD [40]. In HD patients, this is believed to be a consequence of impairment to the indirect pathway (D2-receptor expressing MSNs) at early stages of adult-onset HD that precedes impairment of the direct pathway (D1-receptor expressing MSNs) [26, 41–44]. Juvenile HD is typically not associated with early hyperactivity – instead motor deficits in these patients manifest more often as bradykinesia and dystonia correlating with early degeneration of MSNs in both the direct and indirect pathways [41, 45, 46]. Juvenile HD is similar though to late stage adult-onset HD, at which time both populations of MSNs are degenerating and hypokinetic motor symptoms prevail [26, 41]. Despite the initial hyperactivity, the BAC-225Q model showed concurrent and similarly decreased binding of both D1- and D2-receptor ligands in the striatum consistent with neuropathology of both direct and indirect pathways, while the YAC128 model demonstrated a more selective decrease in D2-receptor ligand binding (Fig. 8). Loss of both D1- and D2-receptor classes is more consistent with juvenile HD-like striatal pathology in the BAC-225Q model, in contrast to early adult HD-like striatal pathology (D2-receptor selective loss) in the YAC128 model. Thus the basis for the hyperactive motor phenotypes in the BAC-225Q model in face of concurrent direct and indirect pathway involvement is unclear, but may represent differences in basal ganglia function in humans versus mice.
In addition to hyperactivity, BAC-225Q mice also displayed early locomotor deficiency, detected by the rotarod test, which, however, unexpectedly was found to be regressive with age (Fig. 3A). Similarly, spontaneous motor behavior, after initial hyperactivity, was restored at 6 months (Fig. 3C–E). This is in contrast with HD patients, who display worsening of motor symptoms over time [47]. One factor that may influence the motor phenotype of BAC-225Q mice is body weight loss (Fig. 2). It was shown that decreased body weight correlates negatively with latency to fall in rotarod experiments [19] and is associated with higher motor performance in open field testing [20]. Finally, high levels of neuropil Htt aggregates and loss of diffuse nuclear Htt aggregate staining between 6 months and 12 months (Fig. 1C) correlates with the amelioration of the motor phenotype in BAC-225Q mice. It has been hypothesized that formation of large inclusions of polyglutamine expanded Htt is a mechanism of cellular defense against a more toxic oligomeric species rather than a direct cause of pathology [48, 49]. BAC-225Q mice display extensive aggregation compared to many full-length Htt models, and the aggregates are notably larger in size. For example BACHD animals, in which the transgene is expressed under the human Htt promoter, have much lower aggregate density and are characterized by progressive behavioral and neuropathological phenotypes [34] despite a regional distribution pattern of aggregates similar to what we observed in BAC-225Q mice. In this context, we hypothesize that after reaching toxic levels of Htt accumulation, manifesting as locomotor impairment and neuropathological phenotypes, BAC-225Q animals initiate efficient sequestration of toxic intermediates into neuropil aggregates between 6 months and 12 months of age, protecting them against further progression of pathological phenotypes. This mechanism may be related to the very large Htt CAG repeat in BAC-225Q animals, as it was previously demonstrated in the R6/2 mouse model that there exists a limit to which the relationship between length of polyQ tract and severity of the phenotype is linearly proportional, with the possibility that exceptionally long CAG repeats result in less severe pathogenicity accompanied by increased formation of large aggregates [50]. However, given the observation that individual BAC-225Q animals with more extensive neuropil aggregation have relatively poor rotarod performance, a role for clearing total mutant Htt accumulation also appears to correlate with improved performance.
The body weight phenotype in BAC-225Q mice, manifested as a failure to gain weight from about 4 months of age onward, is consistent with human HD pathology, where progressive inexplicable loss of weight is a non-neurological hallmark of HD [18, 51, 52]. Of note, our data on the surface contradicts reports showing that expression of full-length human HTT increases body weight in a level-dependent but polyQ tract length-independent manner [53, 54]. Despite over-expression of total Htt in our model (two WT alleles, and the mutant transgenic allele) we do not observe a weight gain phenotype. In fact, our model expressing mutant mouse Htt, in addition to both copies of the endogenous mouse Htt gene, results in weight loss (Fig. 2), consistent with human pathology, suggests the weight gain phenotype of mouse models expressing human HTT [34, 53, 55] may be attributed to the expression of specifically the human isoform of Htt in the mouse. In support of this idea, a weight loss phenotype is also observed in the zQ175 knock-in model [56]. Furthermore, the weight gain phenotype of transgenic mouse models may also be mouse strain-dependent, as the YAC128 transgenic construct in the C57BL/6 strain does not alter body weight [57].
Leptin is a major regulator of body weight, a hormone which induces a long-term inhibition of food intake, and whose levels are often altered in diseases manifested by body weight alterations [58, 59]. There are conflicting reports on the levels of circulating leptin in HD patients, with both decreases [21, 23] and increases (in a CAG length dependent manner; [60]) being reported. We found that leptin concentrations were elevated in the plasma of BAC-225Q mice (Fig. 4B), which may be partially responsible for the decrease in body weight in this model. However it should be noted that weight deficiency was observed starting from an earlier time point (Fig. 2) than the increase in leptin levels (Fig. 4B). Leptin acts in the brain on the hypothalamus and it was recently suggested that this region may also exhibit early changes in HD pathology [61–63]. In BAC-225Q mice, we identified up-regulation of TSPO in the hypothalamus (Fig. 7A) suggestive of neuropathology in this region, which may be related to impaired leptin homeostasis.
Despite widespread HTT expression throughout the brain [64], adult-onset HD is characterized by brain region selectivity with striatal degeneration being the most prominent [26]. However, as more sensitive techniques of brain imaging are employed, other regions of degeneration have been identified including cerebral cortex, globus pallidus, thalamus, hypothalamus, white matter and others, even at the presymptomatic stage [3, 63, 65, 66]. Additionally, it was shown that longer CAG repeat number correlates with more widespread neurodegeneration and that in juvenile HD, the extent of the atrophy in other brain regions, including cerebral cortex, hippocampus, amygdala, brainstem and cerebellum, is comparable to that seen in striatum [67]. In BAC-225Q mice we found predominant aggregation of Htt in hippocampus and cerebellum (Supplemental Fig. S3), and using volumetric MRI, we identified early and widespread volume loss in several brain regions affected in the juvenile form of HD (Fig. 5). We also detected astrogliosis and microgliosis by immunohistochemistry (Fig. 6) as well as TSPO up-regulation with autoradiography in most of the analyzed brain regions (Fig. 7A), often prior to detection of regional brain volume loss by MRI (Fig. 5). This suggests that gliosis and neuroinflammation, may precede loss of brain volume in HD pathobiology. Importantly, the TSPO data are consistent with human studies in which patients show elevated TSPO levels not only at symptomatic [68, 69], but also at presymptomatic stages of HD [70]. Importantly, the extent of TSPO activation in HD patient striatum was similar to the values found in BAC-225Q mice (increases of 30–85% versus 25–60%, respectively). Therefore, TSPO up-regulation appears to be an early and sensitive marker of regional brain impairment in HD. This relationship is also confirmed by our findings in the YAC128 model, where increased TSPO levels were found in striatum at 10 months (Fig. 7B), which is proximate to the age when striatal loss is first observed in this model [30]. Additionally, our TSPO analysis in YAC128 mice confirmed that this model has a later, milder and less widespread neurodegenerative pathology compared to the BAC-225Q. Summarizing, TSPO up-regulation clearly elucidates a widespread, neurodegenerative-like phenotype in BAC-225Q mice.
To summarize, we have characterized a novel mouse model expressing mouse Htt with ~225 CAG repeats. This model reveals an early phenotype including body weight deficiency, motor behavioral abnormalities, widespread Htt aggregation especially in hippocampus and associated cortex, brain atrophy and gliosis, as well as striatal pathology in both direct, and indirect pathway MSNs. Additionally, neurological symptoms in these animals are accompanied by changes in specific blood biomarkers of HD. These features of the BAC-225Q model suggest it may have utility for studies on the juvenile form or possibly late-stages of adult-onset HD, as well as the metabolic disturbances, regional vulnerability to mutant Htt pathology, and early striatal dysfunction prior to neurodegeneration. Consistent with its large CAG-repeat length, this model shows an earlier age-of-onset relative to previously published full-length Htt mouse models. Despite this early onset and continued expression of the mutant Htt transgene, the BAC-225Q model shows a predominantly non-progressive phenotype, which may provide a stable early time point for the study of wide-spread HD-associated neuropathology relative to existing full-length Htt models with much later ages-of-onset.
Supplementary Material
Acknowledgments
This work was supported by National Institutes of Health grant RO1ES016931 to ABB; and RO1ES007062 to TRG. TJB was supported by the Training Program in Environmental Toxicology T32ES007028, JMC was supported by T32MH015330, BDS and MKL are supported by T32ES007322. Additional support by the Vanderbilt Kennedy Center, NIH/NICHD P30HD15052. Behavioral experiments were performed through the use of the Murine Neurobehavior Core lab at the Vanderbilt University Medical Center. We thank Dr. John Allison for the training on using rotarod apparatus and activity chambers and for help with behavioral data collection. Leptin and cytokine assays were performed in Vanderbilt Hormone Assay and Analytical Service Core.
Footnotes
CONFLICT OF INTEREST
The authors have no conflict of interest to report.
References
- 1.Walker FO. Huntington's Disease. Seminars in neurology. 2007;27(2):143–50. doi: 10.1055/s-2007-971176. [DOI] [PubMed] [Google Scholar]
- 2.MacDonald ME, Ambrose CM, Duyao MP, Myers RH, Lin C, Srinidhi L, Barnes G, Taylor SA, James M, Groot M, MacFarlane H, Jenkins B. A novel gene containing a trinucleotide repeat that is expanded and unstable on Huntington's disease chromosomes. The Huntington's Disease Collaborative Research Group. Cell. 1993;72(6):971–83. doi: 10.1016/0092-8674(93)90585-e. [DOI] [PubMed] [Google Scholar]
- 3.Douaud G, Gaura V, Ribeiro MJ, Lethimonnier F, Maroy R, Verny C, Krystkowiak P, Damier P, Bachoud-Levi AC, Hantraye P, Remy P. Distribution of grey matter atrophy in Huntington's disease patients: a combined ROI-based and voxel-based morphometric study. Neuroimage. 2006;32(4):1562–75. doi: 10.1016/j.neuroimage.2006.05.057. [DOI] [PubMed] [Google Scholar]
- 4.Boutell JM, Thomas P, Neal JW, Weston VJ, Duce J, Harper PS, Jones AL. Aberrant interactions of transcriptional repressor proteins with the Huntington's disease gene product, huntingtin. Hum Mol Genet. 1999;8(9):1647–55. doi: 10.1093/hmg/8.9.1647. [DOI] [PubMed] [Google Scholar]
- 5.Sassone J, Colciago C, Cislaghi G, Silani V, Ciammola A. Huntington's disease: the current state of research with peripheral tissues. Exp Neurol. 2009;219(2):385–97. doi: 10.1016/j.expneurol.2009.05.012. [DOI] [PubMed] [Google Scholar]
- 6.Squitieri F, Frati L, Ciarmiello A, Lastoria S, Quarrell O. Juvenile Huntington's disease: does a dosage-effect pathogenic mechanism differ from the classical adult disease? Mech Ageing Dev. 2006;127(2):208–12. doi: 10.1016/j.mad.2005.09.012. [DOI] [PubMed] [Google Scholar]
- 7.Andresen JM, Gayan J, Djousse L, Roberts S, Brocklebank D, Cherny SS, Cardon LR, Gusella JF, MacDonald ME, Myers RH, Housman DE, Wexler NS. The relationship between CAG repeat length and age of onset differs for Huntington's disease patients with juvenile onset or adult onset. Ann Hum Genet. 2007;71(Pt 3):295–301. doi: 10.1111/j.1469-1809.2006.00335.x. [DOI] [PubMed] [Google Scholar]
- 8.Ramaswamy S, McBride JL, Kordower JH. Animal models of Huntington's disease. ILAR J. 2007;48(4):356–73. doi: 10.1093/ilar.48.4.356. [DOI] [PubMed] [Google Scholar]
- 9.Crook ZR, Housman D. Huntington's disease: can mice lead the way to treatment? Neuron. 2011;69(3):423–35. doi: 10.1016/j.neuron.2010.12.035. [DOI] [PMC free article] [PubMed] [Google Scholar]
- 10.Warming S, Costantino N, Court DL, Jenkins NA, Copeland NG. Simple and highly efficient BAC recombineering using galK selection. Nucleic Acids Res. 2005;33(4):e36. doi: 10.1093/nar/gni035. [DOI] [PMC free article] [PubMed] [Google Scholar]
- 11.Yoo SY, Pennesi ME, Weeber EJ, Xu BS, Atkinson R, Chen SM, Armstrong DL, Wu SM, Sweatt JD, Zoghbi HY. SCA7 knockin mice model human SCA7 and reveal gradual accumulation of mutant ataxin-7 in neurons and abnormalities in short-term plasticity. Neuron. 2003;37(3):383–401. doi: 10.1016/s0896-6273(02)01190-x. [DOI] [PubMed] [Google Scholar]
- 12.Wegrzynowicz M, Holt HK, Friedman DB, Bowman AB. Changes in the striatal proteome of YAC128Q mice exhibit gene-environment interactions between mutant huntingtin and manganese. Journal of proteome research. 2012;11(2):1118–32. doi: 10.1021/pr200839d. [DOI] [PMC free article] [PubMed] [Google Scholar]
- 13.Kreutz C, Bartolome Rodriguez MM, Maiwald T, Seidl M, Blum HE, Mohr L, Timmer J. An error model for protein quantification. Bioinformatics. 2007;23(20):2747–53. doi: 10.1093/bioinformatics/btm397. [DOI] [PubMed] [Google Scholar]
- 14.Golde WT, Gollobin P, Rodriguez LL. A rapid, simple, and humane method for submandibular bleeding of mice using a lancet. Lab Anim (NY) 2005;34(9):39–43. doi: 10.1038/laban1005-39. [DOI] [PubMed] [Google Scholar]
- 15.Gu X, Greiner ER, Mishra R, Kodali R, Osmand A, Finkbeiner S, Steffan JS, Thompson LM, Wetzel R, Yang XW. Serines 13 and 16 are critical determinants of full-length human mutant huntingtin induced disease pathogenesis in HD mice. Neuron. 2009;64(6):828–40. doi: 10.1016/j.neuron.2009.11.020. [DOI] [PMC free article] [PubMed] [Google Scholar]
- 16.Aggarwal M, Zhang J, Miller MI, Sidman RL, Mori S. Magnetic resonance imaging and micro-computed tomography combined atlas of developing and adult mouse brains for stereotaxic surgery. Neuroscience. 2009;162(4):1339–50. doi: 10.1016/j.neuroscience.2009.05.070. [DOI] [PMC free article] [PubMed] [Google Scholar]
- 17.Miller MI, Trouve A, Younes L. On the metrics and euler-lagrange equations of computational anatomy. Annu Rev Biomed Eng. 2002;4:375–405. doi: 10.1146/annurev.bioeng.4.092101.125733. [DOI] [PubMed] [Google Scholar]
- 18.van der Burg JM, Bjorkqvist M, Brundin P. Beyond the brain: widespread pathology in Huntington's disease. Lancet Neurol. 2009;8(8):765–74. doi: 10.1016/S1474-4422(09)70178-4. [DOI] [PubMed] [Google Scholar]
- 19.McFadyen MP, Kusek G, Bolivar VJ, Flaherty L. Differences among eight inbred strains of mice in motor ability and motor learning on a rotorod. Genes, brain, and behavior. 2003;2(4):214–9. doi: 10.1034/j.1601-183x.2003.00028.x. [DOI] [PubMed] [Google Scholar]
- 20.Gafni J, Papanikolaou T, Degiacomo F, Holcomb J, Chen S, Menalled L, Kudwa A, Fitzpatrick J, Miller S, Ramboz S, Tuunanen PI, Lehtimaki KK, Yang XW, Park L, Kwak S, Howland D, Park H, Ellerby LM. Caspase-6 activity in a BACHD mouse modulates steady-state levels of mutant huntingtin protein but is not necessary for production of a 586 amino acid proteolytic fragment. The Journal of neuroscience : the official journal of the Society for Neuroscience. 2012;32(22):7454–65. doi: 10.1523/JNEUROSCI.6379-11.2012. [DOI] [PMC free article] [PubMed] [Google Scholar]
- 21.Mochel F, Charles P, Seguin F, Barritault J, Coussieu C, Perin L, Le Bouc Y, Gervais C, Carcelain G, Vassault A, Feingold J, Rabier D, Durr A. Early energy deficit in Huntington disease: identification of a plasma biomarker traceable during disease progression. PLoS One. 2007;2(7):e647. doi: 10.1371/journal.pone.0000647. [DOI] [PMC free article] [PubMed] [Google Scholar]
- 22.Bjorkqvist M, Wild EJ, Thiele J, Silvestroni A, Andre R, Lahiri N, Raibon E, Lee RV, Benn CL, Soulet D, Magnusson A, Woodman B, Landles C, Pouladi MA, Hayden MR, Khalili-Shirazi A, Lowdell MW, Brundin P, Bates GP, Leavitt BR, Moller T, Tabrizi SJ. A novel pathogenic pathway of immune activation detectable before clinical onset in Huntington's disease. J Exp Med. 2008;205(8):1869–77. doi: 10.1084/jem.20080178. [DOI] [PMC free article] [PubMed] [Google Scholar]
- 23.Popovic V, Svetel M, Djurovic M, Petrovic S, Doknic M, Pekic S, Miljic D, Milic N, Glodic J, Dieguez C, Casanueva FF, Kostic V. Circulating and cerebrospinal fluid ghrelin and leptin: potential role in altered body weight in Huntington's disease. Eur J Endocrinol. 2004;151(4):451–5. doi: 10.1530/eje.0.1510451. [DOI] [PubMed] [Google Scholar]
- 24.Bozic CR, Gerard NP, von Uexkull-Guldenband C, Kolakowski LF, Jr, Conklyn MJ, Breslow R, Showell HJ, Gerard C. The murine interleukin 8 type B receptor homologue and its ligands. Expression and biological characterization. J Biol Chem. 1994;269(47):29355–8. [PubMed] [Google Scholar]
- 25.Henry BA, Clarke IJ. Adipose tissue hormones and the regulation of food intake. J Neuroendocrinol. 2008;20(6):842–9. doi: 10.1111/j.1365-2826.2008.1730.x. [DOI] [PubMed] [Google Scholar]
- 26.Vonsattel JP, Myers RH, Stevens TJ, Ferrante RJ, Bird ED, Richardson EP., Jr Neuropathological classification of Huntington's disease. J Neuropathol Exp Neurol. 1985;44(6):559–77. doi: 10.1097/00005072-198511000-00003. [DOI] [PubMed] [Google Scholar]
- 27.Hedreen JC, Peyser CE, Folstein SE, Ross CA. Neuronal loss in layers V and VI of cerebral cortex in Huntington's disease. Neurosci Lett. 1991;133(2):257–61. doi: 10.1016/0304-3940(91)90583-f. [DOI] [PubMed] [Google Scholar]
- 28.Nopoulos PC, Aylward EH, Ross CA, Johnson HJ, Magnotta VA, Juhl AR, Pierson RK, Mills J, Langbehn DR, Paulsen JS. Cerebral cortex structure in prodromal Huntington disease. Neurobiol Dis. 2010;40(3):544–54. doi: 10.1016/j.nbd.2010.07.014. [DOI] [PMC free article] [PubMed] [Google Scholar]
- 29.Chen MK, Guilarte TR. Translocator protein 18 kDa (TSPO): molecular sensor of brain injury and repair. Pharmacol Ther. 2008;118(1):1–17. doi: 10.1016/j.pharmthera.2007.12.004. [DOI] [PMC free article] [PubMed] [Google Scholar]
- 30.Slow EJ, van Raamsdonk J, Rogers D, Coleman SH, Graham RK, Deng Y, Oh R, Bissada N, Hossain SM, Yang YZ, Li XJ, Simpson EM, Gutekunst CA, Leavitt BR, Hayden MR. Selective striatal neuronal loss in a YAC128 mouse model of Huntington disease. Hum Mol Genet. 2003;12(13):1555–67. doi: 10.1093/hmg/ddg169. [DOI] [PubMed] [Google Scholar]
- 31.Vonsattel JP, Keller C, Cortes Ramirez EP. Huntington's disease - neuropathology. Handb Clin Neurol. 2011;100:83–100. doi: 10.1016/B978-0-444-52014-2.00004-5. [DOI] [PubMed] [Google Scholar]
- 32.Mangiarini L, Sathasivam K, Seller M, Cozens B, Harper A, Hetherington C, Lawton M, Trottier Y, Lehrach H, Davies SW, Bates GP. Exon 1 of the HD gene with an expanded CAG repeat is sufficient to cause a progressive neurological phenotype in transgenic mice. Cell. 1996;87(3):493–506. doi: 10.1016/s0092-8674(00)81369-0. [DOI] [PubMed] [Google Scholar]
- 33.Hodgson JG, Agopyan N, Gutekunst CA, Leavitt BR, LePiane F, Singaraja R, Smith DJ, Bissada N, McCutcheon K, Nasir J, Jamot L, Li XJ, Stevens ME, Rosemond E, Roder JC, Phillips AG, Rubin EM, Hersch SM, Hayden MR. A YAC mouse model for Huntington's disease with full-length mutant huntingtin, cytoplasmic toxicity, and selective striatal neurodegeneration. Neuron. 1999;23(1):181–92. doi: 10.1016/s0896-6273(00)80764-3. [DOI] [PubMed] [Google Scholar]
- 34.Gray M, Shirasaki DI, Cepeda C, Andre VM, Wilburn B, Lu XH, Tao J, Yamazaki I, Li SH, Sun YE, Li XJ, Levine MS, Yang XW. Full-length human mutant huntingtin with a stable polyglutamine repeat can elicit progressive and selective neuropathogenesis in BACHD mice. The Journal of neuroscience : the official journal of the Society for Neuroscience. 2008;28(24):6182–95. doi: 10.1523/JNEUROSCI.0857-08.2008. [DOI] [PMC free article] [PubMed] [Google Scholar]
- 35.Schilling G, Becher MW, Sharp AH, Jinnah HA, Duan K, Kotzuk JA, Slunt HH, Ratovitski T, Cooper JK, Jenkins NA, Copeland NG, Price DL, Ross CA, Borchelt DR. Intranuclear inclusions and neuritic aggregates in transgenic mice expressing a mutant N-terminal fragment of huntingtin. Hum Mol Genet. 1999;8(3):397–407. doi: 10.1093/hmg/8.3.397. [DOI] [PubMed] [Google Scholar]
- 36.Wheeler VC, Auerbach W, White JK, Srinidhi J, Auerbach A, Ryan A, Duyao MP, Vrbanac V, Weaver M, Gusella JF, Joyner AL, MacDonald ME. Length-dependent gametic CAG repeat instability in the Huntington's disease knock-in mouse. Hum Mol Genet. 1999;8(1):115–22. doi: 10.1093/hmg/8.1.115. [DOI] [PubMed] [Google Scholar]
- 37.Shelbourne PF, Killeen N, Hevner RF, Johnston HM, Tecott L, Lewandoski M, Ennis M, Ramirez L, Li Z, Iannicola C, Littman DR, Myers RM. A Huntington's disease CAG expansion at the murine Hdh locus is unstable and associated with behavioural abnormalities in mice. Hum Mol Genet. 1999;8(5):763–74. doi: 10.1093/hmg/8.5.763. [DOI] [PubMed] [Google Scholar]
- 38.Yu ZX, Li SH, Evans J, Pillarisetti A, Li H, Li XJ. Mutant huntingtin causes context-dependent neurodegeneration in mice with Huntington's disease. The Journal of neuroscience : the official journal of the Society for Neuroscience. 2003;23(6):2193–202. doi: 10.1523/JNEUROSCI.23-06-02193.2003. [DOI] [PMC free article] [PubMed] [Google Scholar]
- 39.Heng MY, Duong DK, Albin RL, Tallaksen-Greene SJ, Hunter JM, Lesort MJ, Osmand A, Paulson HL, Detloff PJ. Early autophagic response in a novel knock-in model of Huntington disease. Hum Mol Genet. 2010;19(19):3702–20. doi: 10.1093/hmg/ddq285. [DOI] [PMC free article] [PubMed] [Google Scholar]
- 40.Roos RA. Huntington's disease: a clinical review. Orphanet J Rare Dis. 2010;5(1):40. doi: 10.1186/1750-1172-5-40. [DOI] [PMC free article] [PubMed] [Google Scholar]
- 41.Albin RL, Reiner A, Anderson KD, Penney JB, Young AB. Striatal and nigral neuron subpopulations in rigid Huntington's disease: implications for the functional anatomy of chorea and rigidity-akinesia. Ann Neurol. 1990;27(4):357–65. doi: 10.1002/ana.410270403. [DOI] [PubMed] [Google Scholar]
- 42.Andrews TC, Weeks RA, Turjanski N, Gunn RN, Watkins LH, Sahakian B, Hodges JR, Rosser AE, Wood NW, Brooks DJ. Huntington's disease progression. PET and clinical observations. Brain. 1999;122( Pt 12):2353–63. doi: 10.1093/brain/122.12.2353. [DOI] [PubMed] [Google Scholar]
- 43.Lawrence AD, Weeks RA, Brooks DJ, Andrews TC, Watkins LH, Harding AE, Robbins TW, Sahakian BJ. The relationship between striatal dopamine receptor binding and cognitive performance in Huntington's disease. Brain. 1998;121( Pt 7):1343–55. doi: 10.1093/brain/121.7.1343. [DOI] [PubMed] [Google Scholar]
- 44.Weeks RA, Piccini P, Harding AE, Brooks DJ. Striatal D1 and D2 dopamine receptor loss in asymptomatic mutation carriers of Huntington's disease. Ann Neurol. 1996;40(1):49–54. doi: 10.1002/ana.410400110. [DOI] [PubMed] [Google Scholar]
- 45.Louis ED, Anderson KE, Moskowitz C, Thorne DZ, Marder K. Dystonia-predominant adult-onset Huntington disease: association between motor phenotype and age of onset in adults. Arch Neurol. 2000;57(9):1326–30. doi: 10.1001/archneur.57.9.1326. [DOI] [PubMed] [Google Scholar]
- 46.Gonzalez-Alegre P, Afifi AK. Clinical characteristics of childhood-onset (juvenile) Huntington disease: report of 12 patients and review of the literature. J Child Neurol. 2006;21(3):223–9. doi: 10.2310/7010.2006.00055. [DOI] [PubMed] [Google Scholar]
- 47.Walker FO. Huntington's disease. Lancet. 2007;369(9557):218–28. doi: 10.1016/S0140-6736(07)60111-1. [DOI] [PubMed] [Google Scholar]
- 48.Kuemmerle S, Gutekunst CA, Klein AM, Li XJ, Li SH, Beal MF, Hersch SM, Ferrante RJ. Huntington aggregates may not predict neuronal death in Huntington's disease. Ann Neurol. 1999;46(6):842–9. [PubMed] [Google Scholar]
- 49.Romero E, Cha GH, Verstreken P, Ly CV, Hughes RE, Bellen HJ, Botas J. Suppression of neurodegeneration and increased neurotransmission caused by expanded full-length huntingtin accumulating in the cytoplasm. Neuron. 2008;57(1):27–40. doi: 10.1016/j.neuron.2007.11.025. [DOI] [PMC free article] [PubMed] [Google Scholar]
- 50.Cummings DM, Alaghband Y, Hickey MA, Joshi PR, Hong SC, Zhu C, Ando TK, Andre VM, Cepeda C, Watson JB, Levine MS. A critical window of CAG repeat-length correlates with phenotype severity in the R6/2 mouse model of Huntington's disease. Journal of neurophysiology. 2012;107(2):677–91. doi: 10.1152/jn.00762.2011. [DOI] [PMC free article] [PubMed] [Google Scholar]
- 51.Sanberg PR, Fibiger HC, Mark RF. Body weight and dietary factors in Huntington's disease patients compared with matched controls. Med J Aust. 1981;1(8):407–9. doi: 10.5694/j.1326-5377.1981.tb135681.x. [DOI] [PubMed] [Google Scholar]
- 52.Stoy N, McKay E. Weight loss in Huntington's disease. Ann Neurol. 2000;48(1):130–1. [PubMed] [Google Scholar]
- 53.Pouladi MA, Xie Y, Skotte NH, Ehrnhoefer DE, Graham RK, Kim JE, Bissada N, Yang XW, Paganetti P, Friedlander RM, Leavitt BR, Hayden MR. Full-length huntingtin levels modulate body weight by influencing insulin-like growth factor 1 expression. Hum Mol Genet. 2010;19(8):1528–38. doi: 10.1093/hmg/ddq026. [DOI] [PMC free article] [PubMed] [Google Scholar]
- 54.Van Raamsdonk JM, Gibson WT, Pearson J, Murphy Z, Lu G, Leavitt BR, Hayden MR. Body weight is modulated by levels of full-length huntingtin. Hum Mol Genet. 2006;15(9):1513–23. doi: 10.1093/hmg/ddl072. [DOI] [PubMed] [Google Scholar]
- 55.Pouladi MA, Stanek LM, Xie Y, Franciosi S, Southwell AL, Deng Y, Butland S, Zhang W, Cheng SH, Shihabuddin LS, Hayden MR. Marked differences in neurochemistry and aggregates despite similar behavioural and neuropathological features of Huntington disease in the full-length BACHD and YAC128 mice. Hum Mol Genet. 2012;21(10):2219–32. doi: 10.1093/hmg/dds037. [DOI] [PubMed] [Google Scholar]
- 56.Menalled LB, Kudwa AE, Miller S, Fitzpatrick J, Watson-Johnson J, Keating N, Ruiz M, Mushlin R, Alosio W, McConnell K, Connor D, Murphy C, Oakeshott S, Kwan M, Beltran J, Ghavami A, Brunner D, Park LC, Ramboz S, Howland D. Comprehensive behavioral and molecular characterization of a new knock-in mouse model of Huntington's disease: zQ175. PLoS One. 2012;7(12):e49838. doi: 10.1371/journal.pone.0049838. [DOI] [PMC free article] [PubMed] [Google Scholar]
- 57.Van Raamsdonk JM, Metzler M, Slow E, Pearson J, Schwab C, Carroll J, Graham RK, Leavitt BR, Hayden MR. Phenotypic abnormalities in the YAC128 mouse model of Huntington disease are penetrant on multiple genetic backgrounds and modulated by strain. Neurobiol Dis. 2007;26(1):189–200. doi: 10.1016/j.nbd.2006.12.010. [DOI] [PubMed] [Google Scholar]
- 58.Li MD. Leptin and beyond: an odyssey to the central control of body weight. Yale J Biol Med. 2011;84(1):1–7. [PMC free article] [PubMed] [Google Scholar]
- 59.Klok MD, Jakobsdottir S, Drent ML. The role of leptin and ghrelin in the regulation of food intake and body weight in humans: a review. Obesity reviews : an official journal of the International Association for the Study of Obesity. 2007;8(1):21–34. doi: 10.1111/j.1467-789X.2006.00270.x. [DOI] [PubMed] [Google Scholar]
- 60.Aziz NA, Pijl H, Frolich M, van der Graaf AW, Roelfsema F, Roos RA. Leptin secretion rate increases with higher CAG repeat number in Huntington's disease patients. Clin Endocrinol (Oxf) 2010;73(2):206–11. doi: 10.1111/j.1365-2265.2009.03661.x. [DOI] [PubMed] [Google Scholar]
- 61.Gabery S, Murphy K, Schultz K, Loy CT, McCusker E, Kirik D, Halliday G, Petersen A. Changes in key hypothalamic neuropeptide populations in Huntington disease revealed by neuropathological analyses. Acta Neuropathol. 2010;120(6):777–88. doi: 10.1007/s00401-010-0742-6. [DOI] [PubMed] [Google Scholar]
- 62.Petersen A, Gil J, Maat-Schieman ML, Bjorkqvist M, Tanila H, Araujo IM, Smith R, Popovic N, Wierup N, Norlen P, Li JY, Roos RA, Sundler F, Mulder H, Brundin P. Orexin loss in Huntington's disease. Hum Mol Genet. 2005;14(1):39–47. doi: 10.1093/hmg/ddi004. [DOI] [PubMed] [Google Scholar]
- 63.Politis M, Pavese N, Tai YF, Tabrizi SJ, Barker RA, Piccini P. Hypothalamic involvement in Huntington's disease: an in vivo PET study. Brain. 2008;131(Pt 11):2860–9. doi: 10.1093/brain/awn244. [DOI] [PubMed] [Google Scholar]
- 64.Sipione S, Cattaneo E. Modeling Huntington's disease in cells, flies, and mice. Mol Neurobiol. 2001;23(1):21–51. doi: 10.1385/MN:23:1:21. [DOI] [PubMed] [Google Scholar]
- 65.Di Paola M, Luders E, Cherubini A, Sanchez-Castaneda C, Thompson PM, Toga AW, Caltagirone C, Orobello S, Elifani F, Squitieri F, Sabatini U. Multimodal MRI Analysis of the Corpus Callosum Reveals White Matter Differences in Presymptomatic and Early Huntington's Disease. Cereb Cortex. 2012 doi: 10.1093/cercor/bhr360. [DOI] [PubMed] [Google Scholar]
- 66.Paulsen JS, Nopoulos PC, Aylward E, Ross CA, Johnson H, Magnotta VA, Juhl A, Pierson RK, Mills J, Langbehn D, Nance M. Striatal and white matter predictors of estimated diagnosis for Huntington disease. Brain Res Bull. 2010;82(3–4):201–7. doi: 10.1016/j.brainresbull.2010.04.003. [DOI] [PMC free article] [PubMed] [Google Scholar]
- 67.Rosas HD, Koroshetz WJ, Chen YI, Skeuse C, Vangel M, Cudkowicz ME, Caplan K, Marek K, Seidman LJ, Makris N, Jenkins BG, Goldstein JM. Evidence for more widespread cerebral pathology in early HD: an MRI-based morphometric analysis. Neurology. 2003;60(10):1615–20. doi: 10.1212/01.wnl.0000065888.88988.6e. [DOI] [PubMed] [Google Scholar]
- 68.Messmer K, Reynolds GP. Increased peripheral benzodiazepine binding sites in the brain of patients with Huntington's disease. Neurosci Lett. 1998;241(1):53–6. doi: 10.1016/s0304-3940(97)00967-1. [DOI] [PubMed] [Google Scholar]
- 69.Pavese N, Gerhard A, Tai YF, Ho AK, Turkheimer F, Barker RA, Brooks DJ, Piccini P. Microglial activation correlates with severity in Huntington disease: a clinical and PET study. Neurology. 2006;66(11):1638–43. doi: 10.1212/01.wnl.0000222734.56412.17. [DOI] [PubMed] [Google Scholar]
- 70.Tai YF, Pavese N, Gerhard A, Tabrizi SJ, Barker RA, Brooks DJ, Piccini P. Microglial activation in presymptomatic Huntington's disease gene carriers. Brain. 2007;130(Pt 7):1759–66. doi: 10.1093/brain/awm044. [DOI] [PubMed] [Google Scholar]
Associated Data
This section collects any data citations, data availability statements, or supplementary materials included in this article.