Abstract
Purpose
To evaluate the quantitative and topographic relationship between reticular pseudodrusen (RPD) on infrared reflectance (IR) and subretinal drusenoid deposits (SDD) on en face volumetric spectral-domain optical coherence tomography (SD-OCT).
Methods
RPD were marked on IR images by a masked observer. SDD were visualized on en-face sections of SD-OCT below the external limiting membrane and identified by a semi-automated technique. Control RPD lesions were generated in a random distribution for each IR image. Binary maps of control and experimental RPD and SDD were merged and analyzed in terms of topographic localization and quantitative drusen load comparison.
Results
A total of 54 eyes of 41 patients diagnosed with RPD were included in this study. The average number of RPD lesions on IR images was 320±44.62 compared to 127±26.02 SDD lesions on en-face (P<0.001). The majority of RPD lesions did not overlap with SDD lesions, and were located greater than 30 microns away (92%). The percentage of total SDD lesions overlapping RPD was 2.91±0.87% compared to 1.73±0.68% overlapping control RPD lesions (P<0.05). The percentage of total SDD lesions between 1-3 pixels of the nearest RPD lesion was 5.08±1.40% compared to 3.33±1.07% between 1-3 pixels of the nearest control RPD lesion (P<0.05).
Conclusions
This study identified significantly more RPD lesions on IR compared with SDD lesions on en-face SD-OCT and found that a large majority of SDD (>90% of lesions) were greater than 30 microns away from the nearest RPD. Together, our findings indicate that RPD and SDD are two entities that are only occasionally topographically associated, suggesting that at some stage in their development, they may be pathologically related.
Keywords: age-related macular degeneration, en face optical coherence tomography, infrared reflectance, reticular pseudodrusen, subretinal drusenoid deposits
Introduction
Age-related macular degeneration (AMD) is the leading cause of blindness among the elderly in developed countries, with 1.75 million people affected in the United States alone.1 Significant visual impairment results from late stage AMD compared to early stage AMD, which has little impact on vision-related function.2 Given the high prevalence and potential morbidity of AMD, the identification and characterization of risk factors for progression to late stage AMD is warranted.
One risk factor that has garnered recent attention is reticular pseudodrusen (RPD), a distinctive phenotypic characteristic observed in patients with AMD. RPD was first described in 1990 as having a peculiar yellowish pattern more visible under blue light.3 While multiple imaging modalities have subsequently been used to detect RPD, infrared reflectance (IR) has proven to be the most sensitive for its visualization.4 The increased recognition of RPD has lead to better understanding of its clinical implications, most notably the association with an increased incidence of progression to late stage AMD.5-12
Another finding associated with AMD are subretinal drusenoid deposits (SDD), aggregations of membranous material in the sub-retinal space. In 1988, Sarks et al. first described membranous debris in multiple locations including within the subretinal space.13 The composition of this sub-retinal debris has been shown to include highly enriched unesterified cholesterol particles.14 These particles are morphologically similar to drusen on histopathology, but differ in that they contain little esterified cholesterol thereby designating these subretinal deposits as drusenoid.14, 15 While initial studies identified SDD using histopathology and low magnification transmission electron microscopy, subsequent research has correlated these lesions with findings on spectral domain optical coherence tomography (SD-OCT).
The association between SDD and RPD has been a topic of recent debate. A study reevaluating three eyes initially used to assess the composition of SDD found evidence to suggest SDD is the histologic manifestation of RPD even though these eyes were not verified with clinical RPD at autopsy.16 Other studies have found evidence that SDD are adjacent rather than overlying RPD, suggesting an association without being the same entity.17, 18 Adding to the controversy, a recent study showed histologic evidence of SDD in eyes without RPD clinically.19
In the present study, our goal was to analyze the quantitative and topographic relationship between RPD and SDD in order to examine the association between these two findings.
Methods
Study Design
The study was designed to evaluate the quantitative and topographic relationship between RPD and SDD. RPD were marked on IR images by a masked observer (JKF) with a second observer (AAF) marking a subset of images to assess accuracy. SDD were marked on OCT C-scans by a semi-automated process described below.
Study Sample
We retrospectively identified patients diagnosed with RPD between March 2012 to March 2014 at the Department of Ophthalmology of the Northwestern University Feinberg School of Medicine. IRB protocols were approved by the Scientific Review Committee of Northwestern University. This research followed the tenets of the Declaration of Helsinki and informed consent was waived for this retrospective study. Inclusion criteria included patients with a diagnosis of RPD and a complete ophthalmological examination, including infrared reflectance (IR), fundus autofluorescence (FAF) imaging, and SD OCT (Cirrus high-definition OCT; HD-OCT, Carl Zeiss Meditec Inc, Dublin, CA USA) and the Spectralis HRA+OCT (Heidelberg Engineering Inc, Dossenheim, Germany). Exclusion criteria included fewer than 50 RPD, the RPE being too irregular on OCT for the Cirrus software to trace, or the IR images or OCT scans being of poor quality. Poor quality was defined qualitatively by the inability to accurately identify SDD and RPD on IR and OCT images and quantitatively by the Cirrus OCT image quality score below 6.
The diagnosis of RPD was based on previously defined criteria.4 RPD were identified on IR reflectance images in concordance with previous reports demonstrating superior sensitivity of IR compared to FAF and red-free images in detecting RPD.17 We used the following criteria to define RPD on IR reflectance imaging: distinct hyporeflective lesions on a background of mild hyper-reflectance, and/or regular reticular patterns within well-defined domains.
Image Acquisition
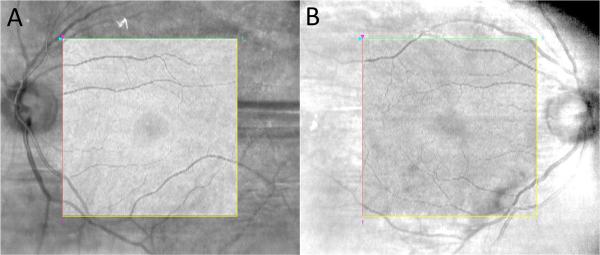
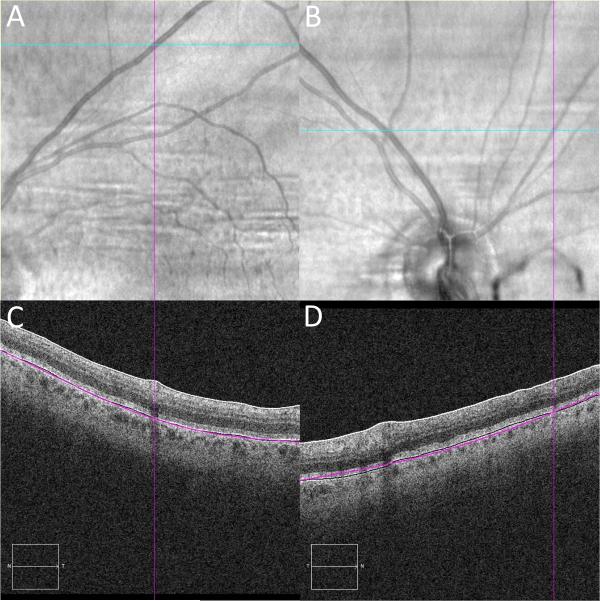
Images were acquired on the Cirrus HD-OCT 5000 device (Carl Zeiss Meditec, Dublin, CA), using a super-luminescent diode at 840 nm, which achieves a 5 μm axial and a 15 μm transverse tissue resolution. The device captures 27,000 A-scans per second at 2 mm of depth. The images were viewed with the Cirrus HD-OCT software (version 6.5.0.772 Carl Zeiss Meditec Inc.). Imaging was performed with a 512×128 macular cube volume scan consisting of 128 equally spaced horizontal B-scans (each composed of 512 A-scans) over a 6-mm square grid. In the 512×128 scan protocol, the pixel separation in the horizontal direction is 6000/512 or 11.7 μm, while the pixel separation in the vertical direction is 6000/128 or 46.9 μm. The pixel spacing in the axial direction for both cubes is 2000/1024 or approximately 2 μm, while the axial resolution is approximately 5 μm. The line scanning laser ophthalmoscope (SLO) feature obtained a registered IR fundus image for each data cube. No image manipulation was performed to ensure alignment of IR and en face images (Figure 1). All scans were evaluated for alignment error and verified by retinal vessel comparison (Figure 2). Only volume scans free of motion artifact were selected for this study, as determined by assessment of the OCT volume projection to ensure complete lack of vessel alignment artifacts and/or horizontal lines across the volume, which also indicate motion.
Figure 1.
Examples of OCT volume projection overlaid onto IR-SLO image to demonstrate alignment accuracy.
1A/B: two different examples of OCT volume projection within the square demonstrating excellent alignment with IR image outside of square. Images obtained using overlay feature of Cirrus HD-OCT software (Carl Zeiss Meditec, Dublin, CA) with transparency setting of 100%.
Figure 2.
IR and OCT B-scan alignment validation using retinal vessels
2A/B: IR image with the cyan line marking the section of OCT B-scan image and the purple line positioned over the center of the retinal vessel along that section. 2C/D: OCT B-scan image with vertical purple line marking the retinal vessel.
Identification of RPD on IR Images
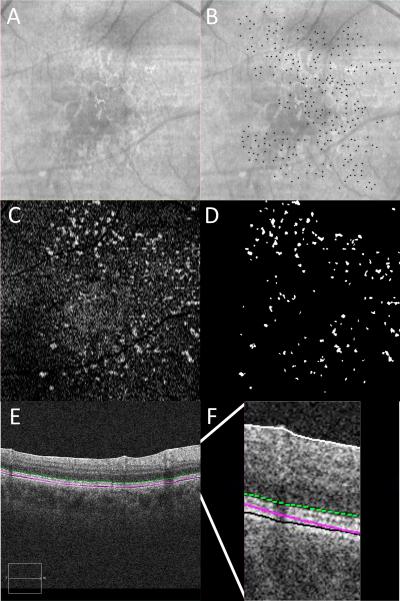
A masked investigator (JKF) used the paintbrush tool on ImageJ software (NIH, Bethesda, MD) to individually mark each RPD lesion visualized on the IR image, using the criteria described above (Figure 3A and B). This investigator was masked to the en face OCT images. Accuracy of lesion identification was studied using 5 randomly selected patients, where another masked reader (AAF) independently identified the RPD lesions and the inter-grader correlation was analyzed.
Figure 3.
RPD marked on IR and SDD marked on OCT with representative en face OCT image.
3A: IR reflectance. 3B: IR reflectance with individual RPD lesions manually marked with black dots. 3C: en face OCT C-scan taken just below the level of the external limiting membrane. 3D: en face OCT with individual SDD lesions semi-automatically identified, thresholded and labeled in white. 3E: OCT B-scan demonstrating the location of en face OCT C-scan in 3C marked with a green dotted line. 3F: magnified view of OCT B-scan in 3E to illustrate the location of the en face OCT C-scan marked with a green dotted line.
Another investigator (MJH) performed the subsequent steps of the analysis. The marked IR image was thresholded until only the RPD lesion markings were visible. The “find maxima” function (output type: single point) was used to identify all of the lesions. The resulting map contained single pixel dots with a thresholded value of 255, each representing the center of an individual RPD lesion. The pixel values were divided by 255 so that each RPD was represented by a single pixel with a value of 1.
A set of control (software-generated) RPD lesions was generated in order to compare the study RPD lesions to a randomly distributed sample. The “add specified noise” function of ImageJ was used to generate a control image with equal number of RPD lesions for each corresponding study IR image. The “find maxima” and “divide” by 255 functions were applied to these control images so that they could be used for the subsequent analysis and compared to the study IR images.
Identification of SDD on En Face OCT Sections
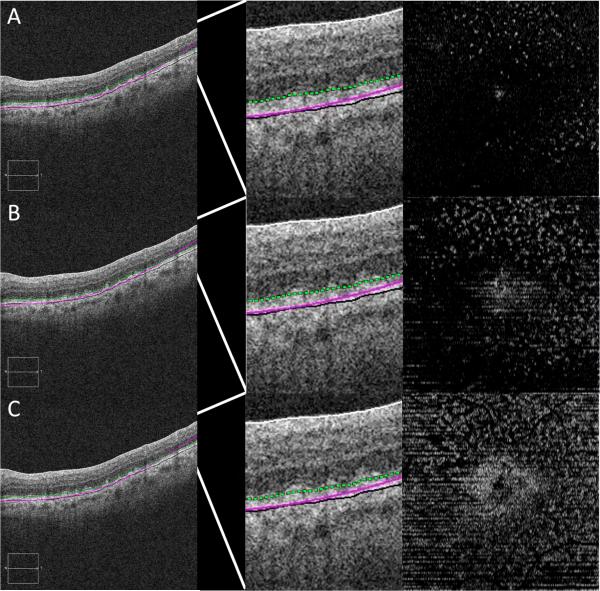
OCT volume scans were reviewed on Cirrus version 6.0 software using the advanced visualization feature. As previously described,17, 20 the RPE feature was used to obtain en face slices, or C-scans, which were contoured based on each patient's RPE curvature. En face slabs, 4 pixels in thickness, were generated above the level of the RPE and just below the external limiting membrane (ELM) (Figure 3E and F). SDD were visualized as white circular spots, which were reviewed for each patient to ensure correspondence with the B-scan. The level of each en face slab was chosen to maximize number of SDD visualized, while avoiding a confluence of the lesions, to allow for precise localization of individual lesions (Figure 4). Using the RPE slice overlay feature, these slabs were registered to the Cirrus IR fundus image with guidance from the SD-OCT scan.
Figure 4.
SDD on OCT B-scan and en face images at varying levels above RPE.
Far left column: OCT B-scans with location of en face OCT (far right) marked with a green dotted line. Middle column: magnified view of OCT B-scan (far left) with slab of en face OCT marked with a green dotted line. 4A: en face level taken too high above RPE resulting in too few SDD. 4B: en face level taken at lower location above RPE resulting in maximum number of well defined SDD. 4C: en face level taken too close to RPE resulting in confluent SDD that can not be precisely localized.
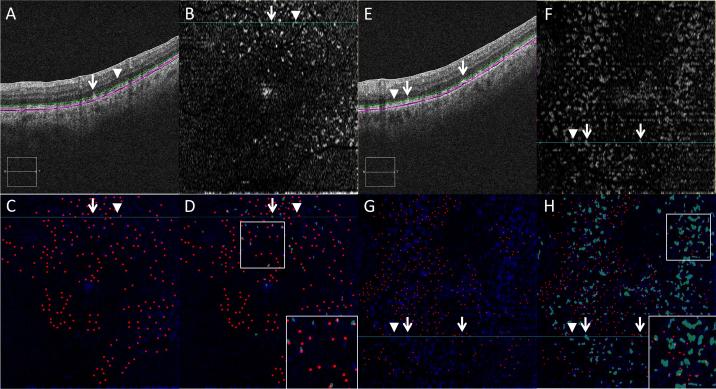
A masked investigator (MJH) performed the subsequent steps of the analysis on NIS-Elements Ar (Nikon Instruments, Inc, Tokyo, Japan), a biologic image analysis software. The IR and C-scan images were overlaid and compared (Figure 5). Areas corresponding to retinal vessels on the C-scan image were removed. All marked RPD lesions that corresponded to these removed areas were excluded from the analysis. A topographic binary map of the SDD was created by applying gaussian noise reduction (median filter set to 5) and thresholding of the en face C-scan, based on minimum size (5 pixel diameter = 150 micron) and pixel value (0 to 255) (Figure 3C and D). The resulting SDD map had a binary set of pixels, which carried a value of either zero (SDD, white) or 255 (background, black).
Figure 5.
SDD thresholding on en face SD-OCT image correlates with SDD on OCT B-scan image.
White arrow: SDD lesion; white arrowhead: no SDD present. 5A/E: OCT B-scan with level of en face OCT C-scan marked with a green dotted line. 5B/F: en face OCT C-scan taken just below the level of the external limiting membrane. 5C/G: composite image; blue channel: en face OCT C-scan taken just below the level of the external limiting membrane; red channel: individual RPD lesions marked with dots; channels merged using ImageJ. 5D/H: composite image; blue channel: en face OCT C-scan taken just below the level of the external limiting membrane; red channel: individual RPD lesions marked with dots; green channel: thresholded SDD lesions on en face OCT C-scan; channels merged using ImageJ.
Image Analysis
The number of control (software-generated) and study RPD overlapping SDD was determined using the “image calculator” function of ImageJ, by multiplying the RPD map (each lesion represented by one pixel with a value of one) and the thresholded SDD binary map (each lesion represented by a group of pixels with values of 255). A histogram of the resulting multiplied image was used to determine the total number of pixels with a value of 255, representing the number of RPD lesions that overlap the SDD lesions.
Further analysis was performed to evaluate the proximity of the non-overlapping RPD to the nearest SDD. The thresholded SDD binary map was inverted. The “distance map” function was applied to the inverted image. The “image calculator” function was used to multiply the resulting distance map with the RPD map. A histogram of the resulting multiplied image was used to determine linear distance from each non-overlapping RPD to the nearest SDD. The proximity of non-overlapping RPD was categorized into two groups: 1-3 pixels and >3 pixels away from the nearest SDD.
Statistical analysis
Statistical analysis was performed using Excel (Microsoft Excel for Mac 2011, Microsoft Corporation, Redmond, WA). One-way independent ANOVA test was used for all experiments and a P-value <0.05 was considered significant. All results were expressed as mean ± standard error of the mean. Inter-observer calculation was performed for JKF and AAF in RPD identification (ICC).
Results
Retrospective review identified sixty-four patients as having RPD on IR imaging between March 2012 to March 2014. Of the 128 eyes, twenty-two had incomplete ophthalmologic exams, and/or were missing either IR or OCT at the time of analysis. Twenty-seven IR images were determined to be of insufficient quality to reliably identify RPD. Fourteen eyes had fewer than fifty RPD lesions and were excluded, as in a previous study.18
Eleven OCT images were excluded because of failure of the Cirrus software RPE feature, leading to artifacts in SDD slab. The remaining 54 eyes of 41 patients had good quality imaging and were included in the current study.
Quantification of RPD and SDD
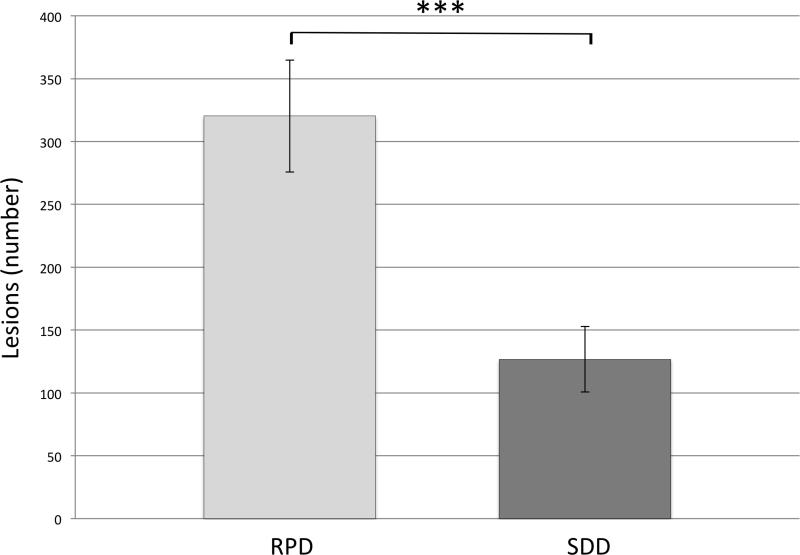
For identification of RPD lesions on IR, there was excellent inter-rater reliability with an intra-class correlation coefficient of 0.96. The average number of RPD lesions in each eye as identified on IR images was 320±44.62. The average number of SDD lesions in each eye identified on C-scan images was 127±26.02. The difference was statistically significant using a one-way independent ANOVA (P<0.001; Figure 6).
Figure 6.
Quantification of RPD and SDD lesions The average number of RPD lesions versus the average number of SDD lesions (320±44.62 vs 127±26.02; ***P<0.001).
Topographic correlation between RPD and SDD
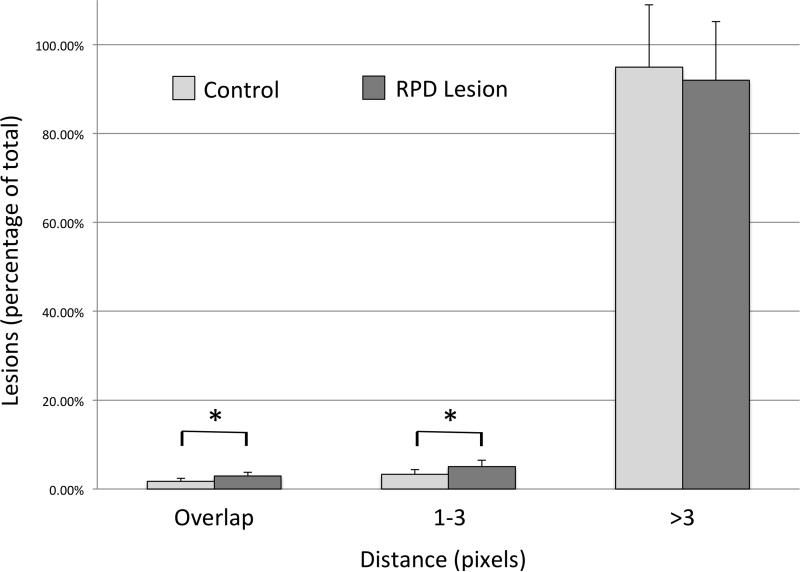
The percentage of total SDD overlapping study RPD in each eye was 2.91±0.87% compared to 1.73±0.68% SDD overlapping control (software-generated) RPD (P<0.05). The SDD not overlapping RPD were categorized based on distance from the nearest RPD into two groups: either one to three pixels or greater than three pixels (30 microns) away from RPD. There were 5.08±1.40% of total SDD that were between one and three pixels from the nearest study RPD compared to 3.33±1.07% control RPD (P<0.05). There were 92.01±13.14% of total SDD that were greater than three pixels from the nearest study RPD, which was not a statistically significant difference from control (software generated) RPD (94.94±14.03%; Figure 7).
Figure 7.
Distribution of SDD in relation to RPD and randomly located control RPD lesions
The percentage of total SDD lesions overlapping RPD versus control RPD lesion (2.91±0.87% vs 1.73±0.68%, *P<0.05). The percentage of total SDD lesions 1-3 pixels from the nearest RPD versus control RPD lesion (5.08±1.40% vs 3.33±1.07%, *P≤0.05). The percentage of total SDD lesions >3 pixels from the nearest RPD versus control RPD lesion (92.01±13.14% vs 94.94±14.03%, p>0.05).
Discussion
In the present study, quantification of IR and en face OCT images revealed significantly fewer RPD lesions compared to SDD lesions. Topographic analysis demonstrated that the majority of SDD were >30 microns (3 pixels) away from the nearest RPD, not different from random (control RPD). The percentage of RPD overlapping SDD (2.9%) was significantly greater compared to control RPD lesions. Overall, these results provide evidence that these two lesions are topographically distinct, but it is possible that, at some stage of their evolution, they could be pathologically interrelated.
The relationship between RPD and SDD was first suggested by Sarks et al. in 1988 who described small round dots between 25 and 50um in size seen in red-free photographs, appearing as hyperfluorescent lesions on fluorescein angiography.13 They speculated that these dots were caused by the rounded mounds of membranous debris that had been characterized in numerous locations in histologic samples. However, this study failed to find histologic correlation of these dots even though the membranous debris had been well characterized.
Zweifel et al. presented qualitative data to suggest the correlation between the lesions, based on the histologic features of SDD, suggesting interconnected subretinal material by sinuous bands.16 This interconnectedness was suspected to be a manifestation of the reticular pattern seen on evaluation under blue light. However, the eye used for the histologic sections was not viewed under blue light prior to sectioning, hence the direct relationship with reticular pseudodrusen was not confirmed. In a single clinically confirmed, RPD-containing specimen examined by Sarks et al., collections of membranous material were found in the subretinal space. More interestingly, similar collections of subretinal debris of the same composition have been demonstrated in specimens without any associated RPD lesions.13 The same group suggested that SDD could be viewed as localized hypo-reflectivity from the RPE and account for the dark appearance of RPD seen on autofluorescence.19
Sohrab et al. characterized RPD on IR, autofluorescence, red-free images, and choroidal SD-OCT scans.17 This study suggested that RPD could not be seen in all areas of subretinal deposits or IS/OS disruptions on en face OCT sections, but tended to be located adjacent to the SDD. Furthermore, these authors showed that RPD lesions bordered the edges of the underlying large choroidal vessels. The first study to suggest choroidal association of RPD was reported by Arnold et al. when they examined a single donor eye with RPD, demonstrating a reticular arrangement of fibrotic changes to the choroidal stroma and a decrease in the number of large choroidal veins.5 The same specimen was found to have choroidal thinning and a reduction in choroidal melanocytes with those remaining melanocytes being located in the outer choroid near the large arteries.
Numerous other studies have provided further evidence of choroidal changes associated with RPD.4, 18, 21-24 Querques et al. utilized indocyanine green angiography along with SD-OCT to show RPD closely abutting, but not overlapping, the large choroidal vessels with similar choroidal thinning as previously described. One observation made in multiple eyes with RPD has been impaired choroidal filling, which is consistent with a choroidal association and may provide a potential mechanism for RPD pathogenesis.3, 5, 25
While a choroidal association with RPD is an area of research focus, there has been little investigation into the relationship between the choroid and SDD. Recently, Vongkulsiri et al. provided the first evidence that SDD are not correlated with large choroidal vessels using a novel random stereological analysis.26 However, no other groups have corroborated the lack of large choroidal vessel involvement with either SDD or RPD and the evidence supporting a relationship with RPD remains substantial.
The proposed mechanisms of both SDD and RPD pathogenesis offer a potential link between the two lesions. Since the initial recognition of a choroidal association with RPD, choroidal ischemia and potential fibrosis has been discussed as a potential mechanism for RPD formation and the appearance of RPD. Loss of the choriocapillaris 22, as well as replacement of stroma between fewer large choroidal veins would lead to ischemia in the overlying RPE. Derangement of the RPE could then cause aberrant accumulation of debris (SDD) above the RPE, perhaps due to metabolic derangements. The theories of pathogenesis of SDD have been more diverse than RPD, given their unusual localization to the subretinal space. The same derangement of the RPE leading to RPD could cause a loss of RPE cell anchors to the basement membrane and adjacent cells resulting in shedding debris into the subretinal space.27 However, the membranous debris may also be a reaction to RPE cell stress, precipitated by ischemic, oxidative, or traumatic injury. The blebbing of cell membrane under these circumstances may represent exocytosis of damaging or damaged cell contents.28 Conversely, the debris may represent material that failed to be phagocytized such as from the photoreceptor outer segments. Another suggested pathogenesis of SDD includes the disruption of lipoprotein transport between the photoreceptor outer segment and the RPE.29 Further characterization of these lesions along with identification of associated clinical, optical and histologic findings will help elucidate their pathogenesis.
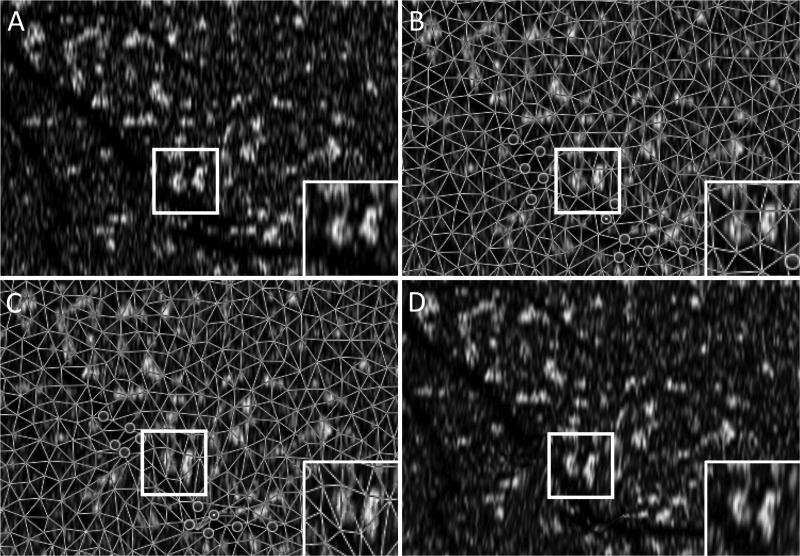
In a recent study, Spaide30 reported colocalization of RPD and SDD in ten eyes using IR and en face SD-OCT, respectively. This study differs from the present study in its manual unmasked selection of a subsection of each experimental image. In addition, an image manipulation photoshop technique called “puppet warping” was used to align the IR and OCT images, with unknown potential effects on the relationship of SDD and RPD in the respective images. “Puppet warping” is a user dependent technique with the potential for intra and inter-user variability. Figure 8 demonstrates image distortion resulting in a change in surface area of SDD lesions rather than image realignment alone, which was the initial goal of this technique. Therefore, in our study we chose to exclude any OCT images with displacement artifacts that warrant manual OCT line realignment, since we felt that any software manipulations could potentially confound our attempts at studying co-localization. These corrections would require the ability to realign each OCT B-scan individually, otherwise, we may be concerned that manual realignment software approaches are bound to induce potential artifactual image distortion (Figure 8). While image quality is a necessary limitation of all studies, choosing a portion of each image introduces another degree of selection bias to this study. Therefore, we excluded in our study any images with poor quality, even with sections of poor quality. Regarding the potential for mismatches between OCT and corresponding IR images, point-to-point colocalization errors of large magnitude have been reported especially in Spectralis, and were shown to be directly proportional to the length of time taken to scan.31 Hence, in the Spaide30 study, where dense rasters and averaging were performed to obtain these scans, these errors are more likely. In contrast, in the present study, as well as previously published studies,17 manual registration and overlay was performed between IR and OCT cube from the same machine without the need for averaging or software registration, which minimized potential mismatch-error (Figure 1 and 2).30
Figure 8.
Blood vessel with displacement artifact and adjacent SDD before and after “puppet warping”
8A: original en face image showing an artificially misaligned blood vessel broken by a displacement artifact. Inset image demonstrating unmodified SDD morphology. 8B: same en face image with “puppet warping” anchors set prior to image modification. 8C: modified en face image with “puppet warping” anchors adjusted to align a blood vessel with displacement artifact. Inset image demonstrating SDD morphology following “puppet warping” application. 8D: modified en face image showing a realigned blood vessel using “puppet warping.”
Limitations
This study has important limitations. We were not able to use a single threshold for all the en face C-scans due to variations in noise and signal strength during the time of image capture. However, a masked observer confirmed the accuracy of SDD lesion identification in five randomly selected images minimizing the likelihood of bias. Another potential source of bias was the manual marking of RPD on IR images, but again, a second masked observer confirmed these markings, with high inter-rater correlation. The lack of universally accepted criteria for RPD could lead to decreased generalizability of the results of this study. However, this is a commonly encountered limitation amongst early research subjects that was minimized using the most widely accepted definition of RPD. We have therefore chosen to use the IR reflectivity definition for RPD diagnosis in this study and all our previous studies. Finally, the exclusion of sample images based on set quality criteria introduces potential selection bias. However, the improved certainty of lesion identification with improved image quality far outweighs this potential for bias or artifacts induced by attempts at manual re-alignment, and is therefore acceptable in the absence of more definitive or automated modalities for RPD lesion identification.
Conclusions
In a previous pilot study we showed qualitative evidence that RPD and SDD may not be topographically identical.17 In the present study, we provide further quantitative evidence in a larger number of eyes, demonstrating a significant quantitative and topographic difference between RPD and SDD. Based on this evidence, further investigation of the relationship between these two entities is warranted.
Acknowledgments
Funding: This work was funded by Research to Prevent Blindness, NY (Department of Ophthalmology, Northwestern University) and R01EY021470 (AAF). The funders had no role in study design, data collection and analysis, decision to publish, or preparation of the manuscript.
Footnotes
Proprietary interest: The authors have declared that they have no proprietary interest in the subject of this manuscript.
Brief summary statement: Significantly more reticular pseudodrusen were seen on infrared reflectance than subretinal drusenoid deposits on en face volumetric spectral-domain optical coherence tomography. Reticular pseudodrusen were found to be occasionally topographically associated to subretinal drusenoid deposits suggesting these two lesions are related, but not the same entity.
Work Cited
- 1.Friedman DS, et al. Prevalence of age-related macular degeneration in the United States. Archives of ophthalmology. 2004;122:564–572. doi: 10.1001/archopht.122.4.564. [DOI] [PubMed] [Google Scholar]
- 2.Lamoureux EL, et al. Impact of early and late age-related macular degeneration on vision-specific functioning. The British journal of ophthalmology. 2011;95:666–670. doi: 10.1136/bjo.2010.185207. [DOI] [PubMed] [Google Scholar]
- 3.Mimoun G, Soubrane G, Coscas G. [Macular drusen]. Journal francais d'ophtalmologie. 1990;13:511–530. [PubMed] [Google Scholar]
- 4.Smith RT, et al. Reticular macular disease. American journal of ophthalmology. 2009;148:733–743. e732. doi: 10.1016/j.ajo.2009.06.028. [DOI] [PMC free article] [PubMed] [Google Scholar]
- 5.Arnold JJ, et al. Reticular pseudodrusen. A risk factor in age-related maculopathy. Retina. 1995;15:183–191. [PubMed] [Google Scholar]
- 6.Pumariega NM, et al. A prospective study of reticular macular disease. Ophthalmology. 2011;118:1619–1625. doi: 10.1016/j.ophtha.2011.01.029. [DOI] [PMC free article] [PubMed] [Google Scholar]
- 7.Cohen SY, et al. Prevalence of reticular pseudodrusen in age-related macular degeneration with newly diagnosed choroidal neovascularisation. The British journal of ophthalmology. 2007;91:354–359. doi: 10.1136/bjo.2006.101022. [DOI] [PMC free article] [PubMed] [Google Scholar]
- 8.Yoneyama S, et al. Genetic and clinical factors associated with reticular pseudodrusen in exudative age-related macular degeneration. Graefe's archive for clinical and experimental ophthalmology = Albrecht von Graefes Archiv fur klinische und experimentelle Ophthalmologie. 2014 doi: 10.1007/s00417-014-2601-y. [DOI] [PubMed] [Google Scholar]
- 9.Steinberg JS, et al. Longitudinal analysis of reticular drusen associated with geographic atrophy in age-related macular degeneration. Investigative ophthalmology & visual science. 2013;54:4054–4060. doi: 10.1167/iovs.12-11538. [DOI] [PubMed] [Google Scholar]
- 10.Ueda-Arakawa N, et al. Prevalence and genomic association of reticular pseudodrusen in age-related macular degeneration. American journal of ophthalmology. 2013;155:260–269. e262. doi: 10.1016/j.ajo.2012.08.011. [DOI] [PubMed] [Google Scholar]
- 11.Finger RP, et al. Reticular pseudodrusen: a risk factor for geographic atrophy in fellow eyes of individuals with unilateral choroidal neovascularization. Ophthalmology. 2014;121:1252–1256. doi: 10.1016/j.ophtha.2013.12.034. [DOI] [PMC free article] [PubMed] [Google Scholar]
- 12.Alten F, et al. Longitudinal structure/function analysis in reticular pseudodrusen. Investigative ophthalmology & visual science. 2014;55:6073–6081. doi: 10.1167/iovs.13-13804. [DOI] [PubMed] [Google Scholar]
- 13.Sarks JP, Sarks SH, Killingsworth MC. Evolution of geographic atrophy of the retinal pigment epithelium. Eye. 1988;2(Pt 5):552–577. doi: 10.1038/eye.1988.106. [DOI] [PubMed] [Google Scholar]
- 14.Rudolf M, et al. Sub-retinal drusenoid deposits in human retina: organization and composition. Experimental eye research. 2008;87:402–408. doi: 10.1016/j.exer.2008.07.010. [DOI] [PMC free article] [PubMed] [Google Scholar]
- 15.Curcio CA, et al. Basal deposits and drusen in eyes with age-related maculopathy: evidence for solid lipid particles. Experimental eye research. 2005;80:761–775. doi: 10.1016/j.exer.2004.09.017. [DOI] [PubMed] [Google Scholar]
- 16.Zweifel SA, et al. Reticular pseudodrusen are subretinal drusenoid deposits. Ophthalmology. 2010;117:303–312. e301. doi: 10.1016/j.ophtha.2009.07.014. [DOI] [PubMed] [Google Scholar]
- 17.Sohrab MA, et al. Image registration and multimodal imaging of reticular pseudodrusen. Investigative ophthalmology & visual science. 2011;52:5743–5748. doi: 10.1167/iovs.10-6942. [DOI] [PubMed] [Google Scholar]
- 18.Grewal DS, et al. A pilot quantitative study of topographic correlation between reticular pseudodrusen and the choroidal vasculature using en face optical coherence tomography. PloS one. 2014;9:e92841. doi: 10.1371/journal.pone.0092841. [DOI] [PMC free article] [PubMed] [Google Scholar]
- 19.Sarks J, et al. Evolution of reticular pseudodrusen. The British journal of ophthalmology. 2011;95:979–985. doi: 10.1136/bjo.2010.194977. [DOI] [PubMed] [Google Scholar]
- 20.Yasuno Y, et al. Visualization of sub-retinal pigment epithelium morphologies of exudative macular diseases by high-penetration optical coherence tomography. Investigative ophthalmology & visual science. 2009;50:405–413. doi: 10.1167/iovs.08-2272. [DOI] [PubMed] [Google Scholar]
- 21.Querques G, et al. Choroidal changes associated with reticular pseudodrusen. Investigative ophthalmology & visual science. 2012;53:1258–1263. doi: 10.1167/iovs.11-8907. [DOI] [PubMed] [Google Scholar]
- 22.Sohrab M, Wu K, Fawzi AA. A pilot study of morphometric analysis of choroidal vasculature in vivo, using en face optical coherence tomography. PloS one. 2012;7:e48631. doi: 10.1371/journal.pone.0048631. [DOI] [PMC free article] [PubMed] [Google Scholar]
- 23.Alten F, et al. Localized reticular pseudodrusen and their topographic relation to choroidal watershed zones and changes in choroidal volumes. Investigative ophthalmology & visual science. 2013;54:3250–3257. doi: 10.1167/iovs.13-11923. [DOI] [PubMed] [Google Scholar]
- 24.Garg A, et al. Reticular pseudodrusen in early age-related macular degeneration are associated with choroidal thinning. Investigative ophthalmology & visual science. 2013;54:7075–7081. doi: 10.1167/iovs.13-12474. [DOI] [PMC free article] [PubMed] [Google Scholar]
- 25.Smith RT, et al. Autofluorescence characteristics of early, atrophic, and high-risk fellow eyes in age-related macular degeneration. Investigative ophthalmology & visual science. 2006;47:5495–5504. doi: 10.1167/iovs.05-1318. [DOI] [PMC free article] [PubMed] [Google Scholar]
- 26.Vongkulsiri S, et al. The Lack of Concordance Between Subretinal Drusenoid Deposits and Large Choroidal Blood Vessels. American journal of ophthalmology. 2014 doi: 10.1016/j.ajo.2014.07.009. [DOI] [PubMed] [Google Scholar]
- 27.Sarks SH, SJP . Medical Retina. Mosby; St. Louis: 2001. Age-related maculopathy: nonneovascular age-related macular degeneration and the evolution of geographic atrophy. pp. 1064–1099. [Google Scholar]
- 28.Sarks S, et al. Relationship of Basal laminar deposit and membranous debris to the clinical presentation of early age-related macular degeneration. Investigative ophthalmology & visual science. 2007;48:968–977. doi: 10.1167/iovs.06-0443. [DOI] [PubMed] [Google Scholar]
- 29.Curcio CA, et al. Subretinal drusenoid deposits in non-neovascular age-related macular degeneration: morphology, prevalence, topography, and biogenesis model. Retina. 2013;33:265–276. doi: 10.1097/IAE.0b013e31827e25e0. [DOI] [PMC free article] [PubMed] [Google Scholar]
- 30.Spaide RF. Colocalization of pseudodrusen and subretinal drusenoid deposits using high-density en face spectral domain optical coherence tomography. Retina. 2014;34:2336–2345. doi: 10.1097/IAE.0000000000000377. [DOI] [PubMed] [Google Scholar]
- 31.Barteselli G, et al. Accuracy of the Heidelberg Spectralis in the alignment between near-infrared image and tomographic scan in a model eye: a multicenter study. American journal of ophthalmology. 2013;156:588–592. doi: 10.1016/j.ajo.2013.04.030. [DOI] [PMC free article] [PubMed] [Google Scholar]


