

Abstract
Background
The analysis of differential gene expression is a fundamental tool to relate gene regulation with specific biological processes. Differential binding of transcription factors (TFs) can drive differential gene expression. While DNase-seq data can provide global snapshots of TF binding, tools for detecting differential binding from pairs of DNase-seq data sets are lacking.
Results
In order to link expression changes with changes in TF binding we introduce the concept of differential footprinting alongside a computational tool. We demonstrate that differential footprinting is associated with differential gene expression and can be used to define cell types by their specific TF occupancy patterns.
Conclusions
Our new tool, Wellington-bootstrap, will enable the detection of differential TF binding facilitating the study of gene regulatory systems.
Electronic supplementary material
The online version of this article (doi:10.1186/s12864-015-2081-4) contains supplementary material, which is available to authorized users.
Keywords: Transcriptional regulation, Transcription factors binding sites, Digital genomic footprinting, DNase-seq analysis, Gene regulatory networks
Background
Digital DNaseI footprinting is a high throughput adaptation of classical DNaseI footprinting [1]. By subjecting nuclei to digestion by DNaseI, nucleosome-depleted genomic regions (accessible chromatin) that are sensitive to cleavage can be identified as DNase Hypersensitive Sites (DHSs) [2, 3]. Analyses of the patterns by which DNase I cuts within DHSs enables the identification of regions protected from digestion or “footprints”, which accurately demarcate transcription factor binding sites (TFBSs) at sub-30 bp resolution [4–10]. However, all currently available footprinting tools are designed for the analysis of a single DNase-seq data set at a time and thus will indiscriminately identify TFBSs that are part of a variety of different gene regulatory networks, limiting the ability to link regulatory events to cell- and tissue-specific processes, such as changes in cell fate or response to extracellular signals. For gene expression studies, a plethora of computational methods have been developed in order to identify genes that are differentially expressed in different conditions, thereby linking gene expression to changes in cellular status. However, a similar methodology that identifies differential transcription factor occupancy between DNase-seq datasets has so far been lacking, and methods such as DiffBind [11], designed for ChIP-seq are not appropriate for DNase-seq data. Here we describe the development of a novel computational tool to identify differential footprints (DFPs). We show that this tool can be used to link differential TF occupancy with differential gene expression and to identify closely related cell types by virtue of their TF occupancy patterns.
Results and discussion
We have developed a conceptually simple and computationally efficient method, Wellington-bootstrap, for pairwise analysis of DNase-seq data sets. Wellington-boostrap builds on the Wellington method for detecting footprints in individual data sets [8]. Wellington uses knowledge of the strand imbalance around the TFBS introduced by the size-selection step in the double-hit DNase-seq method [12] in order to accurately detect footprints. This strand imbalance results in a characteristic pattern of reads aligning to the positive reference strand directly upstream of the TFBS and reads aligning to the negative reference strand directly downstream of the TFBS. With Wellington-bootstrap, footprints in data set A are detected and at each footprint locus a statistical test is performed testing whether pooling the data of data set B with A contributes to the footprint pattern or not. This yields a set of sites that are over-footprinted in A (under-footprinted in B) and associated DFP scores. Repeating the analysis with reversed roles for A and B yields over-footprinted sites in B (under-footprinted in A). We chose the approach of pooling data at individual loci in order to avoid biases that may be brought about by variations in sequencing depth.
Applying Wellington-bootstrap to publically available DNase-seq data for CD8+ and CD19+ cells we find 37,488 sites with evidence for DFPs. Furthermore, the Wellington-bootstrap score provides a way to order DFPs by the extent of footprint differences (Fig. 1). We found similar results making pairwise comparisons for all DNase-seq data sets for seven cell types from clinical tissue samples. A large proportion (up to 98.5 %, 43.9 % on average) of DFPs are found in DHSs that are shared between cell types, in particular in closely related cell types, indicating that these differences would be missed by restricting analyses to the presence or absence of DHSs (Table 1).
Fig. 1.
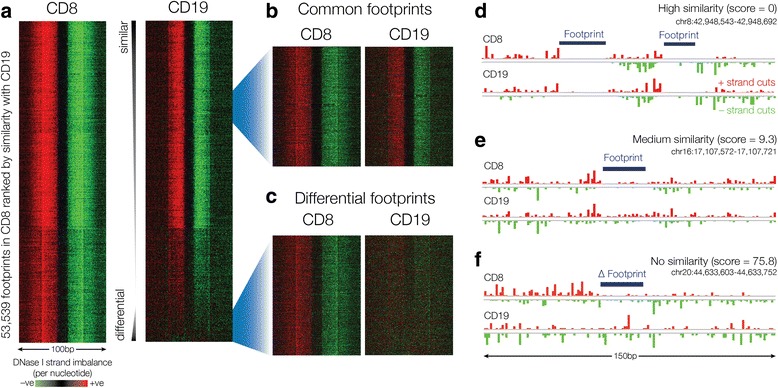
Wellington-bootstrap scores differential footprint occupancy between DNase-seq datasets. Wellington-bootstrap was applied at footprint loci in CD8+ cells to detect over-footprinted sites relative to CD19+ cells. a 53,539 loci were sorted by increasing Wellington-bootstrap score comparing CD8 vs CD19. Eight thousand seven hundred eighty loci were deemed to be DFPs. Red indicates an excess of positive strand cuts over negative strand cuts per nucleotide position, and green indicates an excess of negative strand cuts. Common footprints at the top of the heatmap share similar DNase activity as exemplified in (b) and (d) whereas footprints with increasing differential score towards the bottom of the heatmap show increasingly differential footprints (c, e, f)
Table 1.
A large proportion of differential footprints occurs in shared DHSs
| Cell type A | Cell type B | DHSs in A | DHSs in B | DHSs shared between A and B | Sites over-footprinted in A | Sites in common DHSs over-footprinted in A | Sites over-footprinted in B | Sites in common DHSs over-footprinted in B |
|---|---|---|---|---|---|---|---|---|
| CD4 | CD8 | 84,830 | 60,890 | 49,365 | 14,772 | 10,600 (71.8) | 3874 | 3584 (92.5) |
| CD4 | CD14 | 84,830 | 109,647 | 47,887 | 14,819 | 6219 (42) | 17,932 | 7663 (42.7) |
| CD4 | CD19 | 84,830 | 89,660 | 43,282 | 18,525 | 10,423 (56.3) | 19,439 | 13,018 (67) |
| CD4 | CD56 | 84,830 | 69,966 | 54,739 | 17,745 | 14,611 (82.3) | 2616 | 2526 (96.6) |
| CD4 | Spinal cord | 84,830 | 197,751 | 34,812 | 24,652 | 9158 (37.1) | 93,152 | 10,233 (11) |
| CD4 | Fibroblasts | 84,830 | 193,546 | 40,240 | 21,473 | 7087 (33) | 118,265 | 11,741 (9.9) |
| CD8 | CD14 | 60,890 | 109,647 | 32,185 | 11,602 | 6529 (56.3) | 55,650 | 12,546 (22.5) |
| CD8 | CD19 | 60,890 | 89,660 | 32,350 | 8780 | 5520 (62.9) | 28,708 | 15,549 (54.2) |
| CD8 | CD56 | 60,890 | 69,966 | 51,965 | 1458 | 1428 (97.9) | 335 | 330 (98.5) |
| CD8 | Spinal cord | 60,890 | 197,751 | 27,631 | 13,128 | 5444 (41.5) | 110,950 | 11,330 (10.2) |
| CD8 | Fibroblasts | 60,890 | 193,546 | 30,237 | 13,734 | 5894 (42.9) | 156,418 | 15,573 (10) |
| CD14 | CD19 | 109,647 | 89,660 | 36,349 | 48,031 | 15,909 (33.1) | 27,111 | 18,140 (66.9) |
| CD14 | CD56 | 109,647 | 69,966 | 33,900 | 54,850 | 17,845 (32.5) | 7842 | 5357 (68.3) |
| CD14 | Spinal cord | 109,647 | 197,751 | 33,141 | 53,731 | 13,584 (25.3) | 96,856 | 13,563 (14) |
| CD14 | Fibroblasts | 109,647 | 193,546 | 45,179 | 37,641 | 8383 (22.3) | 108,482 | 12,677 (11.7) |
| CD19 | CD56 | 89,660 | 69,966 | 35,766 | 31,561 | 19,315 (61.2) | 5553 | 4130 (74.4) |
| CD19 | Spinal cord | 89,660 | 197,751 | 31,858 | 28,993 | 13,118 (45.2) | 97,388 | 14,826 (15.2) |
| CD19 | Fibroblasts | 89,660 | 193,546 | 30,831 | 32,531 | 13,760 (42.3) | 138,301 | 20,224 (14.6) |
| CD56 | Spinal cord | 69,966 | 197,751 | 28,731 | 8633 | 4404 (51) | 110,996 | 13,892 (12.5) |
| CD56 | Fibroblasts | 69,966 | 193,546 | 31,469 | 9237 | 4769 (51.6) | 154,923 | 20,024 (12.9) |
| Spinal cord | Fibroblasts | 197,751 | 193,546 | 64,733 | 24,756 | 5497 (22.2) | 35,202 | 9461 (26.9) |
Number of DHSs and shared DHSs, number of over-footprinted sites, and number of over-footprinted sites located in the overlap of shared DHSs are shown for pairs of cell types. For closely related cell types most differential footprints tend to be found in common DHSs (e.g. CD4+ vs. CD56+). Developmentally distant cell types, however, often have a large number of DHSs that are cell type specific, and therefore the majority of differential footprints are in cell-type specific DHSs (e.g. CD56+ cells vs. fibroblasts)
Using Spinal cord and CD4+ cells as example we tested the ability of DFPs to re-discover known regulatory links and predict gene expression. In CD4+ cells, the T cell specific TF T-bet binds T-box motifs and enhances target gene expression as part of the Th1-differentiation programme [13]. In spinal cord cells, the TF MAZ is known to be involved in neuronal development [14]. Among the set of all DFPs located near transcriptional start sites and over-footprinted in CD4+ cells we identified the sites containing a match for the T-box motif. We found that the expression of nearby genes differed significantly, with the DNase-seq data providing strong evidence for the presence of protein binding in CD4+ cells and absence of binding in spinal cord cells (Fig. 2a, b). Similarly, we found that a link between binding to MAZ motifs and gene expression was evident (Additional file 1: Figure S1a, b), demonstrating the ability of the DFP approach to isolate the effect of individual TFs from their genomic context.
Fig. 2.
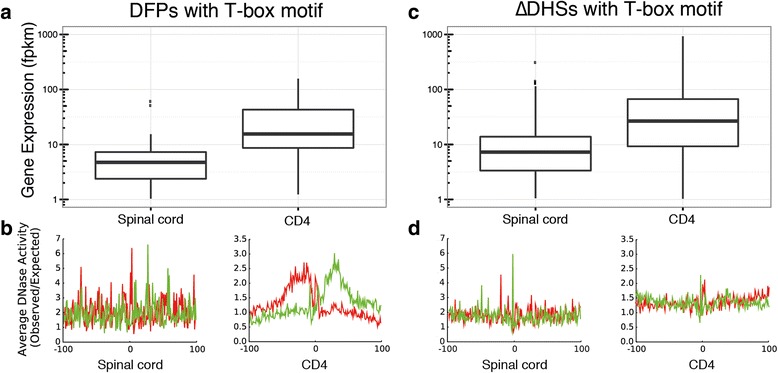
Differential footprints reveal links between TF binding and gene expression. a Differential gene expression (p < 0.005, Mann–Whitney U test) of all genes that have a differential CD4 footprint containing a match for the T-box motif in their promoter. b Average bias-corrected DNase-seq cleavage profiles (red: positive strand cuts, green: negative strand cuts) centred on T-box motifs in promoters of genes from (a) show evidence for binding of T-box motifs in CD4+ cells, but not in spinal cord cells. Genes over-footprinted for T-box in CD4+ cells are also over-expressed, confirming a known lineage-determining link. c Differential gene expression of all genes that have a differential CD4+ DHS containing a match for the T-box motif in their promoter. d Average bias-corrected DNase-seq cleavage profiles centred on T-box motifs in promoters of genes from (c) do not show evidence for binding in either cell type. The differential expression observed in (c) cannot be linked to TF binding using differential DHS scores alone
Previously, comparisons of total read numbers in DHSs have been used as a means of analysing pairs of DNase-seq data sets [15]. We identified the set of T-box motif-containing DHSs in gene promoters with the highest increase in read numbers in CD4+ cells compared to spinal cord cells. While these showed differential expression of nearby genes, no evidence for differences in binding was revealed using this approach (Fig. 2c, d). Similarly, this approach did not reveal the regulatory link between MAZ binding and target gene expression (Additional file 1: Figure S1c, d). The cleavage profiles shown in Fig. 2b, d and Additional file 1: Figure S1b, d have been corrected for the known sequence preference of the DNaseI enzyme. Additional file 1: Figure S2 compares cleavage profiles with and without this correction. Overall, this suggests that unlike DFPs, motif analysis of DHSs is insufficient to link a given TF to changes in gene expression, making the use of DFPs a valuable tool for this purpose.
We sought to further explore the potential of the DFP approach to reveal cell type-specific regulatory mechanisms. Using differential footprints amongst all pairs of DNase-seq data sets of seven primary cell types, we determined the relative frequency of motif occurrences for a set of known TF binding motifs and used this data to cluster the set of pairs of cell lines as well as the set of TF binding motifs (Fig. 3). This analysis generated a number of striking results. Firstly, our DFP methodology combined with clustering recovered the different cell types as separate clusters. Moreover, it was able to distinguish between the different cell types as their specifically occupied DNA sequences clustered together. Secondly, the analysis gave interesting insights into the relative role of individual TF families within a given cell type. For example, high differential C/EBP motif occupancy was a classifier for CD14+ monocytes as well as fibroblasts, both of which express CEBPA, but the relative motif frequency was lower in fibroblasts which agrees with the fact that this factor is absolutely essential for monocyte but not fibroblast development [16, 17]. Another interesting finding was that increased occupancy of PU.1 motifs was a classifier for both B cells and CD14+ monocytic cells where this factor plays an important role [18], but a significant number of such sites were occupied also in T cells. PU.1 is expressed in hematopoietic stem cells from which all hematopoietic cells originate, but its expression is down-regulated in T cells and its overexpression is detrimental for their development [19]. There is some overlap between the binding specificities of different ETS-family proteins [20]. It is therefore possible that some of these sequences are bound by another ETS factor in T cells. Importantly, gene expression patterns of typical TFs corresponding to motifs enriched in differential footprints showed tissue-specific expression, whereby they tended to be expressed in the cell type in which they were differentially footprinted. Comparable motifs could also be obtained in an unbiased way via de novo motif discovery, as exemplified for a CD19 versus CD4 differential footprinting analysis (Additional file 1: Figure S4). These motif results are supported by previous findings in B-cells [21, 22].
Fig. 3.
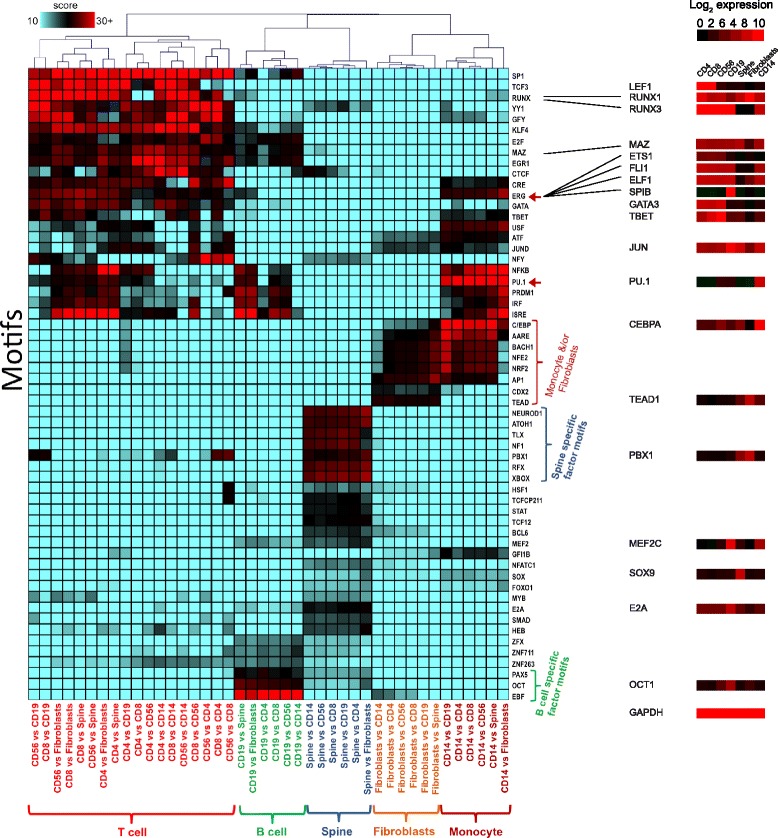
Analysis of differential footprints in the haematopoietic system reveals cell-type specific transcription factor networks. Differential footprints in 42 pairs of cell types and matches to known motifs inside differential footprints were determined using DNase-seq data from the NIH Roadmap Epigenomics project. Coloured boxes represent motif frequency with red indicating higher than average frequency. Hierarchical clustering was applied to rows and columns. Red arrows highlight members of the ETS family of transcription factors. BioGPS gene expression of typical tissue-specific TFs corresponding to motifs enriched in DFPs is shown to the right, with GAPDH as a positive control (bottom). The result correctly groups cell types and reveals known and likely regulatory factors
To facilitate the wide-spread use of our method, we provide an implementation of Wellington-bootstrap alongside a substantial update of pyDNase, including increased performance and parallelised computations. This is released as open source under the GPLv3 license at https://github.com/jpiper/pyDNase.
Conclusions
In conclusion, we introduce a fundamental and useful method for differential footprints, provide a tool for the detection of DFPs, and reveal the potential of this approach to map regulators to context-specific gene expression. Applying this methodology will be highly relevant for classifying closely related cell types, both in the normal, but also the diseased state and to assess the relative importance of specific TF families for each state. Wellington-bootstrap is applicable to any pair of DNase-seq data sets obtained with comparable experimental protocols including perturbation and time course experiments, making it a widely applicable approach for the identification of transcriptional regulatory hierarchies.
Methods
DNase-seq data and peak-finding
DNase-seq data from the NIH Roadmap Epigenomics project [23] were downloaded from the Short Read Archive (accessions CD4: SRX214041, CD8: SRX204403, CD19: SRX342324, CD14: SRX252602, CD56: SRX204402, spinal cord: SRX121287, fibroblasts: SRX135564) and were aligned to hg19 using Bowtie 2.2.0 [24] using the default parameters. DNase hypersensitive site detection for all DNase-seq data was performed using HOMER’s findPeaks.pl tool [25] with the parameters “findPeaks -region -size 500 -minDist 50 -o auto -tbp 0”.
Differential footprinting – Wellington-bootstrap
Wellington-bootstrap first determines Wellington footprints in the primary dataset. At each footprint locus the data from the comparator dataset is added and the Wellington footprint score for the pooled data evaluated. Wellington-bootstrap then assesses if the change in footprint score is a consequence of the increase in read numbers after pooling reads or if the data from the comparator dataset makes a contribution to the footprint structure. To do this, the comparator data is randomly shuffled 1000 times, pooled, and the Wellington footprint score evaluated (see example in Additional file 1: Figure S3). Shuffling is done in a strand independent manner, randomising the positions of the counts of 5′ DNase cuts per base pair on the positive and negative strand. The score of pooled data without shuffling is assessed against the bootstrap distribution and the percentile used as the differential footprinting score. Low scores indicate non-differential footprints, high scores differential footprints. Figure 1 shows that sorting by this score orders pairs of footprints in an intuitive manner enabling the user to retrieve the most differential footprints while choosing the stringency. 10 was used as the threshold in this work. The role of the two datasets is reversed and the computation repeated to obtain both over- and under-footprinted sites.
It was initially thought that flexibility would be required regarding the width of the footprint and its position in the two datasets. Whilst initial methods were developed to take this into consideration, we found that this provided no improvement to the method, yet yielded a significant speed decrease. This analysis has been implemented in the wellington_bootstrap.py script as part of pyDNase 0.2.0.
Differential DHSs – Fig. 2 and Additional file 1: Figure S1
Differential DHSs (∆DHS) scores were calculated according to the method proposed by He et al. 2012 [15] and the implementation used here has been provided as dnase_dshs_scores.py in pyDNase 0.2.0. DHSs were then filtered to those that were within 2 kb of a single TSS using the hg19 UCSC knownGene gene model, and the DHSs showing the top and bottom n = 1000 ∆DHS scores were chosen as the differential DHSs. Equivalent results were obtained using the following alternative choices for n: 50 (matching the number of DFPs used in Fig. 2a,b), top 476 and bottom 300 (corresponding to two standard deviations difference to mean ∆DHS score), 1403 (corresponding to top and bottom 10 %).
RNA-seq analysis
RNA-seq data were downloaded from the Short Read Archive (accessions CD4: SRR643766, spinal cord: SRR980477) and FPKM was estimated using Tophat 2.0.11 [26] and Cufflinks 2.1.1 [27] with the Illumina iGenomes UCSC hg19 knownGene GTF file.
Motif analysis – Fig. 3
The annotatePeaks.pl script of the HOMER package was used to find occurrences of known motifs in peaks. Wellington-bootstrap was applied to compute 42 sets of differential footprints for all ordered pairs of the seven cell types used (CD4/CD8 T-cells, CD56 NK cells, CD19+ B cells, spinal cord cells, fibroblasts, CD14+ monocytes). To analyse motif frequencies in differential footprints motif search was done within the differential footprint coordinates extended by 10 bp either side. Relative motif frequencies were calculated as
where C is a scaling constant, nij is the number of differential footprints in set j (j = 1,2,…,42) that are occupied by motif i (i = 1, 2,….,I), I is the total number of motifs used, and Mj the total number of differential footprints in each subset j (j = 1,2,…,42). A matrix was generated and motif scores displayed as a heatmap after hierarchical clustering with Euclidean distance and complete linkage. Blue indicates low relative frequency; red/black indicates high relative frequency. Heatmaps were generated using Mev of the TM4 microarray software suite [28].
Gene expression of transcription factors in all tissues
HG_U133A microarray expression data from BioGPS [29], covering 84 normal tissues as well as penis foreskin fibroblasts (GEO accession number GSE4521) were retrieved, concatenated and normalized via R using the normalizeQuantiles function of limma [30]. Heatmap images were obtained via Java Treeview [31].
De novo motif discovery
The findMotifsGenome.pl script of the HOMER package was used to perform de novo motif discovery in CD19 versus CD4 differential footprints.
pyDNase 0.2.0 – cutting bias correction
In order to plot cut bias corrected average DNase cleavage plots, the DNaseI 6-mer cutting bias data from naked genomic data from the IMR90 cell line and for each region an ‘expected count’ was calculated using the ‘predicted count’ formula from He et al. 2014 [32]. The observed cuts at each base pairs were then divided by the expected counts. Bias correction modes have been added to the plotting scripts in pyDNase that can be invoked with the ‘-b < genome.fa>’ option. The BAMHandlerWithBias class in pyDNase provides underlying access to the bias correction for power users. In this we have provisioned the ability for the user to supply a Variant Call Format (VCF) file so that the reference DNA sequence can be corrected using SNPs present in the sample being analysed if desired.
pyDNase 0.2.0 – other new features and improvements
pyDNase 0.2.0 represents a major release for pyDNase, bringing several improvements. The core Wellington algorithm was reimplemented in C, and the underlying code structure was refactored in order to allow for parallelisation of Wellington score calculation. On a dual 2.66Ghz i7 Xeon workstation with 8 cores, footprinting a single dataset takes approximately 30 min, compared to up to 20 h previously on a single core – this performance increase scales linearly with number of cores utilised. In addition, a number of analysis scripts have been added to the pyDNase library for calculating ∆DHS scores, calculating Wellington-bootstrap scores, annotation of BED files with Footprint Occupancy Scores, and the annotation of a BED file with DNase cuts. A comprehensive DNase-seq footprinting tutorial has also been added to assist those new to DNase-seq analysis and DNase-seq footprinting. Full details can be found at the pyDNase github repository (https://github.com/jpiper/pyDNase).
Data access
All software is released as open source under the GPLv3 license at http://jpiper.github.io/pyDNase/.
Acknowledgments
J.P. was in part supported by the Engineering and Physical Sciences Research Council (EP/P50578X/1 PhD grant). Work in the labs of C.B. and P.N.C. was supported by grants from Leukaemia Lymphoma Research and the Kay Kendall Leukaemia Fund. We thank Alan Boyle, Shirley Liu and Cliff Meyer for stimulating discussions.
Abbreviations
- DFP
Differential footprint
- DHS
DNase hypersensitive site
- ∆DHS
Differential DNase hypersensitive site
- TF
Transcription factor
- TFBS
Transcription factor binding site
Additional file
Differential footprints reveal links between TF binding and gene expression. (a) Differential gene expression (p < 0.005, Mann–Whitney U test) of all genes that have a differential spinal cord footprint containing a match for the MAZ motif in their promoter. (b) Average bias-corrected DNase-seq cleavage profiles (red: positive strand reads, green: negative strand reads) for MAZ sites in promoters of genes from (a) show evidence for binding of MAZ motifs in spinal cord cells, but not in CD4+ cells. Genes over-footprinted for MAZ in spinal cord cells are also over-expressed, confirming a known lineage-determining link. (c) Differential gene expression of all genes that have a differential spinal cord DHS containing a match for the MAZ motif in their promoter. (d) Average bias-corrected DNase-seq cleavage profiles for MAZ sites in promoters of genes from (c) show evidence for binding in both cell types. The differential expression observed in (c) cannot be linked to differences in TF binding using differential DHS scores alone. Figure S2. Bias correction refines profiles of average cutting. For T-box-containing loci of differential footprints used in Fig. 2b average DNaseI cleavage profiles are shown before (a, c) and after (b, d) correcting for the sequence specificity of DNaseI cleavage using a 6-mer model (He et al., 2013). Plots (b) and (d) are the ones shown in Fig. 2b. Figure S3. Example of a footprint deemed non-differential. (a) Red (green) bars represent numbers of 5′ ends of reads aligning to the positive (negative) reference strand. Vertical black lines indicate footprint region. (b) Bootstrap distribution for data shown in (a). Nucleotide positions in CD19 data were randomly shuffled and the distribution of Wellington footprint scores after pooling the shuffled CD19 data and the fibroblast data was determined. Blue vertical bar shows the Wellington score after pooling data without shuffling. Green: Wellington footprint score in fibroblast data. Red: footprint score in CD19 data. As pooling without shuffling yields a better footprint score than pooling with shuffling the footprint is considered non-differential. Figure S4. Example of de novo motif discovery in differential footprints. HOMER de novo motif discovery results in footprints differentially enriched in CD19 versus CD4 lymphocytes. The top 6 motifs are shown sorted by increasing p-value. (DOCX 545 kb)
Footnotes
Competing interests
The authors declare no competing interests.
Authors’ contributions
JP designed the study together with SO and SAA. JP, SAA, PC, and CL performed data analyses. JP developed the software and wrote the manuscript. All other authors contributed towards the drafting of the manuscript. PNC, CB, and SO provided general guidance and supervision. All authors have read and approved the manuscript.
Contributor Information
Peter N. Cockerill, Email: P.N.Cockerill@bham.ac.uk
Constanze Bonifer, Email: C.Bonifer@bham.ac.uk.
Sascha Ott, Email: s.ott@warwick.ac.uk.
References
- 1.Galas DJ, Schmitz A. DNAse footprinting: a simple method for the detection of protein-DNA binding specificity. Nucleic Acids Res. 1978;5:3157–70. doi: 10.1093/nar/5.9.3157. [DOI] [PMC free article] [PubMed] [Google Scholar]
- 2.Boyle AP, Davis S, Shulha HP, Meltzer P, Margulies EH, Weng Z, et al. High-resolution mapping and characterization of open chromatin across the genome. Cell. 2008;132:311–22. doi: 10.1016/j.cell.2007.12.014. [DOI] [PMC free article] [PubMed] [Google Scholar]
- 3.Cockerill PN. Structure and function of active chromatin and DNase I hypersensitive sites. FEBS J. 2011;278:2182–210. doi: 10.1111/j.1742-4658.2011.08128.x. [DOI] [PubMed] [Google Scholar]
- 4.Hesselberth JR, Chen X, Zhang Z, Sabo PJ, Sandstrom R, Reynolds AP, et al. Global mapping of protein-DNA interactions in vivo by digital genomic footprinting. Nature Methods. 2009;6:283–9. doi: 10.1038/nmeth.1313. [DOI] [PMC free article] [PubMed] [Google Scholar]
- 5.Boyle AP, Song L, Lee B-K, London D, Keefe D, Birney E, et al. High-resolution genome-wide in vivo footprinting of diverse transcription factors in human cells. Genome Research. 2011;21:456–64. doi: 10.1101/gr.112656.110. [DOI] [PMC free article] [PubMed] [Google Scholar]
- 6.Pique-Regi R, Degner JF, Pai AA, Gaffney DJ, Gilad Y, Pritchard JK. Accurate inference of transcription factor binding from DNA sequence and chromatin accessibility data. Genome Research. 2011;21:447–55. doi: 10.1101/gr.112623.110. [DOI] [PMC free article] [PubMed] [Google Scholar]
- 7.Neph S, Vierstra J, Stergachis AB, Reynolds AP, Haugen E, Vernot B, et al. An expansive human regulatory lexicon encoded in transcription factor footprints. Nature. 2012;489:83–90. doi: 10.1038/nature11212. [DOI] [PMC free article] [PubMed] [Google Scholar]
- 8.Piper J, Elze MC, Cauchy P, Cockerill PN, Bonifer C, Ott S. Wellington: a novel method for the accurate identification of digital genomic footprints from DNase-seq data. Nucleic Acids Res. 2013;41:e201. doi: 10.1093/nar/gkt850. [DOI] [PMC free article] [PubMed] [Google Scholar]
- 9.Sherwood RI, Hashimoto T, O’Donnell CW, Lewis S, Barkal AA, van Hoff JP, et al. Discovery of directional and nondirectional pioneer transcription factors by modeling DNase profile magnitude and shape. Nat Biotechnol. 2014;32:171–8. doi: 10.1038/nbt.2798. [DOI] [PMC free article] [PubMed] [Google Scholar]
- 10.Sung M-H, Guertin MJ, Baek S, Hager GL. DNase footprint signatures are dictated by factor dynamics and DNA sequence. Mol. Cell. 2014;56:275–85. doi: 10.1016/j.molcel.2014.08.016. [DOI] [PMC free article] [PubMed] [Google Scholar]
- 11.Ross-Innes CS, Stark R, Teschendorff AE, Holmes KA, Ali HR, Dunning MJ, et al. Differential oestrogen receptor binding is associated with clinical outcome in breast cancer. Nature. 2012;481:389–93. doi: 10.1038/nature10730. [DOI] [PMC free article] [PubMed] [Google Scholar]
- 12.Sabo PJ, Kuehn MS, Thurman R, Johnson BE, Johnson EM, Cao H, et al. Genome-scale mapping of DNase I sensitivity in vivo using tiling DNA microarrays. Nature Methods. 2006;3:511–8. doi: 10.1038/nmeth890. [DOI] [PubMed] [Google Scholar]
- 13.Szabo SJ, Kim ST, Costa GL, Zhang X, Fathman CG, Glimcher LH. A novel transcription factor, T-bet, directs Th1 lineage commitment. Cell. 2000;100:655–69. doi: 10.1016/S0092-8674(00)80702-3. [DOI] [PubMed] [Google Scholar]
- 14.Wang J, Cheng H, Li X, Lu W, Wang K, Wen T. Regulation of neural stem cell differentiation by transcription factors HNF4-1 and MAZ-1. Mol. Neurobiol. 2013;47:228–40. doi: 10.1007/s12035-012-8335-0. [DOI] [PubMed] [Google Scholar]
- 15.He HH, Meyer CA, Chen M-W, Jordan VC, Brown M, Liu XS. Differential DNase I hypersensitivity reveals factor-dependent chromatin dynamics. Genome Research. 2012;22:1015–25. doi: 10.1101/gr.133280.111. [DOI] [PMC free article] [PubMed] [Google Scholar]
- 16.Zhang DE, Zhang P, Wang ND, Hetherington CJ, Darlington GJ, Tenen DG. Absence of granulocyte colony-stimulating factor signaling and neutrophil development in CCAAT enhancer binding protein alpha-deficient mice. Proc Natl Acad Sci USA. 1997;94:569–74. doi: 10.1073/pnas.94.2.569. [DOI] [PMC free article] [PubMed] [Google Scholar]
- 17.Ranjan R, Thompson EA, Yoon K, Smart RC. C/EBPalpha expression is partially regulated by C/EBPbeta in response to DNA damage and C/EBPalpha-deficient fibroblasts display an impaired G1 checkpoint. Oncogene. 2009;28:3235–45. doi: 10.1038/onc.2009.176. [DOI] [PMC free article] [PubMed] [Google Scholar]
- 18.Scott EW, Simon MC, Anastasi J, Singh H. Requirement of transcription factor PU.1 in the development of multiple hematopoietic lineages. Science. 1994;265:1573–7. doi: 10.1126/science.8079170. [DOI] [PubMed] [Google Scholar]
- 19.Anderson MK, Weiss AH, Hernandez-Hoyos G, Dionne CJ, Rothenberg EV. Constitutive expression of PU.1 in fetal hematopoietic progenitors blocks T cell development at the pro-T cell stage. Immunity. 2002;16:285–96. doi: 10.1016/S1074-7613(02)00277-7. [DOI] [PubMed] [Google Scholar]
- 20.Jolma A, Yan J, Whitington T, Toivonen J, Nitta KR, Rastas P, et al. DNA-binding specificities of human transcription factors. Cell. 2013;152:327–39. doi: 10.1016/j.cell.2012.12.009. [DOI] [PubMed] [Google Scholar]
- 21.Leddin M, Perrod C, Hoogenkamp M, Ghani S, Assi S, Heinz S, et al. Two distinct auto-regulatory loops operate at the PU.1 locus in B cells and myeloid cells. Blood. 2011;117:2827–38. doi: 10.1182/blood-2010-08-302976. [DOI] [PMC free article] [PubMed] [Google Scholar]
- 22.Kreher S, Bouhlel MA, Cauchy P, Lamprecht B, Li S, Grau M, et al. Mapping of transcription factor motifs in active chromatin identifies IRF5 as key regulator in classical Hodgkin lymphoma. Proc Natl Acad Sci. 2014;111:E4513–22. doi: 10.1073/pnas.1406985111. [DOI] [PMC free article] [PubMed] [Google Scholar]
- 23.Bernstein BE, Stamatoyannopoulos JA, Costello JF, Ren B, Milosavljevic A, Meissner A, et al. The NIH roadmap epigenomics mapping consortium. Nat Biotechnol. 2010;28:1045–8. doi: 10.1038/nbt1010-1045. [DOI] [PMC free article] [PubMed] [Google Scholar]
- 24.Langmead B, Salzberg SL. Fast gapped-read alignment with Bowtie 2. Nature Methods. Nature Publishing Group. 2012;9:357–9. doi: 10.1038/nmeth.1923. [DOI] [PMC free article] [PubMed] [Google Scholar]
- 25.Heinz S, Benner C, Spann N, Bertolino E, Lin YC, Laslo P, et al. Simple combinations of lineage-determining transcription factors prime cis-regulatory elements required for macrophage and B cell identities. Mol. Cell. 2010;38:576–89. doi: 10.1016/j.molcel.2010.05.004. [DOI] [PMC free article] [PubMed] [Google Scholar]
- 26.Kim D, Pertea G, Trapnell C, Pimentel H, Kelley R, Salzberg SL. TopHat2: accurate alignment of transcriptomes in the presence of insertions, deletions and gene fusions. Genome Biol. 2013;14:R36. doi: 10.1186/gb-2013-14-4-r36. [DOI] [PMC free article] [PubMed] [Google Scholar]
- 27.Trapnell C, Williams BA, Pertea G, Mortazavi A, Kwan G, van Baren MJ, et al. Transcript assembly and quantification by RNA-Seq reveals unannotated transcripts and isoform switching during cell differentiation. Nat Biotechnol. 2010;28:511–5. doi: 10.1038/nbt.1621. [DOI] [PMC free article] [PubMed] [Google Scholar]
- 28.Saeed AI, Bhagabati NK, Braisted JC, Liang W, Sharov V, Howe EA, et al. TM4 microarray software suite. Meth. Enzymol. 2006;411:134–93. doi: 10.1016/S0076-6879(06)11009-5. [DOI] [PubMed] [Google Scholar]
- 29.Wu C, Orozco C, Boyer J, Leglise M, Goodale J, Batalov S, et al. BioGPS: an extensible and customizable portal for querying and organizing gene annotation resources. Genome Biol. 2009;10:R130. doi: 10.1186/gb-2009-10-11-r130. [DOI] [PMC free article] [PubMed] [Google Scholar]
- 30.Smyth GK. Linear models and empirical bayes methods for assessing differential expression in microarray experiments. Stat Appl Genet Mol Biol. 2004;3:Article3. doi: 10.2202/1544-6115.1027. [DOI] [PubMed] [Google Scholar]
- 31.Saldanha AJ. Java Treeview--extensible visualization of microarray data. Bioinformatics. 2004;20:3246–8. doi: 10.1093/bioinformatics/bth349. [DOI] [PubMed] [Google Scholar]
- 32.He HH, Meyer CA, Hu SS, Chen M-W, Zang C, Liu Y, et al. Refined DNase-seq protocol and data analysis reveals intrinsic bias in transcription factor footprint identification. Nature Methods. 2014;11:73–8. doi: 10.1038/nmeth.2762. [DOI] [PMC free article] [PubMed] [Google Scholar]