Abstract
A simple and selective liquid chromatography mass spectrometry method for determination of xanthotoxin in rat plasma and various tissues for pharmacokinetic was developed. Chromatographic separation was achieved on a C18 (2.1 mm × 150 mm, 5 μm) column with acetonitrile-0.1% formic acid in water as mobile phase with gradient elution. An electrospray ionization source was applied and operated in positive ion mode; selective ion monitoring (SIM) mode was used for quantification using target fragment ions m/z 217 for xanthotoxin and m/z 326 for the internal standard. The resulting calibration curves offered satisfactory linearity (R2 > 0.99) within the test range. Mean recoveries of xanthotoxin in rat plasma were in the range of 79.9%-84.6%. RSD of intra-day and inter-day precision were both < 14%. The accuracy of the method ranged from 87.5% to 109.8%. The assay was successfully applied to the pharmacokinetics and tissue distribution model studies of xanthotoxin in rats. The oral bioavailability of xanthotoxin was 73.2% in rats.
Keywords: Xanthotoxin, pharmacokinetics, tissue distribution, determination
Introduction
Xanthotoxin, a naturally occurring furanocoumarin, well known photoreactive complexes [1]. This drug is used in combination with ultraviolet light in a process known as photochemotherapy to treat vitilgo, a disease in which skin color is lost [2]. It is also used for antineoplastic effects and for treating certain skin disorders, including alopecia, cutaneous T-cell lymphoma, excema, lichen planus, mycosis fungoides and psoriasis. In addition, a recent report has found that xanthotoxin inhibits the enzyme, CYP2A6, which is responsible for the metabolism of nicotine [3].
A number of analytical methods have been developed to determine the xanthotoxin in plasma, urine and serum including high-performance liquid chromatography with ultraviolet detection (HPLC-UV) [4-7] or fluorometric detection (HPLC-FD) [8], high-performance liquid chromatography with mass detection (LC-MS) [9-11], thin layer chromatogra-phy (TLC) method [12], gas chromatography (GC) [13] and gas chromatography-mass spectrometry (GC-MS) [14].
So far, the information of the tissue distribution of xanthotoxin is still lacking. In the present study, an LC-ESI-MS method was established for the determination of xanthotoxin in rat biological samples and was successfully applied to the pharmacokinetic and tissue distribution. The chemical structures of xanthotoxin the internal standard (IS) midazolam are shown in Figure 1.
Figure 1.
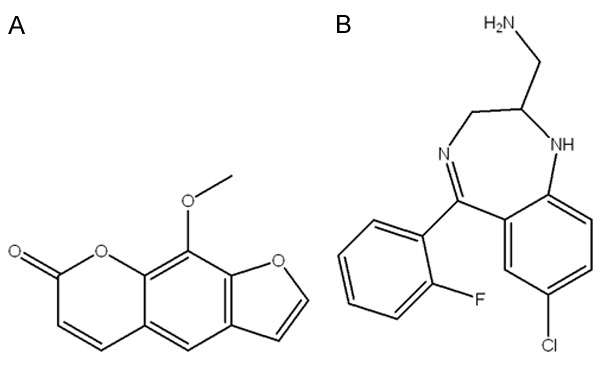
Chemical structure of xanthotoxin (A) and midazolam (IS, B).
Experimental
Chemicals and reagents
Xanthotoxin (purity > 98%) was purchased from the Chengdu Mansite Pharmaceutical CO. LTD. (Chengdu, China). Midazolam (IS, purity > 98%, Figure 1B) was purchased from the National Institute for Control of Pharmaceutical and Biological Products (Beijing, China). LC-grade acetonitrile and methanol were purchased from Merck Company (Darmstadt, Germany). Ultra-pure water was prepared by Millipore Milli-Q purification system (Bedford, MA, USA). Male Sprague-Dawley rats (200-220 g) were obtained from Laboratory Animal Center of Wenzhou Medical University (Wenzhou, China). The animal license number was SCXK (Shanghai) 2012-0005.
Instrumentation and conditions
All analysis was performed with a 1200 Series liquid chromatograph (Agilent Technologies, Waldbronn, Germany) and a Bruker Esquire HCT ion-trap mass spectrometer (Bruker Technologies, Bremen, Germany) equipped with an electrospray ion source and controlled by ChemStation software (Version B.01.03 [204], Agilent Technologies, Waldbronn, Germany). All centrifugation were performed on an Eppendorf 5415R Refrigerated Microcen-trifuge (Eppendorf, Germany).
Chromatographic separation was achieved on an Agilent Zorbax SB-C18 (2.1 mm × 150 mm, 5 μm) column at 40°C, with acetonitrile-0.1% formic acid as mobile phase. The flow rate was 0.4 mL/min. A gradient elution programme was conducted for chromatographic separation with mobile phase A (0.1% formic acid), and mobile phase B (acetonitrile) as follows: 0-4.0 min (10-80% B), 4.0-8.0 min (80% B), 8.0-9.0 min (80-10% B), 9.0-13.0 min (10% B).
Drying gas flow and nebuliser pressure was set at 6 L/min and 20 psi. Dry gas temperature and capillary voltage of the system were adjusted at 350°C and 2500 V. LC-MS was performed with SIM mode using target ions at m/z 217 for xanthotoxin and m/z 326 for midazolam (IS), in positive ion electrospray ionization interface, respectively.
Calibration standards and quality control samples
The stock solutions of xanthotoxin (1.0 mg/mL) and midazolam (IS) (100 µg/mL) were prepared in methanol-water (50:50), respectively. Working solutions for calibration and controls were prepared from the stock solution by dilution using acetonitrile. The 2.0 µg/mL working standard solution of IS was prepared from the IS stock solution by dilution using methanol. All of the solutions were stored at 4°C and were brought to room temperature before use.
Series of standard working solutions (20, 50, 100, 200, 500, 2000 and 5000 ng/mL) were prepared by spiking 95 µL blank biological matrix with 5 µL xanthotoxin working solutions of different concentrations. Quality-control (QC) samples at three levels (low: 40 ng/mL; medium: 1600 ng/mL; high: 4200 ng/mL) were also independently prepared in the same way. The calibration working solutions and QC samples were freshly prepared before use.
Sample preparation
In the present study, a conventional liquid-liquid extraction (LLE) method was applied to extract xanthotoxin and IS from biological samples (plasma, tissue homogenates). Biological samples were taken out from -20°C storage and thawed at room temperature. In a 1.5 mL centrifuge tube, an aliquot of 10 µL of the IS working solution (2.0 µg/mL) was added to 100 µL of biological sample followed by the addition of 1.0 mL ethyl acetate. The tubes were vortex mixed for 1.0 min. After centrifugation at 5000 g for 10 min, the supernatant organic layer was transferred into a 2 mL glass tube and dried under nitrogen stream at 40°C. The dried residue was reconstituted in 150 μL of methanol-water (50:50, v/v) and a 5 μL aliquot of this was injected into LC-MS.
Method validation
The method was validated for selectivity, linearity, accuracy, precision, recovery and stability according to the guidelines set by the United States Food and Drug Administration (FDA) and European Medicines Agency (EMA). Validation runs were conducted on three consecutive days.
The selectivity of the method was determined by measuring the level of interfering components in six individual sources of blank biological matrix.
Calibration curves were constructed by analyzing spiked calibration samples on three separate days. Peak area ratios of xanthotoxin to IS were plotted against analyte concentrations, and standard curves were well fitted to the equations by linear regression with a weighting factor of the reciprocal of the concentration (1/x) in the concentration range of 20-5000 ng/mL. The lower limit of quantification (LLOQ) was defined as the lowest concentration on the calibration curves, which can be quantified reliably, with an acceptable accuracy (80-120%) and precision (< 20%).
Accuracy and precision were assessed by the determination of QC samples at three concentration levels in six replicates (40, 1600 and 4200 ng/mL) in three validation days. The precision was expressed by coefficient of variation (CV).
The recovery of xanthotoxin (A/B × 100%) was evaluated by comparing peak area of QC samples (A) with those of reference QC solutions reconstituted in blank plasma after extraction (B, n = 6). The recovery of the IS was determined in a same way.
To evaluate the matrix effect (B/C × 100%), blank rat plasma after extraction and then spiked with xanthotoxin at 40, 1600 and 4200 ng/mL (B). The corresponding peak areas were then compared to those of neat standard solutions at equivalent concentrations (C), and this peak area ratio was defined as the matrix effect. The matrix effect of IS was evaluated at the working concentration (200 ng/mL) in the same manner.
Carry-over was assessed following injection of a blank plasma sample immediately after 3 repeats of the upper limit of quantification (ULOQ) and the response was checked [15].
The stabilities of xanthotoxin in rat plasma were evaluated by analyzing three replicates of plasma samples at the concentrations of 40 and 4200 ng/mL, which were exposed to different conditions. These results were compared with those obtained for freshly prepared biological matrix samples. The short-term stability was determined after the exposure of the spiked samples at room temperature for 2 h, and the ready-to-inject samples (after extraction) in the HPLC autosampler at room temperature for 24 h. The freeze/thaw stability was evaluated after three complete freeze/thaw cycles (-20 to 25°C) on consecutive days. The long-term stability was assessed after storage of the standard spiked biological matrix samples at -20°C for 20 days. The stability of the IS (200 ng/mL) was evaluated in a same way.
Pharmacokinetic study
Eighteen male Sprague-Dawley (SD) rats (200-220 g) were obtained from Laboratory Animal Center of Wenzhou Medical University (Wenzhou, China) used to study the pharmacokinetics of xanthotoxin. All eighteen rats were housed at Laboratory Animal Center of Wenzhou Medical University. Twelve male SD rats were used for intravenous administration study, and another six were for oral administration study. All experimental procedures and protocols were reviewed and approved by the Animal Care and Use Committee of Wenzhou Medical University and were in accordance with the Guide for the Care and Use of Laboratory Animals. Diet was prohibited for 12 h before the experiment but water was freely available. Rats were anesthetized with 5% chloral hydrate before intravenous administration. Xanthotoxin was dissolved in water with little 0.1% HCl for oral and intravenous administration. Blood samples (0.3 mL) were collected from the tail vein into heparinized 1.5 mL polythene tubes at 0.0833, 0.25, 0.5, 0.75, 1, 1.5, 2, 3, 4, 6, 8, 12, 24 h after oral administration (singe dosage 15 mg/kg). The blood samples (0.3 mL) were collected at 0.0833, 0.25, 0.5, 0.75, 1, 1.5, 2, 3, 4, 6, 8, 12 h after intravenous (singe dosage 2 and 6 mg/kg) administration of xanthotoxin. The blank blood samples (0.3 mL) were collected before administration. The samples were immediately centrifuged at 3000 g for 10 min. The plasma obtained (100 µL) was stored at -20°C until analysis.
Tissue distribution model study
The tissue distribution model was developed by back-propagation artificial neural network (BP-ANN). Eighteen male SD rats (three rats per group) were oral administrated at a single dose of 20 mg/kg xanthotoxin. These twenty-one rats were euthanized by decapitation at 0.5, 1, 2, 3, 4, 6 and 8 h after dosing, respectively. Tissues including heart, liver, spleen, lung, kidney and brain were dissected and washed with saline, then were blotted by filter paper, and immediately stored at -20°C until analysis.
The concentration data of heart, liver, spleen, lung, kidney and brain were employed into BP-ANN and performed at Matlab R2011a. The input layer consist of five factors, the output data is one factor, such as the concentrations of liver, spleen, lung, kidney and brain were selected as the input data, then the output data were the concentrations of heart. The node numbers of hidden layer were based on the formula of m = √(n + I) + a, where m is the number of the nodes in the hidden layer, and n is the number of nodes in the input layer, l is the number of nodes in the output layer, a is a constant from 1 to 10, for more details refer to [16].
Calculation
Plasma xanthotoxin concentration versus time data for each rat was analyzed by DAS (Drug and statistics) software (Version 2.0, Wenzhou Medical University, China). The maximum plasma concentration (Cmax) was observed directly from the concentration-time curve. The area under the plasma concentration-time curve (AUC) was estimated by the trapezoidal rule. The mean residence time (MRT), the plasma clearance (CL), apparent volume of distribution (V), and the half-life (t1/2) were estimated using non-compartmental calculations performed with DAS software.
The absolute bioavailability (Fabs) is the dose-corrected area under curve (AUC) non-intravenous divided by AUC intravenous. The formula for calculating F for a drug administered by the oral route (po) is given below.
Fabs = 100 × (AUCpo × Doseiv)/(AUCiv × Dosepo)
Results
Method validation
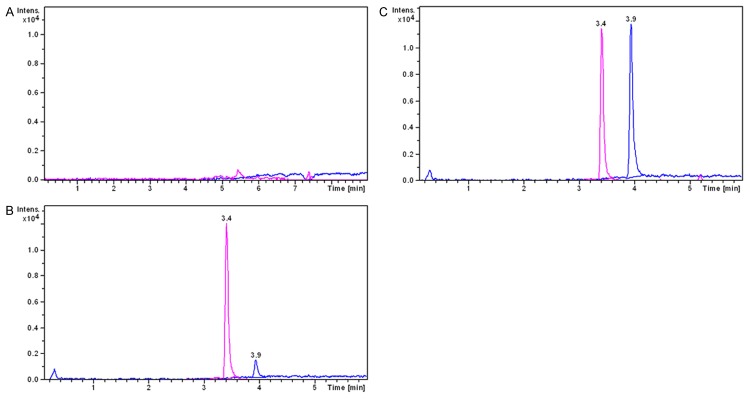
Figure 2 shows the typical chromatograms of a blank plasma sample, a blank plasma sample spiked with xanthotoxin and IS, and a plasma sample. No interfering endogenous substance was observed at the retention time of the analyte and IS.
Figure 2.
Representative LC-MS chromatograms of xanthotoxin (tR = 3.9 min) and midazolam (IS, tR = 3.4 min), (A) blank plasma; (B) blank plasma spiked with xanthotoxin (20 ng/mL) and IS (200 ng/mL); (C) a rat plasma sample 6 h after intravenous administration of single dosage 6 mg/kg xanthotoxin.
The linear regressions of the peak area ratios versus concentrations were fitted over the concentration range 20-5000 ng/mL for xanthotoxin in rat biological matrix. Typical equation of the calibration curve were listed in Table 1, where y represents the ratios of xanthotoxin peak area to that of IS and x represents the concentration.
Table 1.
Calibration curves, correlation coefficients and linear ranges of xanthotoxin in different matrices
| Matrix | Calibration curve | Correlation coefficient (R2) | Linear range (ng/mL) |
|---|---|---|---|
| Plasma | y = 0.00041 x + 0.01510 | 0.9960 | 20-5000 |
| Heart | y = 0.00019 x - 0.00843 | 0.9963 | 20-5000 |
| Liver | y = 0.00017 x - 0.00835 | 0.9982 | 20-5000 |
| Spleen | y = 0.00016 x - 0.00378 | 0.9986 | 20-5000 |
| Lung | y = 0.00018 x - 0.00214 | 0.9984 | 20-5000 |
| Kidney | y = 0.00021 x - 0.00193 | 0.9964 | 20-5000 |
| Brain | y = 0.00028 x - 0.02161 | 0.9974 | 20-5000 |
The precision of the method was determined by calculating RSD for QCs at three concentration levels over three validation days. Intra-day precision was 11% or less and the inter-day precision was 14% or less at each QC level. The accuracy of the method ranged from 87.5% to 109.8% at each QC level.
Mean recoveries of xanthotoxin were better than 79.9%. Assay performance data was presented in Table 2. The matrix effect for xanthotoxin at concentrations of 40, 1600 and 4200 ng/mL in plasma were measured to be 102.6±7.1, 99.1±3.7 and 105.1±3.6% (n = 6), respectively. As a result, matrix effect from plasma was negligible in this method.
Table 2.
Precision, accuracy and recovery for xanthotoxin of QC sample in rat plasma (n = 6)
| Concentration (ng/mL) | RSD (%) | Accuracy (%) | Recovery (%) | ||
|---|---|---|---|---|---|
|
| |||||
| Intra-day | Inter-day | Intra-day | Inter-day | ||
| 40 | 9.6 | 13.2 | 97.5 | 109.8 | 79.9±5.3 |
| 1600 | 10.8 | 4.1 | 104.3 | 87.5 | 84.6±3.9 |
| 4200 | 3.4 | 12.1 | 100.1 | 101.9 | 80.3±2.6 |
None of the analytes showed any significant peak (≥ 20% of the LLOQ and 5% of the IS) in blank samples injected after the ULOQ samples. Adding 4 extra minutes to the end of the gradient elution effectively washed the system between samples thereby eliminating carry-over [15].
The auto-sampler, room temperature, freeze-thaw and long-term (30 days) stability results indicated that the analyte was stable under the storage conditions described above since the bias in concentrations were within ±14% of their nominal values, and the established method was suitable for the pharmacokinetics and tissue distribution studies.
Application to pharmacokinetics
The mean plasma concentration-time curve after oral (20 mg/kg) and intravenous (2 and 6 mg/kg) administration of xanthotoxin was shown in Figure 3. The main pharmacokinetic parameters from non-compartment model analysis were summarized in Table 3. The bioavailability of xanthotoxin was 73.2%.
Figure 3.
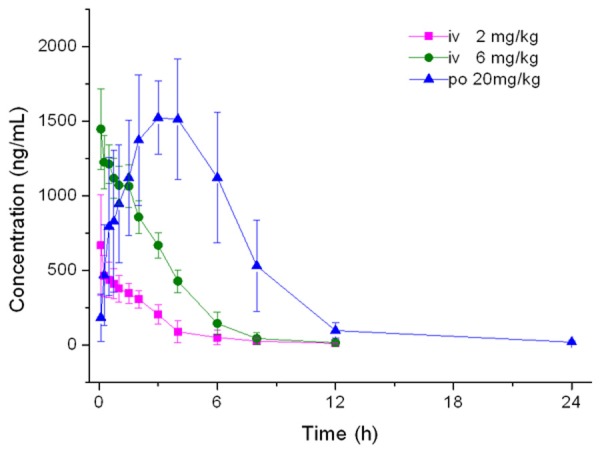
Mean plasma concentration time profile after oral and intravenous administration of xanthotoxin in rats.
Table 3.
The main pharmacokinetic parameters after oral and intravenous administration of xanthotoxin in rats from non-compartment model
| Parameters | Unit | Mean (± SD) | ||
|---|---|---|---|---|
|
| ||||
| po (20 mg/kg, n = 6) | iv (2 mg/kg, n = 6) | iv (6 mg/kg, n = 6) | ||
| AUC(0-12) | ng/mL*h | 10988.9±2225.7 | 1500.8±486.0 | 4414.2±410.8 |
| AUC(0-∞) | ng/mL*h | 11077.7±2247.4 | 1530.2±507.0 | 4438.3±411.8 |
| MRT(0-12) | h | 5.0±0.6 | 2.4±0.4 | 2.4±0.3 |
| MRT(0-∞) | h | 5.2±0.7 | 2.6±0.5 | 2.5±0.4 |
| t1/2 | h | 3.1±0.2 | 2.5±1.0 | 1.4±0.4 |
| tmax | h | 3.5±1.6 | ||
| CL | L/h/kg | 1.9±0.5 | 2.1±0.6 | 1.4±0.1 |
| V | L/kg | 8.4±2.5 | 7.4±3.4 | 2.7±0.8 |
| Cmax | ng/mL | 1716.8±364.2 | 681.6±318.3 | 1446.8±268.6 |
| Bioavailability | 73.2% | |||
Tissue distribution
Tissue distribution of xanthotoxin was investigated in rats following a single oral dose of corydaline (20 mg/kg), Figure 4.
Figure 4.
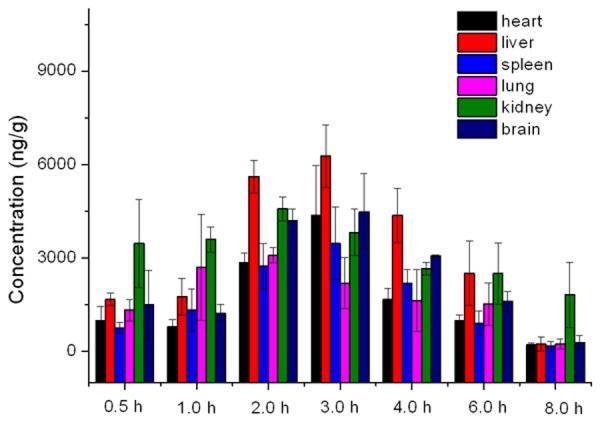
Tissue distribution in rats after a single oral administration of 20 mg/kg of xanthotoxin (n = 3).
The tissue distribution model was well performed within 200 epochs, the good fitness was indicated by following four values: mean square error (MSE), magnitude of the gradient, the number of validation checks, correlation coefficient (Table 4). The predicted and measured times-concentrations profiles of xanthotoxin in six tissues were shown in Figure 5.
Table 4.
The fitness index of tissue distribution BP-ANN model of xanthotoxin performed in rats
| Index | Heart | Liver | Spleen | Lung | Kidney | Brain |
|---|---|---|---|---|---|---|
| Mean squared error | 2.25 × 10⁻⁷ | 7.93 × 10⁻⁶ | 2.59 × 10⁻⁷ | 2.06 × 10⁻⁷ | 8.13 × 10⁻⁶ | 1.175 × 10⁻⁵ |
| The magnitude of the gradient | 1.49 × 10⁻³ | 1.13 × 10⁻² | 1.05 × 10⁻³ | 1.27 × 10⁻³ | 1.77 × 10⁻² | 7.06 × 10⁻⁴ |
| Validation checks | 0 | 0 | 0 | 0 | 0 | 0 |
| Correlation coefficient (R) | 1 | 1 | 1 | 1 | 1 | 0.9999 |
Figure 5.
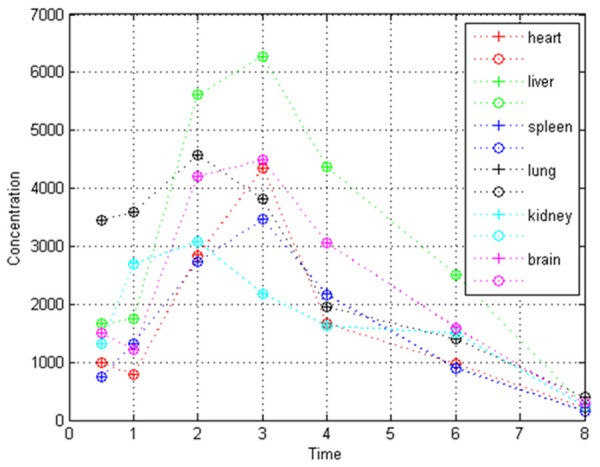
The predicted (+) and measured (o) times-concentrations profiles of xanthotoxin in rats based on the tissue distribution BP-ANN model.
Discussion
Electrospray ionization (ESI+) source exhibited more sensitivity and better reproducibility for xanthotoxin compared with an atmospheric pressure chemical ionization (APCI+) interface, and ESI+ was used in this work.
The liquid chromatographic conditions were developed to separate as many interfering compounds as possible from the analyte and IS [17-30]. Different columns, such as Zorbax SB-C18 (150 mm × 2.1 mm, 5 µm), Zorbax SB-C18 (50 mm × 2.1 mm, 3.5 µm) and Zorbax SB-C18 (100 mm × 2.1 mm, 3.5 µm) were compared for chromatographic separation. The Zorbax SB-C18 (150 mm × 2.1 mm, 5 µm) column demonstrated proper separation and better peak shape for xanthotoxin and IS than other columns. The mobile phase played a critical role in achieving good chromatographic behavior and appropriate ionization. Various combinations of methanol, acetonitrile, water and 0.1% formic acid in with water changed content of each component were investigated for the optimal mobile phase. The acetonitrile-0.1% formic acid in water was chosen as mobile phase because it could provide sharper peak shape and lower pump pressure.
The method was applied to a pharmacokinetics and tissue distribution study in rats. Tmax (h) and t1/2 were 3.5 and 3.1 h, respectively, consistent with the reported literature [9]. The level of xanthotoxin in liver was higher than other tissues. From Figure 4, it can be observed that the level of xanthotoxin in brain was close to that in heart, lung, kidney and spleen, showing that xanthotoxin effectively cross the blood-brain barrier. The results (Table 4) showed that the tissue distribution BP-ANN model achieved a high prediction accuracy in heart, liver, spleen, lung kidney and brain.
Conclusion
A simple and selective LC-MS method for determination of xanthotoxin in rat biological matrix was developed and validated over 20-5000 ng/mL. The LC-MS method successfully applied to a pharmacokinetics and tissue distribution model studies of xanthotoxin in rats. The bioavailability and tissue distribution of xanthotoxin is reported for the first time.
Acknowledgements
This study was supported by grants from the Youth Talent Program Foundation of The First Affiliated Hospital of Wenzhou Medical University (qnyc010 and qnyc043); Wenzhou Municipal Science and Technology Bureau (Y20140741).
Disclosure of conflict of interest
None.
References
- 1.Zic JA. The treatment of cutaneous T-cell lymphoma with photopheresis. Dermatol Ther. 2003;16:337–346. doi: 10.1111/j.1396-0296.2003.01646.x. [DOI] [PubMed] [Google Scholar]
- 2.McNeely W, Goa KL. 5-Methoxypsoralen. Drugs. 1998;56:667–690. doi: 10.2165/00003495-199856040-00015. [DOI] [PubMed] [Google Scholar]
- 3.Sellers EM, Kaplan HL, Tyndale RF. Inhibition of cytochrome P450 2A6 increases nicotine’s oral bioavailability and decreases smoking. Clin Pharmacol Ther St Louis. 2000;68:35–43. doi: 10.1067/mcp.2000.107651. [DOI] [PubMed] [Google Scholar]
- 4.Kucova D, Maryskova D, Davidkova P, Gasparic J. High-performance liquid chromatographic determination of methoxsalen in plasma after liquid-solid extraction. J Chromatogr. 1993;614:340–344. [PubMed] [Google Scholar]
- 5.Weng DX, Li TA. [Simultaneous determination of 5 active components in Fructus Cnidii by HPLC] . Zhongguo Zhong Yao Za Zhi. 2007;32:1883–1885. [PubMed] [Google Scholar]
- 6.Cardoso CA, Pires AE, Honda NK. A method for quantitative determination of furanocoumarins in capsules and tablets of phytochemical preparations. Chem Pharm Bull (Tokyo) 2006;54:442–447. doi: 10.1248/cpb.54.442. [DOI] [PubMed] [Google Scholar]
- 7.Guillaume Y, Andre C, Simon N, Gehin A, Guyon C, Thomassin M, Ismaili L, Aubin F, Nicod L. Chromatographic determination of the association constant between 8-methoxypsoralen and modified beta-cyclodextrin: protective effect of hydroxypropyl-beta-cyclodextrin on 8-methoxypsoralen toxicity in human keratinocytes. J Chromatogr B Analyt Technol Biomed Life Sci. 2003;798:217–222. doi: 10.1016/j.jchromb.2003.09.045. [DOI] [PubMed] [Google Scholar]
- 8.Wang LH, Tso M. Determination of 5-methoxypsoralen in human serum. J Pharm Biomed Anal. 2002;30:593–600. doi: 10.1016/s0731-7085(02)00331-x. [DOI] [PubMed] [Google Scholar]
- 9.Chang YX, Zhang QH, Li J, Zhang L, Guo XR, He J, Zhang P, Ma L, Deng YR, Zhang BL, Gao XM. Simultaneous determination of scopoletin, psoralen, bergapten, xanthotoxin, columbianetin acetate, imperatorin, osthole and isoimperatorin in rat plasma by LC-MS/MS for pharmacokinetic studies following oral administration of Radix Angelicae Pubescentis extract. J Pharm Biomed Anal. 2013;77:71–75. doi: 10.1016/j.jpba.2012.12.031. [DOI] [PubMed] [Google Scholar]
- 10.Yang W, Feng C, Kong D, Shi X, Cui Y, Liu M, Wang Q, Wang Y, Zhang L. Simultaneous and sensitive determination of xanthotoxin, psoralen, isoimpinellin and bergapten in rat plasma by liquid chromatography-electrospray ionization mass spectrometry. J Chromatogr B Analyt Technol Biomed Life Sci. 2010;878:575–582. doi: 10.1016/j.jchromb.2009.12.035. [DOI] [PubMed] [Google Scholar]
- 11.Brautigam L, Seegel M, Tegeder I, Schmidt H, Meier S, Podda M, Kaufmann R, Grundmann-Kollmann M, Geisslinger G. Determination of 8-methoxypsoralen in human plasma, and microdialysates using liquid chromatographytandem mass spectrometry. J Chromatogr B Analyt Technol Biomed Life Sci. 2003;798:223–229. doi: 10.1016/j.jchromb.2003.09.051. [DOI] [PubMed] [Google Scholar]
- 12.Shawl AS, Vishwapaul Thin-layer chromatographic-spectrophotometric determination of methoxsalen (xanthotoxin) in Ammi majus seed. Analyst. 1977;102:779–782. doi: 10.1039/an9770200779. [DOI] [PubMed] [Google Scholar]
- 13.Said SA. GLC determination of methoxsalen in human serum and urine. Pharmazie. 1982;37:557–558. [PubMed] [Google Scholar]
- 14.Huuskonen H, Koulu L, Wilen G. Quantitative determination of methoxsalen in human serum, suction blister fluid and epidermis by gas chromatography mass spectrometry. Photodermatol. 1984;1:137–140. [PubMed] [Google Scholar]
- 15.Williams JS, Donahue SH, Gao H, Brummel CL. Universal LC-MS method for minimized carryover in a discovery bioanalytical setting. Bioanalysis. 2012;4:1025–1037. doi: 10.4155/bio.12.76. [DOI] [PubMed] [Google Scholar]
- 16.Ma J, Cai J, Lin G, Chen H, Wang X, Wang X, Hu L. Development of LC-MS determination method and back-propagation ANN pharmacokinetic model of corynoxeine in rat. J Chromatogr B Analyt Technol Biomed Life Sci. 2014;959:10–15. doi: 10.1016/j.jchromb.2014.03.024. [DOI] [PubMed] [Google Scholar]
- 17.Wang X, Wang S, Lin F, Zhang Q, Chen H, Wang X, Wen C, Ma J, Hu L. Pharmacokinetics and tissue distribution model of cabozantinib in rat determined by UPLC-MS/MS. J Chromatogr B Analyt Technol Biomed Life Sci. 2015;983-984:125–131. doi: 10.1016/j.jchromb.2015.01.020. [DOI] [PubMed] [Google Scholar]
- 18.Wang S, Wu H, Huang X, Geng P, Wen C, Ma J, Zhou Y, Wang X. Determination of N-methylcytisine in rat plasma by UPLC-MS/MS and its application to pharmacokinetic study. J Chromatogr B Analyt Technol Biomed Life Sci. 2015;990:118–124. doi: 10.1016/j.jchromb.2015.03.025. [DOI] [PubMed] [Google Scholar]
- 19.Ma J, Wang S, Huang X, Geng P, Wen C, Zhou Y, Yu L, Wang X. Validated UPLC-MS/MS method for determination of hordenine in rat plasma and its application to pharmacokinetic study. J Pharm Biomed Anal. 2015;111:131–137. doi: 10.1016/j.jpba.2015.03.032. [DOI] [PubMed] [Google Scholar]
- 20.Zhang Q, Wen C, Xiang Z, Ma J, Wang X. Determination of CUDC-101 in rat plasma by liquid chromatography mass spectrometry and its application to a pharmacokinetic study. J Pharm Biomed Anal. 2014;90:134–138. doi: 10.1016/j.jpba.2013.11.031. [DOI] [PubMed] [Google Scholar]
- 21.Yang X, Zhang Z, Lin D, Wang X, Lin G. Determination of Phenacetin and Bupropion in Rat Plasma After Acute Hydrogen Sulfide Poisoning. Latin Am J Pharm. 2014;33:691–695. [Google Scholar]
- 22.Ma J, Zhang Q, Wang X. Liquid chromatography mass spectrometry determination of mocetinostat (MGCD0103) in rat plasma and its application to a pharmacokinetic study. Xenobiotica. 2014;44:849–854. doi: 10.3109/00498254.2014.897012. [DOI] [PubMed] [Google Scholar]
- 23.Ma J, Lin C, Wen C, Xiang Z, Yang X, Wang X. Determination of bicuculline in rat plasma by liquid chromatography mass spectrometry and its application in a pharmacokinetic study. J Chromatogr B Analyt Technol Biomed Life Sci. 2014;953-954:143–146. doi: 10.1016/j.jchromb.2014.02.006. [DOI] [PubMed] [Google Scholar]
- 24.Ma J, Ding X, Sun C, Lin C, An X, Lin G, Yang X, Wang X. Development and validation a liquid chromatography mass spectrometry for determination of solasodine in rat plasma and its application to a pharmacokinetic study. J Chromatogr B-Analyt Technol Biomed Life Sci. 2014;963:24–28. doi: 10.1016/j.jchromb.2014.05.031. [DOI] [PubMed] [Google Scholar]
- 25.Ma J, Cai J, Lin G, Chen H, Wang X, Wang X, Hu L. Development of LC-MS determination method and back-propagation ANN pharmacokinetic model of corynoxeine in rat. J Chromatogr B Analyt Technol Biomed Life Sci. 2014;959:10–15. doi: 10.1016/j.jchromb.2014.03.024. [DOI] [PubMed] [Google Scholar]
- 26.Zhang M, Chen X, Hu G, Pan J, Wang X. Simultaneous Determination of Tolbutamide and Hydroxytolbutamide in Rat Plasma After Acute Hydrogen Sulfide Poisoning by Liquid Chromatography-Mass Spectrometry. Latin Am J Pharm. 2013;32:1158–1163. [Google Scholar]
- 27.Wang X, Chen M, Wen C, Zhang Q, Ma J. Determination of chidamide in rat plasma by LC-MS and its application to pharmacokinetics study. Biomed Chromatogr. 2013;27:1801–1806. doi: 10.1002/bmc.3001. [DOI] [PubMed] [Google Scholar]
- 28.Wen C, Cai J, Lin C, Ma J, Wang X. Gradient elution liquid chromatography mass spectrometry determination of acetylcorynoline in rat plasma and its application to a pharmacokinetic study. Xenobiotica. 2014;44:743–748. doi: 10.3109/00498254.2014.887802. [DOI] [PubMed] [Google Scholar]
- 29.Wen C, Lin C, Cai X, Ma J, Wang X. Determination of sec-O-glucosylhamaudol in rat plasma by gradient elution liquid chromatography- mass spectrometry. J Chromatogr B Analyt Technol Biomed Life Sci. 2014;944:35–38. doi: 10.1016/j.jchromb.2013.11.001. [DOI] [PubMed] [Google Scholar]
- 30.Zhou Y, Wang S, Ding T, Chen M, Wang L, Wu M, Hu G, Lu X. Evaluation of the effect of apatinib (YN968D1) on cytochrome P450 enzymes with cocktail probe drugs in rats by UPLC-MS/MS. J Chromatogr B Analyt Technol Biomed Life Sci. 2014;973C:68–75. doi: 10.1016/j.jchromb.2014.10.013. [DOI] [PubMed] [Google Scholar]


