

Abstract
Super-resolution fluorescence microscopy is distinct among nanoscale imaging tools in its ability to image protein dynamics in living cells. Structured illumination microscopy (SIM) stands out in this regard because of its high speed and low illumination intensities, but typically offers only a twofold resolution gain. We extended the resolution of live-cell SIM through two approaches: ultrahigh numerical aperture SIM at 84-nanometer lateral resolution for more than 100 multicolor frames, and nonlinear SIM with patterned activation at 45- to 62-nanometer resolution for approximately 20 to 40 frames. We applied these approaches to image dynamics near the plasma membrane of spatially resolved assemblies of clathrin and caveolin, Rab5a in early endosomes, and a-actinin, often in relationship to cortical actin. In addition, we examined mitochondria, actin, and the Golgi apparatus dynamics in three dimensions.
Fluorescence microscopy continues to play a key role in elucidating structure and function of living systems, thanks to its ability to image specific proteins with single-molecule sensitivity, as well as its capacity to study in vivo dynamics in a minimally invasive manner. Its power has grown with the introduction of super-resolution (SR) techniques (1) that extend its diffraction-limited spatial resolution [~200 nm for green fluorescent protein (GFP)] by as much as an order of magnitude. However, although the SR imaging of fixed specimens, the most common modality, offers the highest resolution, it does so at the considerable risk of altering the very ultrastructure it hopes to reveal because of both the fixation process itself (fig. S1) (2) and the extremely high density of fluorescent markers required to achieve such resolution (3). Furthermore, with the advent of genetically encoded markers for electron microscopy (EM) (4, 5), the continued preeminence of SR microscopy for protein-specific structural imaging at the nanoscale is no longer assured.
A different situation emerges for in vivo imaging, in which EM is too destructive and fixation is not involved. However, although this would appear to be the ideal niche of SR microscopy, SR techniques such as localization microscopy (6, 7), stimulated emission depletion (STED) microscopy (8, 9), and reversible saturable optical fluorescence transitions (RESOLFT) microscopy (10, 11) place extraordinary demands on the photon budget, represented by the product of the number of fluorescent molecules in the specimen and the number of photons each can emit before bleaching irreversibly (fig. S2) (12). They also require specialized photoswitchable labels and excitation intensities of 103 to 108 W/cm2, which are orders of magnitude greater than the 0.1 W/cm2 under which life evolved (fig. S3). As a result, time-lapse measurements with these techniques rarely consist of more than a few frames, and phototoxic changes to cellular physiology can set in quickly even at the lower end of this range (movie S1). In addition, typical SR acquisition speeds of ~1 s to several minutes per frame are too slow to follow processes that move faster than ~1 to 50 nm/s without introducing motion-induced artifacts (fig. S4), whereas common resolution metrics such as the Nyquist criterion for labeling density (6, 7) or the width of an isolated feature (8–11) tend to substantially overestimate the true spatial resolution (figs. S5 and S6).
A notable exception is structured illumination microscopy (SIM), which in vivo (13–15) can image in multiple colors using conventional fluorescent labels as fast as 11 frames/s (13) at intensities of only 1 to 100 W/cm2. Its primary limitation is that its resolution in vivo has been limited to ~100 nm for GFP, or only twice beyond the diffraction limit. This has provided the motivation for the development of other in vivo–compatible SR methods, but to date, all suffer from substantial limitations as noted above.
Extending SIM resolution via high-numerical-aperture optics
We extended the resolution of live-cell SIM by two independent means. In the first, we used the higher numerical aperture (NA) afforded by a commercially available 1.7-NA objective to image at 84-nm resolution (for GFP) (fig. S7). Although the total internal reflection fluorescence (TIRF) condition at this NA confines observations to within ~50 to 200 nm of the basal plasma membrane (fig. S8), it also restricts the excitation to only a small fraction of the cellular volume, further reducing phototoxicity, eliminating out-of-focus background, and leaving unaffected a potential reservoir of cytosolic target molecules that might be recruited to the plasma membrane at later time points. With this approach, termed high-NA TIRF-SIM, we could image dynamic associations between proteins in a variety of systems at sub-100-nm resolution, often for 80 to 100 time points, including filamentous actin (mApple-F-tractin) and enhanced GFP (EGFP)–myosin IIA (Fig. 1, A and B; Movie 1; and fig. S9); mApple-f-Tractin and mEmerald-paxillin (Fig. 1, C and D, and movie S2); mEmerald-paxillin and mTagRFP-vinculin (RFP, red fluorescent protein) (Fig. 1, E and F; Movie 2; and fig. S10); mEmerald-clathrin light chain b (CLTB) and Alexa 568–tagged transferrin (fig. S11 and movie S3); and mEmerald-CLTB and mCherry-Lifeact (Fig. 2, E to G) (16). Acquisition times were typically less than 1 s per color per frame, although the time interval between frames was adjusted in each case in order to match the dynamics of interest and to give the cell time to recover from the effects of the excitation applied during the acquisition.
Fig. 1. High-speed live-cell imaging at 37°C of associations between proteins at sub-100-nm resolution.
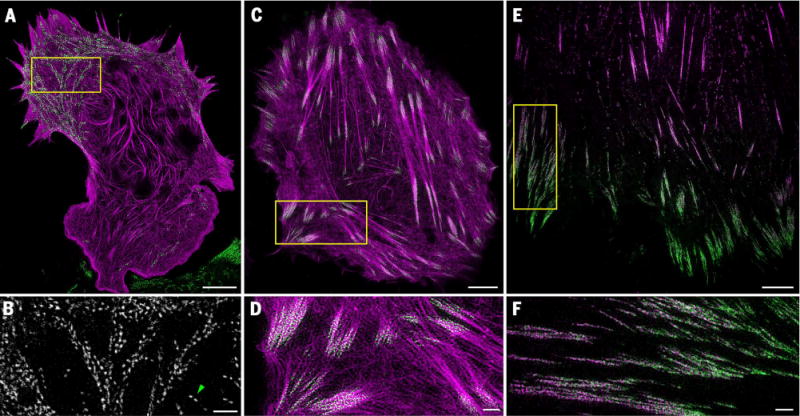
(A) Cytoskeletal proteins mApple-F-tractin (purple) and EGFP-myosin IIA (green) in a mouse embryonic fibroblast cell (Movie 1 and fig. S9). (B) Magnified view of the boxed region in (A), showing bipolar myosin IIA filaments with clearly resolved opposed head groups (for example, green arrowhead). (C) mApple-F-tractin (purple) and the focal adhesion protein mEmerald-paxillin (green) in a U2OS cell (movie S2). (D) Magnified view of the boxed region in (C), showing association of paxillin with smaller actin fibers fanning out from the ends of larger stress fiber cables. (E) Focal adhesion proteins mTagRFP-vinculin (purple) and mEmerald-paxillin (green) in a HFF-1 cell (Movie 2 and figs. S10 and S13). (F) Magnified view of the boxed region in (E), showing a gradient of increased paxillin concentration toward the cell periphery. Scale bars, 5 μm (A), (C), and (E); 1 μm (B), (D), and (F).
Fig. 2. Dynamics of clathrin-mediated endocytosis and the cortical actin cytoskeleton.
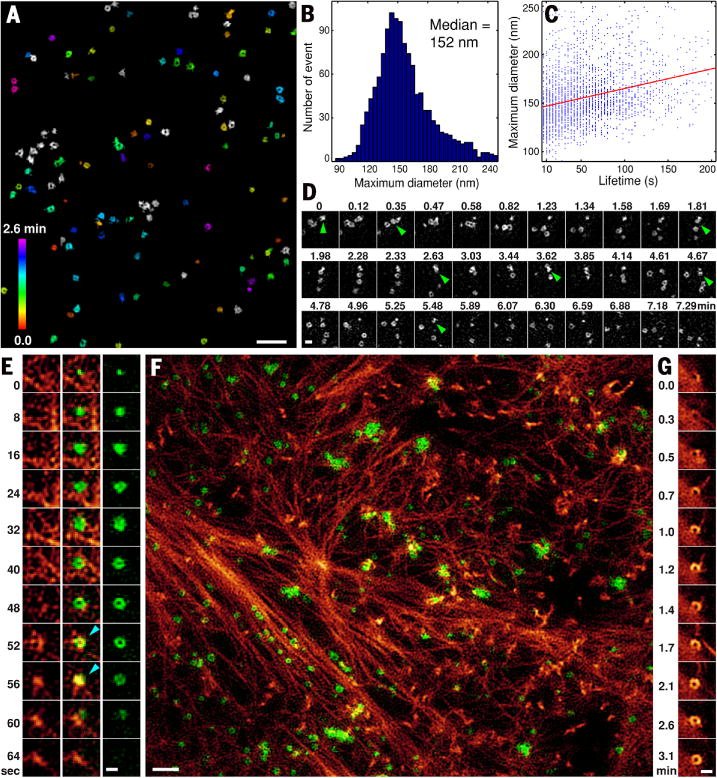
(A) CCPs, resolved as rings (fig. S14 and movie S4) and color-coded according to their age since initial formation, at one time point from a movie of CCP dynamics in a BSC-1 cell at 37°C stably expressing EGFP-clathrin light chain a (Movie 3). (B) Histogram of maximum diameter of each CCP over its lifetime. (C) Plot of CCP overall lifetime versus CCP maximum diameter. (D) Sequential production of multiple CCPs at a CCP-generating “hot spot,” identified with green arrowheads (Movie 4 and fig. S16). (E) Formation, growth, and dissolution of a single CCP (right) and its relationship to cortical f-actin (left) in a COS-7 cell at 37°C transfected with mEmerald-clathrin light chain b and mCherry-Lifeact. Light blue arrowheads mark time points at which f-actin associates with the CCP. (F) Individual CCPs and clathrin plaques (green) and cortical f-actin (red) at one time point during their evolution in a COS-7 cell (Movie 5, figs. S17 and S18, and movie S5). (G) Formation of a nanoscale ring of f-actin (fig. S17B). Scale bars, 1 mm (A) and (F); and 200 nm (D), (E), and (G).
In the case of mEmerald-paxillin and mTagRFP-vinculin, we found that both proteins expanded inward for those focal adhesions near the periphery of an HFF-1 cell (Movie 2 and fig. S12). mEmerald-paxillin dominated in the peripheral-facing end of these adhesions, whereas mTagRFP-vinculin increased in concentration toward the interior (Fig. 1, E and F, and fig. S10C). In contrast, for adhesions located far away from the periphery, mTagRFP-vinculin dominated (fig. S10A), and there was little change in the distribution of either protein over time. The resolution of our data was comparable with that demonstrated by means of live-cell localization microscopy (fig. S13) (6). However, we could image in two colors at intensities of only 30 to 100 W/cm2 in a total acquisition time of 1.67 s, versus a single color acquired at 1 kW/cm2 in 25 s in the localization case. This represents a 90 to 97% decrease in excitation intensity and a 15-fold increase in imaging speed.
For clathrin (Fig. 2), we saw that mature clathrin-coated pits (CCPs) were resolved as rings (fig. S14 and movie S4), presumably because the distal end of each resides outside the evanescent excitation field. When imaged at 37°C, CCPs large and stable enough to be resolved as a ring at one or more time points grew to a ~152-nm median maximum diameter (Fig. 2B) (17) in BSC-1 cells expressing EGFP-CLTA (Fig. 2A and fig. S14), with similar results in COS-7 cells expressing mEmerald-CLTB (Fig. 2F and fig. S15B), and persisted for on the order of 1 min (Movie 3 and fig. S15A). Linear regression revealed a positive correlation of 0.20 nm/s between maximum ring diameter and lifetime (Fig. 2C), which is consistent with previously observed correlations between lifetime and clathrin intensity or cargo size (18).
In BSC-1 cells, most CCPs were isolated at any given time, but the sites of their initiation did not follow a Poisson distribution (fig. S16). Instead, when the 1297 initiation events over the course of Movie 3 were binned into 0.32- by 0.32- μm sites, corresponding to a mean density of 0.29 events per site, 36.5% of all events occurred at sites of one or more additional events, compared with 13.5% expected if they were Poisson distributed at this mean density. Indeed, at 3.6% of the sites, five or more CCPs were generated sequentially (for example, one marked by green arrows at different time points in Fig. 2D), which would otherwise be a very rare event (0.0053%) assuming Poisson statistics. Although such “hot spots” have been observed previously (19, 20), in our case we found that these consisted of single, persistent, subdiffractive patches of clathrin, from which multiple CCPs emerged (Movie 4) like bubbles.
In COS-7 cells, mEmerald-CLTB appeared as both isolated rings and larger structures (Fig. 2F, Movie 5, figs. S17 and S18, and movie S5), the latter consisting of aggregates of rings (fig. S19). They may be related to clathrin plaques made of extended clathrin lattices of low curvature (20), also referred to elsewhere as flat clathrin lattices (21). Although they persisted far longer than isolated CCPs, individual rings would occasionally detach from these aggregates (fig. S19). In no instance did we observe large, homogenous patches of clathrin, as we might expect for the flat clathrin lattices common in EM images (22).
The role of actin in clathrin-mediated endocytosis in mammalian cells remains an area of some debate (17, 23–26). Our two-color imaging of COS-7 cells by means of high-NA TIRF-SIM revealed that all aggregates of mEmerald-CLTB rings were associated with mCherry-Lifeact over at least part of their areas at all times (fig. S19). In contrast, approximately equal populations of individual CCPs completed endocytosis either with (Fig. 2E and fig. S20, A and B) or without (fig. S20, C and D) recruitment of Lifeact in the final five frames (20 s) before internalization of the pit. In both cases, histograms of CCP lifetimes were well described by single exponential fits, indicating constant probabilities of internalization per unit time (fig. S15A). The 1/e lifetimes of 56.4 ± 3.0 s for the Lifeact-associated CCPs and 67.2 ± 1.9 s for CCPs without Lifeact indicate that actin, when present, indeed increases the internalization probability. Consistent with this, the median maximum clathrin ring diameter for rings persisting over at least five frames was slightly smaller with than without associated Lifeact (160 versus 168 nm) (fig. S15B).
Lifeact associated with CCPs usually approached in a wave or filament (Fig. 2E and fig. S20A). We also observed rings of Lifeact (COS-7 cells) (Fig. 2G and fig. S21, C and D) or F-tractin (U2OS cell) (fig. S21, A and B) similar in size to the clathrin ones and having lifetimes of several minutes (fig. S17B). However, Lifeact rings were not as numerous as clathrin ones and were coincident with them in only a few instances (fig. S22). Although they might be associated with other forms of clathrin-independent endocytosis, their role remains unclear.
Live-cell nonlinear SIM via patterned activation of photoswitchable fluorophores
To achieve even higher resolution than that of high-NA TIRF-SIM, we turned to nonlinear SIM (NL-SIM). The nonlinearity inherent in either the patterned saturation of fluorescence excitation at high intensity (27, 28) or the patterned depletion of photoswitchable fluorophores (fig. S23) (29) introduces additional harmonics H, which permit resolution extension at wavelength λ via SIM to ~λ/[2NA(H+1)] with H ≥ 2, compared with H = 1 for the traditional linear form of SIM and H = 0 for diffraction-limited widefield imaging with uniform illumination (fig. S24, A and B). Resolution of ~50 nm has been demonstrated with both approaches, although not on living cells; saturated excitation was used to image densely labeled fluorescent beads at the likely phototoxic peak intensity of 8 MW/cm2 (28), whereas saturated depletion (SD) imaged single fixed cells at 945 s/frame (29)—far too slow to follow most cellular processes.
SD provides the basis of resolution enhancement in STED and RESOLFT as well as SD NL-SIM. The degree of enhancement depends on the degree of saturation (figs. S23 and S25 and movie S6, part 3), defined in multiples of the saturation factor (SF) for which 1/e of the irradiated molecules remain in the original activated or excited state. However, high SFs are very photon inefficient; only a fraction of the photobleaching-dictated number of switching cycles for any given molecule then contributes useful signal (figs. S25 to S27). Furthermore, high SFs require high intensities and/or long exposures (fig. S28), neither of which is compatible with fast, noninvasive live-cell imaging.
We addressed these issues by using patterned activation (PA) followed with patterned excitation and readout of the green photoswitchable FP Skylan-NS (fig. S29 and movie S6, part 1) (30), rather than SD, to generate H = 2 harmonics yielding 62-nm resolution and subsecond acquisition times in TIRF for live cells (Fig. 3). This approach, termed PA NL-SIM, allowed us to achieve large amplitudes in both the first and second harmonics of the emission pattern (fig. S29, G and H), leading to SR images of high signal-to-noise ratio (SNR), even at low activation and excitation saturation factors SFact and SFexc obtained with low intensities and short exposures (table S1). Furthermore, by keeping SFact low, only a small fraction of the total molecular population needed to be activated for every raw image, and with H = 2, only N = (2H + 1)2 = 25 such raw images needed to be acquired to reconstruct each SIM image frame (fig. S30). Consequently, we could acquire substantially more frames at substantially higher SNR (fig. S26) in far less time (table S1) by means of PA NL-SIM (Movie 6) than SD NL-SIM (movie S7).
Fig. 3. Live-cell nonlinear structured illumination microscopy based on patterned photoactivation.

(A) Single time point from a movie of the evolution of cortical f-actin in a COS-7 cell at 23°C transfected with Skylan-NS-Lifeact, seen at 62-nm resolution (Movie 6, fig. S31, and movie S8). (B) Magnified view from a different cell at 37°C, comparing diffraction-limited TIRF microscopy (top left), TIRF with deconvolution (top right), TIRF-SIM (bottom left), and nonlinear TIRF-SIM with patterned activation (PA NL-SIM, bottom right) (movies S9 and S10). (C) Caveolae in a COS-7 cell at 23°C transfected with Skylan-NS-caveolin, comparing TIRF with deconvolution (top left, 220-nm resolution), TIRF SIM (top right, 97-nm resolution), PA NL-SIM (bottom left, 62-nm resolution), and saturated PA NL-SIM (bottom right, 45-nm resolution). (Insets) A single caveolae pit eventually resolved as a ring by saturated PA NL-SIM (Movie 7, figs. S34 to S37, and movie S13. (D) Diversity of caveolae ring diameters as seen by means of PA NL-SIM. (E) Larger rings that may represent surface-docked vesicles. (F) Clusters of caveolae reminiscent of clathrin plaques. (D) to (F) are from a different cell at 37°C (fig. S33 and movie S12). Scale bars, 3 μm (A); 1 μm (B); 200 nm (C); and 100 nm (D), (E), (F), and (C), inset.
PA NL-SIM of Skylan-NS-Lifeact (Fig. 3, A and B; Movie 6; and movies S8 to S10) in living COS-7 cells revealed considerably more detail than did TIRF-SIM (Fig. 3B) in dense, peripheral actin arcs and star-like junctions of single actin filaments. We were also able to resolve individual Lifeact rings once again, including rings too small to see clearly with high-NA TIRF-SIM (fig. S21, C and D, and movie S8). Furthermore, we could follow the dynamics of the Lifeact-decorated actin cytoskeleton for 30 image frames acquired in 1.2 s each (Movie 6). This is 1250× faster and used 20× lower intensity (100 W/cm2) than was required for an image of phalloidin-labeled actin at the ventral surface of a fixed BSC-1 cell obtained by means of dual-objective localization microscopy (31), yet the level of detail seen by the two methods was comparable (fig. S31), even though our 62-nm resolution was threefold coarser than that reported in the localization image.
We also used PA NL-SIM to image keratin (fig. S6 and movie S11) and caveolin (Fig. 3, C to F; Movie 7; figs. S32 and S33; and movie S12) in living COS-7 cells, each with Skylan-NS, at a resolution of 59 nm. In the latter case, this was sufficient to resolve numerous caveolae moving by less than their radii during the acquisition time as rings, which is consistent with their invaginated appearance by means of EM (32). Such rings were not observed at caveolae in a HeLa cell imaged with RESOLFT (fig. S34) (33), despite a similar reported resolution. Rings of Skylan-NS-caveolin were somewhat more abundant than CCPs (figs. S17 and S18), and although most were below 100 nm in size, their distribution was broader (Fig. 3D) than the 60 to 80 nm range observed with EM. However, some of the larger rings (Fig. 3E) may represent multiple caveolae clustered around surface-docked vesicles (34). Caveolae also tended to loosely cluster in long narrow ribbons, although we saw tighter aggregations of rings (Fig. 3F) as well, similar to those we saw in clathrin plaques (fig. S19).
Our time-lapse imaging showed that most caveolae moved only a fraction of their size during the acquisition time, although more met this condition when slowed (35) by operating at 23°C (Movie 7 and fig. S32) than when imaged at 37°C (fig. S33 and movie S12). The smaller, laterally mobile fraction in each case appeared as distorted, discontinuous rings or quasiperiodic patches (fig. S35). These morphologies are indicative of motion-induced artifacts and underscore the difficulty of live-cell SR imaging, by any method: Higher resolution must be accompanied by proportionally faster acquisition times to follow dynamic events of a given velocity, yet higher resolution also requires a quadratically increasing number of raw measurements for each two-dimensional (2D) image frame. Even the comparatively brief 0.35 s we needed to acquire N = 25 raw images for each PA NL-SIM image was insufficient to accurately depict caveolae moving by much more than our 59-nm resolution in this time.
Nevertheless, by further increasing SFact we were able to saturate the fraction of molecules in the activated state near the maxima of the patterned activation light (movie S6, part 2). Saturated PA NL-SIM generates an additional harmonic (H = 3) strong enough (fig. S29) to further extend the resolution to 45 nm (figs. S36 and S37) and allowed us to identify even smaller Skylan-NS-caveolin rings unresolvable without the extra harmonic (Fig. 3C). Using N = 35 rather than N = 49 raw images per frame, we balanced the resulting anisotropic resolution (fig. S30) against the needs for rapid acquisition (0.49 s/frame) and parsimonious use of the photon budget to image caveolin rings over 12 frames at 3 s intervals (movie S13).
Two-color live imaging via combined TIRF-SIM and PA NL-SIM
By combining linear SIM and PA NL-SIM, both in TIRF, we could study associations between fluorescent proteins, one conventional and one photoswtichable, in two colors at higher resolution than by means of linear TIRF-SIM alone. Images (Fig. 4, A to C, and figs. S38 and S39) and movies (Movie 8 and movie S14) of mCherry-Rab5a—a regulator of the formation, fusion, and transport of early endosomes (EEs) (36)—revealed irregularly shaped, dynamically remodeling patches of Rab5a (fig. S39, A and B) consistent with the tubular/vesicular architecture of EEs seen in EM (Fig. 4B) (37). Numerous patches also featured dark spots (fig. S39C) perhaps indicative of cargo or internal vacuoles depleted of Rab5a. Most patches moved randomly between successive 20-s time intervals at velocities slow enough to avoid motion artifacts during each 0.34-s acquisition. We also observed a subpopulation of slowly growing Skylan-NS-Lifeact–associated Rab5a patches that were constrained for minutes at a time (fig. S39D, arrows). At the other extreme, we occasionally observed streaks of Rab5a moving parallel to nearby actin filaments at velocities of 3 to 5 μm/s (Fig. 4C and fig. S39E). These may represent EEs actively transported along microtubules (38) parallel to the filaments.
Fig. 4. Combined TIRF-SIM and PA NL-SIM of protein-pair dynamics in living cells.

(A) Skylan-NS-Lifeact (orange, PA NL-SIM) and mCherry-Rab5a, a marker of early endosomes (green, TIRF-SIM) in a COS-7 cell at 23°C (Movie 8, figs. S38 and S39, and movie S14). (B) Comparison of EM images of early endosomes (37) with similarly shaped Rab5a patches seen in (A). (C) Magnified view at three successive time points, showing rapid transport of a Rab5a streak parallel to the cytoskeleton. (D) Skylan-NS-Lifeact (green, PA NL-SIM) and mCherry-α-actinin (purple, TIRF-SIM) in a COS-7 cell at 23°C (Movie 9, figs. S40 and S41, and movie S15). (E) Magnified view from (D), with Lifeact (top), α-actinin (middle), and overlay (bottom) showing paired association at focal adhesions and along the sides of large stress fibers. (F) Evolution of a membrane ruffle, showing α-actinin concentrated at the leading edge. Scale bars, 5 μm (A), (D); 200 nm (B); 1 μm (C) and (E); and 500 nm (F).
We also used PA NL-SIM and TIRF-SIM, respectively, to study the association of Skylan-NS-Lifeact with mCherry-α-actinin (Fig. 4, D to F, and fig. S40). Consistent with its role as an actin-bundling protein (39), in COS-7 cells we found α-actinin at the treadmilling edge of the lamellepodium and at the basal surface in both filopodia and the leading edges of growing membrane ruffles (Fig. 4F, Movie 9, and movie S15). We also observed concentrations of a-actinin along the sides (Fig. 4E) and at the branching ends of stress fibers that likely attach to cell-substrate adhesions (40). Last, α-actinin was present at dense junctions of Lifeact-decorated filaments, and Skylan-NS-Lifeact rings as described above were colocalized in every instance with a mCherry–α-actinin ring of similar size (fig. S41). Septins, another class of actin-bundling proteins, have been shown (41) to produce f-actin rings in vitro (albeit of larger size than here), so perhaps α-actinin not only aids in bundling actin filaments in nanometric rings but also contributes to their extreme curvature.
3D live-cell imaging with combined PA NL-SIM and lattice light sheet microscopy
Although the ~50- to 200-nm extent of the evanescent excitation field we used in the examples above eliminated out-of-focus background and confined potentially phototoxic exposure to a minute fraction of the cellular volume, it also limited our observations to this subvolume and severely restricted the total photon budget available for those targets unable to be replenished from the cytosol during the imaging interval.
To extend our observations to the entire cell, we turned to live-cell 3D-SIM (14, 15). Unfortunately, traditional 3D-SIM with linear, widefield excitation brings limitations of its own: It is slow (~20 s acquisition for whole adherent HeLa cells), limited to thin specimens (because of out-of-focus background), and requires high SNR for accurate image reconstruction. It is also potentially phototoxic and bleaches specimens rapidly because of continuous whole-cell illumination. These problems would all be greatly magnified in its direct extension to PA NL-SIM.
Thus, to apply PA NL-SIM to living cells in three dimensions (Fig. 5), we used lattice light sheet microscopy (42). In this technique, an excitation objective (fig. S42A) projects a thin sheet of light (fig. S42A, blue) through a specimen (fig. S42A, orange), and the fluorescence generated in the illuminated plane is collected by a detection objective and imaged onto a camera. Repeating this process plane-by-plane through the specimen produces a 3D image. Restriction of the light to the detection focal plane eliminates out-of-focus background, increases the z axis resolution and greatly reduces photobleaching and phototoxicity.
Fig. 5. Live-cell 3D PA NL-SIM via lattice light sheet microscopy.

(A) (Top) Membrane marker Skylan-NS-TOM20 showing mitochondria in a COS-7 cell at 23°C, color-coded for distance from the substrate. (Bottom) Evolution of individual mitochondria, showing fission and fusion events, the former preceded by mitochondrial constriction (Movie 10 and fig. S44). (B) Time-lapse distribution of Golgi-resident enzyme Skylan-NS-Mann II in a U2OS cell at 23°C, showing centralized cisternae surrounded by vesicles. White arrowheads indicate a docking vesicle, and red arrowheads highlight rapid export of a long tubular vesicle (movies S17 and S18). Scale bars, 5 μm (A), top; 1 μm (A), bottom; and 3 μm (B).
In cross-section, the light sheet has the 2D periodic structure of an optical lattice (fig. S42B). Sweeping the sheet back and forth along the x axis produces time-averaged uniform illumination, offering high speed and diffraction-limited xyz resolution of 230 by 230 by 370 nm, as seen in a volume-rendered image of the actin cytoskeleton (fig. S43A) and its corresponding overall optical transfer function (OTF) (fig. S43D). Stepping the sheet in x in five equal fractions of the lattice period and applying the algorithms of 3D-SIM to the resulting five raw images per plane extends the xyz resolution to 150 by 230 by 280 nm (fig. S43, B and E), but at the cost of at least 5× longer acquisition times (42).
To further extend the 3D resolution via PA NL-SIM, we first photoactivated target molecules fused to Skylan-NS using a hexagonal lattice light sheet of λ = 405 nm wavelength having H = 2 harmonics (fig. S43E). We then imaged the fluorescence from the activated region, exciting the fluorescence with a lattice light sheet of λ = 488 nm wavelength having the same hexagonal symmetry and period (fig. S42B, bottom) as the activation lattice. For activation well below saturation, the product of the activation and excitation patterns creates a fluorescence emission pattern within the specimen having H = 4 harmonics (fig. S43F). Thus, we stepped the sheet in x in 2H + 1 = 9 equal fractions of the lattice period while recording nine images. Repeating this process for every plane within the specimen, we then reconstructed a 3D PA NL-SIM volume-rendered image (fig. S43C), with resolution extended to 118 by 230 by 170 nm.
We used this approach to image mitochondria in COS-7 cells (Fig. 5A) as well as the actin cytoskeleton (fig. S43, A to C, and movie S16) and the Golgi apparatus (Fig. 5B) in U2OS cells, all at 23°C so as to simplify the overlap of the activation and excitation patterns. Time-lapse 3D images (Fig. 5A, bottom) and movies (Movie 10) of Skylan-NS–tagged translocase of outer mitochondrial membrane 20 (TOM20) revealed the migration, constriction before fission, and fusion of individual mitochondria (43, 44), each clearly resolved as a hollow tubular structure. The 3D volume rendering and the widths of mitochondrial membranes in individual xy orthoslices were both comparable with similar data from a fixed cell imaged with 3D localization microscopy (45) at a reported xyz resolution of ~20 by 20 by 60 nm (fig. S44).
A volume-rendered movie (movie S17) of the Golgi-resident enzyme Mannosidase II (MannII) tagged with Skylan-NS in a U2OS cell as seen looking into the cis-face from the nucleus showed Mann II concentrated in a hollow sphere of cisternae having a cis-facing void. Time-lapse 3D data (Fig. 5B and movie S18) color-coded for height showed the docking of small vesicles (Fig. 5B, white arrows) that may represent pre-Golgi intermediates (46) as well as the rapid export of Mann II in long, tubular post-Golgi carriers (Fig. 5B, red arrows) (47).
The volumetric resolution of 3D lattice light sheet PA NL-SIM at the 0.6-NA excitation and 1.1-NA detection we used here is comparable with the 105- by 105- by 369-nm xyz resolution of widefield 3D-SIM at 1.2 NA. However, the lattice approach has twofold higher axial resolution and fourfold better than traditional diffraction-limited microscopy. It is therefore better suited to problems in which its superior optical sectioning is essential, such as in resolving heterogeneities in nuclear architecture, distinguishing events occurring at the dorsal or ventral plasma membrane, or as above, tracking vesicles through the secretory pathway. Whole-cell acquisition times (70.5 and 32.7 s in Fig. 5, A and B, respectively) are slow compared with PA NL-SIM in TIRF but similar to widefield 3D-SIM. However, thanks to the oblique imaging geometry (fig. S42), restricted xy fields of view can be imaged at proportionally faster speed through the entire thickness of the cell.
Discussion
The above results provide but a brief glimpse of the biology that might be uncovered with the live-cell–compatible SR methods of high-NA TIRF-SIM and PA NL-SIM. We have measured and correlated the diameters and lifetimes of CCPs, observed at high resolution different forms of CCP initiation, and shown that CCP internalization is aided by actin filaments in about half of all cases. We have seen that caveolin localizes not only to the 60- to 80-nm invaginated caveloae common in EM images, but also to much larger ring-like structures, and have followed dynamic changes in the shapes of early endosomes. Last, we have observed the nanoscale remodeling of the actin cytoskeleton in relation to clathrin and Rab5a, as well as cytoskeletal-related proteins such as myosin IIA, a-actinin, and paxillin.
However, the above results also amply illustrate the trade-offs inherent in live SR imaging: With high-NA TIRF-SIM at 1.7 NA, we could acquire up to 200 image frames in <0.5 s each at intensities of 20 to 100 W/cm2 and a resolution of 84 nm (for GFP), whereas extending the resolution to 62 nm with PA NL-SIM restricted us to no more than 40 frames, and further extension to 45 nm with saturated PA NL-SIM required 490 W/cm2 and produced only 12 frames at useful SNR.
In short, even modest gains in resolution come at substantial cost in terms of the other metrics important for live-cell imaging. These tradeoffs are not specific to SIM. In fact, our extensions of SIM are far more compatible with live imaging than any other form of SR fluorescence microscopy of comparable resolution demonstrated to date. In part, this is because the OTF, which defines the degree to which different sample spatial frequencies (representing differently sized structures) are passed to the image, is far stronger in the 100-nm regime (fig. S24B) for high-NA TIRF-SIM at 1.7 NA than other linear methods such as confocal or image scanning microscopy (ISM) (48–50), and far stronger in the 50- to 100-nm regime (fig. S24C) for PA NL-SIM than other nonlinear methods such as STED (8, 9), point-scanning (PS) RESOLFT (10), or array-based wide-field (WF) RESOLFT (11). As a result, far fewer photons need to be collected (fig. S2), and far less light (fig. S3) needs to be applied to the specimen to see features in these regimes at acceptable SNR. Localization microscopy is also photon inefficient, in that the density of localized molecules is nearly always more limiting to the resolution than is the number of photons emitted per switching cycle, which dictates the localization precision. For example, simulations (12) based on the theoretical OTFs suggest that to resolve an 85-nm grating, PA NL-SIM requires ~80× fewer photons from the specimen per unit area than localization microscopy, ~200× fewer than WF-RESOLFT, and ~15× fewer than PS-RESOLFT or STED, each at a depletion saturation factor of SFdepletion = 10 (fig. S2).
Another reason for the greater compatibility of high-NA TIRF-SIM and PA NL-SIM with living cells is that they require much lower peak intensities of applied light. High resolution with STED or RESOLFT demands high factors of saturated depletion (fig. S25, A and C) that are wasteful of the photon budget (fig. S25, B and D) and require enormous intensities and/or long exposures for activation (fig. S45), depletion (fig. S28), and readout of the final signal (fig. S3). Localization microscopy also requires high intensities to achieve high photon emission and photoswitching rates from single molecules. For example, extrapolating from reported experimental values for live-cell imaging (table S1), the 0.8- to 3.5-W/cm2 activation intensity used over the 45- by 45-mm field of view in Fig. 3A in 1.2 s by means of PA NL-SIM is 960,000 times weaker than that which would be required to image the same area in the same acquisition time by means of PS-RESOLFT (10). Similarly, under the same parameters, the 100-W/cm2 read-out intensity used for PA NL-SIM shown in Fig. 3A is 200 times weaker than that which would be required for localization microscopy (6, 7) and 640,000 times less than PS-RESOLFT (10). Furthermore, STED and RESOLFT require an additional depletion step not needed in PA NL-SIM, which would further expose the sample to peak intensities of 807 MW/cm2 for STED (8), 1.7 MW/cm2 for PS-RESOLFT (10), and 3 kW/cm2 for WF-RESOLFT (11). Even over small image fields, nanoscopy with focused light such as PS-RESOLFT and STED uses intensities 105-to 1010-fold larger than that of terrestrial solar flux and is thus ill-equipped to study live-cell dynamics noninvasively.
Of course, despite these gains, no method of live-cell fluorescence microscopy, including high-NA TIRF-SIM and PA NL-SIM, can claim to be completely noninvasive, owing to possible photo-induced physiological changes, protein over-expression, and/or label-induced perturbations. For example, the gradual development of curved filopodia and membrane ruffles after the start of imaging are shown in Movies 5 and 6 and movie S2. These may reflect a response to the illumination, although we have also commonly seen such structures under initial conditions when imaging with diffraction-limited TIRF (fig. S46). Another caveat is that all the cells except BSC-1 in this work were transiently transfected, and hence, expression levels of the target proteins were uncontrolled. This could affect either morphologies, such as the sizes of Rab5a-labeled endosomes (Fig. 4, A to C, and figs. S38 and S39) (51), or dynamic phenotypes, such as the growth rate of membrane ruffles in mCherry–α-actinin–expressing cells (Fig. 4E, Movie 9, and movie S15). Although endogenous expression levels can be achieved with genome editing (52), even more light or longer exposures would be needed for cases in which these levels are lower than those used here. Thus, the biological findings described in this work should not be considered definitive. More extensive measurements across multiple cell lines with careful controls and targeted perturbation experiments will be needed to reach conclusive insights.
The lesson is that when addressing any biological question by means of live-cell imaging, it is prudent to start with less invasive, lower-resolution methods such as widefield, spinning disk confocal, or lattice light sheet microscopy and move progressively only as needed to more invasive, higher-resolution methods such as 3D-SIM, TIRF-SIM, PA NL-SIM, and last, localization microscopy. Seen from this perspective, the two extended-resolution methods of high-NA TIRF-SIM and PA NL-SIM we introduce here fill an important gap between the 100-nm limit of traditional SIM and the macromolecular level of localization microscopy. Together, they open the door to high-resolution, minimally invasive studies of dynamic processes, including endocytosis, exocytosis, signal transduction, protein diffusion, vesicle trafficking, viral entry, cytoskeletal remodeling, interactions with the extracellular matrix, and the evolution of lipid rafts.
Materials and methods
Optical path of the TIRF-SIM system
The schematic of TIRF-SIM system is presented in fig. S47A. The beam from a laser combiner equipped with 405 nm (250 mW, RPMC, Oxxius LBX-405-300-CIR-PP), 488 nm (500mW, Coherent, SAPPHIRE 488-500), and 560 nm (1W, MPB Communications, 2RU-VFL-P-1000-560-B1R) lasers is passed through an acousto-optic tunable filter (AOTF; AA Quanta Tech, AOTFnC-400.650-TN). The beam is then expanded to a 1/e2 diameter of 12 mm and sent to a phase-only modulator (13) consisting of a polarizing beam splitter, a achromatic half-wave plate (HWP; Bolder Vision Optik, BVO AHWP3), and a ferroelectric spatial light modulator (SLM; Forth Dimension Displays, SXGA-3DM). Light diffracted by the grating pattern displayed on SLM passes through a polarization rotator (15) consisting of a liquid crystal cell (LC; Meadowlark, SWIFT) and an achromatic quarter-wave plate (QWP; Bolder Vision Optik, BVO AQWP3), which rotates the linear polarization of the diffracted light so as to maintain the s-polarization necessary to maximize the pattern contrast for all pattern orientations. A mask consisting of a hollow barrel with slots for different pattern orientations (15) is driven by a galvanometric scanner (Cambridge Technology, 6230HB) to filter out all diffraction orders created by the binary and pixelated nature of the SLM except for the desired ±1 diffraction orders. These are then imaged at the back focal plane of the objective (Olympus APON 100XHOTIRF 1.7 NA for high-NA TIRF-SIM, Olympus, UAPON 100XOTIRF 1.49 NA for PA NL-SIM at 23°C, or Zeiss Plan-Apochromat 100X Oil-HI 1.57 NA for high-NA PA-NL-SIM at 37°C) as two spots at opposite sides of the pupil. After passage through the objective, the two beams intersect at the interface between the coverslip and the sample at an angle exceeding the critical angle for total internal reflection. An evanescent standing wave penetrating ~100 nm into the sample is thereby generated, consisting of a sinusoidal pattern of excitation intensity that is a low-pass filtered image of the SLM pattern. The period, orientation, and relative phase of this excitation pattern can be finely tuned by altering the corresponding pattern displayed on SLM. For each orientation and phase of the applied excitation pattern, the resulting fluorescence is collected by the objective, focused by a tube lens at an intermediate image plane, separated from excitation light by a dichroic mirror (Chroma, ZT405/488/560tpc_22.5deg) placed between two relay lenses, and reimaged onto a sCMOS camera (Hamamatsu, Orca Flash 4.0 v2 sCMOS), where the structured fluorescence emission pattern is recorded.
Calibration of pattern overlap for PA NL-SIM
In order to maximize the amplitudes of the nonlinear harmonics for PA NL-SIM to work efficiently, the sinusoidal patterns of 405 nm activation light and 488 nm excitation and deactivation light must be aligned to precisely overlap one another. As noted above, these patterns at the sample plane are created by displaying corresponding binary grating patterns on an SLM at a corresponding optically conjugate plane. In this case, the period ps at the specimen is related to the period pSLM at the SLM by
| (1) |
where M is the demagnification factor between the two conjugate planes and is dictated to be the focal lengths of the relay lenses between the two planes. Unfortunately, chromatic aberration leads to slightly different focal lengths for even achromatic relay lenses for different wavelengths of light. In particular, in our system, M405 and M488 vary by ~2%. Considering that the sinusoidal interference pattern is composed of hundreds of periods across our 45- by 45-μm2 field-of-view (FOV), even this 2% difference results in substantial drift in the relative phases of the 405-and 488-nm excitation patterns across the FOV (fig. S48, A to C), leading to spatially variable amplitudes for the nonlinear harmonics and corresponding spatially variable errors in the resulting SIM reconstructions.
A straightforward way to compensate for chromatic aberration and achieve identical periods ps,405 = ps,488 at the sample (fig. S47B) is to introduce a period difference ΔpSLM between the two corresponding patterns at the SLM (fig. S47C). In fact, in order to compensate completely and achieve well-overlapped 405- and 488-nm excitation patterns over the whole FOV, we need to measure two parameters: the initial period difference at the sample, , when pSLM is the same for both wavelengths; and the phase difference, , when ps is the same. Do to so, we used a sample consisting of a dense but submonolayer spread of green fluorescent beads excitable at both 405 and 488 nm and proceeded as follows.
Step 1
Keeping pSLM constant, we acquired five images each of the sample under 405- and 488-nm sinusoidal excitation, with the phase shifted by pSLM/5 for each image at a given wavelength. We then applied the structured illumination (SI) reconstruction algorithm (53) to each set of five images, from which and emerged as measured outputs. For a given period pSLM,488 used at the SLM for 488-nm excitation, the corresponding period pSLM,405 needed at the SLM for 405-nm excitation to produce the same period ps at the sample for both wavelengths is then given by
| (2) |
Step 2
After adjusting pSLM,405 and pSLM,488 to obtain the same period ps at the sample for both wavelengths, a constant phase offset exists between the two sinusoidal illumination patterns across the FOV (fig. S48, D and E). We measured the phase ϕ for each wavelength by applying the sinusoidal illumination for that wavelength and then recorded the position xn along the modulation direction and intensity In for each of N beads scattered across the FOV. We then fit the function I(x) = Imax[1 + sin(2πx/ps + ϕ)]/2 to this data to find ϕ (fig. S48F). A phase shift Δϕ = ϕ488 − ϕ405 was then applied the SLM pattern for the 405-nm illumination so as to bring it into phase with the 488-nm illumination at the specimen (figs. S48, G to I).
Step 3
Last, we confirmed that both the period and phase of the sinusoidal illumination patterns at the two wavelengths match across the entire FOV by remeasuring the periods ps,488, ps,405 and the phases ϕ488, ϕ405 as described above and confirming that they are identical.
SLM pattern generation
We generated the sinusoidal illumination patterns using a binary ferroelectric SLM (Forth Dimension Displays, SXGA-3DM) because it has the submillisecond switching times needed to acquire the nine (TIRF-SIM), 25 (PA NL-SIM), or more (saturated PA NL-SIM) raw images of different phase and orientation required to reconstruct a single SIM image in as fast as 100 to 400 ms. However, care must be taken to account for the finite pixel size of the SLM, especially considering that subpixel adjustment accuracy is necessary to achieve precise pattern overlap at 405 and 488 nm, as described in the previous section. The SLM pattern-generation algorithms used in previous work (13–15) do not provide such subpixel accuracy. Thus, in this work, we developed a new algorithm that matches the two pattern periods to 0.02% precision, leading to a phase error no greater than 1.8° over the 45-μm FOV.
In detail, a set of radial vectors {An} define the desired orientations of the grating pattern at the SLM. The angular orientation of this radial set relative to the x and y axes defined by pixel rows and columns of the SLM is chosen so that each vector is at least 4° away from either axis. This is essential to achieve subpixel precision in the adjustment of the period. For each orientation represented by An, we define a vector Bn that is orthogonal to An (fig. S49). Likewise, for every pixel of the SLM we define a pixel vector (such as C1 or C2 in fig. S49) from the point O at the intersection of An and Bn to the pixel. We then calculate F = [(C · B)modp]/p, the fraction of the period p by which the pixel extends beyond an integral number of periods on the SLM. For a pattern with a desired off fraction D per period (D = 0.5 in 2D SIM), the pixel is set to 0 if F < D and set to 1 otherwise. Last, to define the pixel patterns required for the other N – 1 phases of the illumination for a given orientation, the point O is translated along Bn in steps of p/N, and this process is repeated with the new vector C for each pixel. Unlike the pixel assignment algorithm used previously for SIM (15), this approach does not rely on unit-cell repetition and therefore does not succumb to error accumulation over the entire span of the SLM.
Lattice light sheet PA NL-SIM system
To extend PA NL-SIM to three dimensions, it is essential to minimize out-of-focus fluorescence emission that can cause the shot noise in the DC harmonic to completely overwhelm the weak signals in the nonlinear harmonics. To accomplish this, we turned to the SIM mode of lattice light sheet microscopy (42). Just as in the case of 2D-SIM, and for the same reasons, we choose to introduce the nonlinear harmonics through patterned activation of Skylan-NS. The excitation objective (Special Optics, 0.65 NA, 3.74 mm WD) is placed perpendicular to the detection objective (Nikon, CFI Apo LWD 25XW, 1.1 NA, 2 mm WD) to confine the illumination to the proximity of the latter’s focal plane (fig. S42A). The lattice pattern projected on the SLM (Forth Dimension Displays, SXGA-3DM) is imaged onto the focal plane of the excitation objective, after the excitation is first spatially filtered by an annular mask (Photo-Science) and relayed by a pair of galvanometers (Cambridge Technology, 6215H) that phase step the pattern in the x direction and scan the light sheet in z. Also as in 2D PA NL-SIM, we match the periods and phases of the 405- and 488-nm lattices to exactly match by measuring their excitation profiles across the FOV using fluorescent beads (fig. S42B) and adjusting accordingly. The fluorescence emission is collected by the detection objective and imaged by a tube lens onto a sCMOS camera (Hamamatsu Orca Flash 4.0 v2). A 3D image is formed by repeating this process as the sample is translated through the light sheet with a piezoelectric stage (Physik Instrumente, P-621.1CD) along an axis s in the plane of the cover slip, and a 3D super-resolution NL-SIM image is reconstructed as described below.
Data acquisition
High-NA TIRF SIM
All high-NA TIRF-SIM images were acquired with the Olympus 1.7-NA objective under the physiological conditions of 37°C and 5% CO2. At each time point, we acquired three raw images at successive phase steps of 0, 1/3, and 2/3 of the illumination period. We then repeated this process with the standing wave excitation pattern rotated ±120° with respect to the first orientation, for a total of nine raw images. The phase stepping and pattern rotation were accomplished by rotating or translating the binary grating pattern displayed on the SLM. For multicolor imaging, we acquired nine raw images at each excitation wavelength before moving to the next and then repeated this series at successive time points. We could adjust the excitation NA for each wavelength by changing the period of the grating pattern at the SLM. This allowed us to control penetration depth of the evanescent wave (fig. S8) in order to balance the number of excitable fluorescent molecules against the background fluorescence and possible physiological effects of the excitation.
PA NL-SIM and saturated PA NL-SIM
The high refractive index immersion oil required for the Olympus 1.7-NA objective strongly absorbs 405-nm light, leading to a substantial reduction in the modulation depth we could achieve in the activation pattern at this wavelength. Consequently, for NL-SIM we first turned to the Olympus 1.49-NA TIRF objective and imaged at room temperature (23°C) with L15 medium, without phenol red having 10% fetal bovine serum (Life Technologies). With this objective, we were able to achieve high modulation contrast while stably and precisely overlapping the 405- and 488-nm standing waves over the whole FOV. An excitation NA of 1.44 was used for both 488- and 560-nm light in this case, leading to 62-nm resolution for PA NL-SIM when using green-emitting FPs. Recently, however, we found that the high refractive index immersion oil used for the Zeiss 1.57-NA objective did not absorb 405-nm light strongly and therefore could be used to maintain precisely overlapped 405- and 488-nm standing waves with high modulation contrast at 37°C and 5% CO2. The excitation NA in this case was 1.52 for 488-nm light, leading to 59-nm resolution for PA NL-SIM when using green-emitting FPs.
The exposure procedure for a single phase step in NL-SIM consists of (i) 405-nm patterned illumination for 1 ms to activate the fluorescent molecules; (ii) 488-nm patterned illumination for 5 to ~30 ms to read-out the activated molecules; and (iii) 488-nm uniform illumination for 2 to ~10 ms to read-out the remaining activated molecules and return the sample back to the original unactivated state. We collected the fluorescence from both steps (ii) and (iii) to reconstruct the SR image. Depending on the number of modulation harmonics H of non-negligible amplitude in the image (H = 2 for PA-NL-SIM and H = 3 or possibly more for saturated PA NL-SIM), we repeated this sequence for 2H + 1 raw images at each of 2H + 1 angular orientations equally spaced around 360° for a total of (2H + 1)2 raw images at each NL-SIM time point. An exception was saturated PA-NL-SIM, for which to reduce the acquisition time, we often used only five orientations rather than seven.
In two-color imaging combining linear TIRF-SIM and PA NL-SIM (Fig. 4), at each time point we acquired the PA NL-SIM image as discussed above. However, we acquired the TIRF-SIM image with five instead of three orientations (15 raw images for the TIRF-SIM channel at every time point) in order to match the orientations of the five-slot, galvanometer-driven barrel mask used to pick out the desired diffraction orders for the PA NL-SIM acquisition.
3D PA NL-SIM with lattice light sheet microscopy
Here, we used a hexagonal lattice having a period large enough to contain two harmonics for each of the 405-nm activation and the 488-nm excitation (42)—one harmonic just below the Abbe limit of the 0.65-NA excitation objective, and the other at twice this period. The product of these patterns created a fluorescence emission pattern containing H = 4 harmonics (fig. S43F). However, with a single excitation objective, we were limited to producing this pattern at only one orientation. Therefore, at each plane of the 3D stack, we acquired 2H + 1 = 9 images, resulting in improved resolution (Fig. 5) in both the lateral and axial directions of the pattern.
Reconstruction of SIM images
The raw image frames with patterned excitation were processed and reconstructed into the super-resolved images by means of a previously described algorithm (53). In brief, for each pattern orientation with H modulation harmonics, 2H + 1 raw images are collected and Fourier transformed into 2H + 1 information components. These components are assembled by initially translating each in Fourier space by a distance equal to the amplitude of the illumination pattern vector nk0, where k0 is the spatial frequency of the illumination pattern and n = −H to H. The pattern vector of each information component is then fine-tuned by finding the vector that maximizes the complex cross-correlation in the overlap region between successive components. The modulation amplitude of the harmonic and its starting phase are found through complex linear regression. In line with previous work (28), the modulation amplitudes for the highest harmonics are generally too low for this empirical approach to work well, so for these, the theoretical values of their complex amplitudes are used. After fine-tuning the positions and complex amplitudes of the information components in the overlap regions, a generalized Wiener filter is applied to this expanded transfer function to balance the amplitudes of the various spatial frequencies against the underlying noise. Next, an apodization function is applied to minimize ringing artifacts when the result is Fourier-transformed back to real space. However, rather than the triangle apodization A(k) = 1 − k/kmax normally used (53), we applied a γ apodization A(k) = 1 − (k/kmax)γ, usually with γ = 0.4, so that the higher spatial frequencies are not suppressed more than necessary. Furthermore, we strictly followed the azimuthally dependent support kmax(θ) of the expanded OTF (figs. S7 and S30) to define the endpoint of the apodization function. This provides additional suppression of ringing artifacts. For the time series data, we independently implement this reconstruction process for each time point.
Cell culture, transfection, staining, and fixation
BSC-1, COS-7, U2OS, and mouse embryonic fibroblast (MEF) cells (American Type Culture Collection) were grown to ~60 to 80% confluency in Dulbecco’s modified eagle medium (DMEM) with high glucose and no phenol red supplemented with 15% fetal bovine serum (Life Technologies). BSC-1 cells stably expressed EGFP-CLTA. Other cells were transiently transfected with an Amaxa Nucleofector 96-well shuttle system (Lonza) with 1 μg DNA per 400,000 cells with nucleofection solution and a program optimized for each cell line per the manufactures instructions. Before imaging, 25-mm or 5-mm coverslips were coated with 10 μg/ml fibronection (Millipore, FC010) for 24 hours before plating transfected cells. Imaging was performed in DMEM with HEPES if there is no CO2 control containing no phenol red at temperatures specifically stated in each case.
In two-color imaging of CCPs and transferrin receptors (TfRs) by means of high-NA TIRF-SIM, MEF cells expressing clathrin light chain B fused to the C terminal of mEmerald were incubated with DMEM medium containing 250 μg/mL TfR bound to human transferrin conjugated with Alexa 568 (T23365, Life Technologies) for 15 min.
Fixed cells were treated for 15 min with fixation buffer containing 4% paraformaldehyde, 0.1% gluteraldehyde in PHEM buffer (25 mM HEPES, 10 mM EGTA, 2 mM MgCl2, and 120 mM PIPES in pH 7.3).
Tracking analysis of CCPs
For each image frame, we segmented the CCPs using a watershed algorithm written in Matlab (MathWorks, 2014a) and measured their centroids individually. Subsequently, the centroid position was linked between time points using u-track 2.1 (54). This linking operation collected successive position information for each pit over the entire endocytic process (Fig. 2E) from initiation to final internalization. It was then straightforward to determine the lifetime (Fig. 2A) for each endocytic event.
In order to precisely measure the pit diameter (Fig. 2, B and C), we first measured the system magnification to the camera by imaging a standard fine counting grid (2280-32, Ted Pella). The SIM image of each CCP was then deconvolved with the equivalent PSF of the SIM system to compensate for the broadening due to the finite resolution of the instrument. Last, we measured the diameter of each deconvolved pit using an intensity-weighted average radius relative to the centroid of the pit. In certain cases (Fig. 2A and Movie 3), pits were color-coded at each time point based on the time since their initiation to the current time point.
One challenge in this analysis was how to identify isolated pits rather than aggregates and how to be sure that these represented true pits rather than noise or disorganized patches of nonassembled clathrin. To accomplish this, we set some conditions during the analysis, such as that a pit must start as a spot and then evolve into a ring at at least one time point. When analyzing the correlation between pit lifetime and maximum diameter, we added the further constraint of including only those pits formed after the first frame in order to insure that we could accurately measure the entire lifetime.
When measuring the associations of actin with clathrin, we first implemented the tracking algorithm above to obtain time-lapse CCP images for each endocytic event. We then created a mask for each CCP identified in each frame, equal to the CCP size plus an additional boundary of one pixel. We then applied these masks to each frame of Lifeact data and integrated the actin fluorescence within each CCP-derived mask. If the actin signal integrated over the area of a given mask increased during the final five frames of the life of the associated CCP, it was decided that actin was recruited to the CCP during the final stage of endocytosis.
Supplementary Material
Acknowledgments
We thank the Shared Resource teams at Janelia for their skill and dedication in specimen handling and preparation and the Instrument Design and Fabrication team for their manufacturing expertise. D.L., L.S., B.-C.C., and E.B. are funded by the Howard Hughes Medical Institute (HHMI). X.Z., M.Z., and P.X. are funded by the National Basic Research Program (973 Program) of China (2013CB910103), the National Natural Science Foundation of China (31370851), and the Beijing Natural Science Foundation, China (7131011). M.P. and T.K. were funded in part by NIH grant GM-075252. Skylan-NS is available from P.X. upon execution of a materials transfer agreement with the Institute of Biophysics. Other fluorescent protein constructs used in this work are from the Michael Davidson Collection and are available, along with sequence information, from Addgene (www.addgene.org/fluorescent-proteins/davidson). Researchers can apply to access the microscope as visitors through the Advanced Imaging Center at Janelia (www.janelia.org/open-science/advanced-imaging-center). Technical information for the construction of a copy of the microscope is available to nonprofit entities upon execution of a no-cost Research License with HHMI. Nonlinear SIM with patterned activation, in two or three dimensions, as described here is covered within U.S. provisional patent application 62/057,220 filed by E.B. and D.L. and assigned to HHMI.
Footnotes
SUPPLEMENTARY MATERIALS
www.sciencemag.org/content/349/6251/aab3500/suppl/DC1
Supplementary Text
References (55–68)
REFERENCES AND NOTES
- 1.Schermelleh L, Heintzmann R, Leonhardt H. A guide to super-resolution fluorescence microscopy. J Cell Biol. 2010;190:165–175. doi: 10.1083/jcb.201002018. [DOI] [PMC free article] [PubMed] [Google Scholar]
- 2.Schnell U, Dijk F, Sjollema KA, Giepmans BN. Immunolabeling artifacts and the need for live-cell imaging. Nat Methods. 2012;9:152–158. doi: 10.1038/nmeth.1855. [DOI] [PubMed] [Google Scholar]
- 3.Nieuwenhuizen RP, et al. Measuring image resolution in optical nanoscopy. Nat Methods. 2013;10:557–562. doi: 10.1038/nmeth.2448. [DOI] [PMC free article] [PubMed] [Google Scholar]
- 4.Shu X, et al. A genetically encoded tag for correlated light and electron microscopy of intact cells, tissues, and organisms. PLOS Biol. 2011;9:e1001041. doi: 10.1371/journal.pbio.1001041. [DOI] [PMC free article] [PubMed] [Google Scholar]
- 5.Martell JD, et al. Engineered ascorbate peroxidase as a genetically encoded reporter for electron microscopy. Nat Biotechnol. 2012;30:1143–1148. doi: 10.1038/nbt.2375. [DOI] [PMC free article] [PubMed] [Google Scholar]
- 6.Shroff H, Galbraith CG, Galbraith JA, Betzig E. Live-cell photoactivated localization microscopy of nanoscale adhesion dynamics. Nat Methods. 2008;5:417–423. doi: 10.1038/nmeth.1202. [DOI] [PMC free article] [PubMed] [Google Scholar]
- 7.Shim SH, et al. Super-resolution fluorescence imaging of organelles in live cells with photoswitchable membrane probes. Proc Natl Acad Sci USA. 2012;109:13978–13983. doi: 10.1073/pnas.1201882109. [DOI] [PMC free article] [PubMed] [Google Scholar]
- 8.Hein B, Willig KI, Hell SW. Stimulated emission depletion (STED) nanoscopy of a fluorescent protein-labeled organelle inside a living cell. Proc Natl Acad Sci USA. 2008;105:14271–14276. doi: 10.1073/pnas.0807705105. [DOI] [PMC free article] [PubMed] [Google Scholar]
- 9.Westphal V, et al. Video-rate far-field optical nanoscopy dissects synaptic vesicle movement. Science. 2008;320:246–249. doi: 10.1126/science.1154228. [DOI] [PubMed] [Google Scholar]
- 10.Grotjohann T, et al. rsEGFP2 enables fast RESOLFT nanoscopy of living cells. eLife. 2012;1:e00248. doi: 10.7554/eLife.00248. [DOI] [PMC free article] [PubMed] [Google Scholar]
- 11.Chmyrov A, et al. Nanoscopy with more than 100,000 ‘doughnuts’. Nat Methods. 2013;10:737–740. doi: 10.1038/nmeth.2556. [DOI] [PubMed] [Google Scholar]
- 12.Materials and methods are available as supplementary materials on Science Online
- 13.Kner P, Chhun BB, Griffis ER, Winoto L, Gustafsson MG. Super-resolution video microscopy of live cells by structured illumination. Nat Methods. 2009;6:339–342. doi: 10.1038/nmeth.1324. [DOI] [PMC free article] [PubMed] [Google Scholar]
- 14.Shao L, Kner P, Rego EH, Gustafsson MG. Super-resolution 3D microscopy of live whole cells using structured illumination. Nat Methods. 2011;8:1044–1046. doi: 10.1038/nmeth.1734. [DOI] [PubMed] [Google Scholar]
- 15.Fiolka R, Shao L, Rego EH, Davidson MW, Gustafsson MG. Time-lapse two-color 3D imaging of live cells with doubled resolution using structured illumination. Proc Natl Acad Sci USA. 2012;109:5311–5315. doi: 10.1073/pnas.1119262109. [DOI] [PMC free article] [PubMed] [Google Scholar]
- 16.Riedl J, et al. Lifeact: A versatile marker to visualize F-actin. Nat Methods. 2008;5:605–607. doi: 10.1038/nmeth.1220. [DOI] [PMC free article] [PubMed] [Google Scholar]
- 17.McMahon HT, Boucrot E. Molecular mechanism and physiological functions of clathrin-mediated endocytosis. Nat Rev Mol Cell Biol. 2011;12:517–533. doi: 10.1038/nrm3151. [DOI] [PubMed] [Google Scholar]
- 18.Ehrlich M, et al. Endocytosis by random initiation and stabilization of clathrin-coated pits. Cell. 2004;118:591–605. doi: 10.1016/j.cell.2004.08.017. [DOI] [PubMed] [Google Scholar]
- 19.Gaidarov I, Santini F, Warren RA, Keen JH. Spatial control of coated-pit dynamics in living cells. Nat Cell Biol. 1999;1:1–7. doi: 10.1038/8971. [DOI] [PubMed] [Google Scholar]
- 20.Saffarian S, Cocucci E, Kirchhausen T. Distinct dynamics of endocytic clathrin-coated pits and coated plaques. PLOS Biol. 2009;7:e1000191. doi: 10.1371/journal.pbio.1000191. [DOI] [PMC free article] [PubMed] [Google Scholar]
- 21.Grove J, et al. Flat clathrin lattices: Stable features of the plasma membrane. Mol Biol Cell. 2014;25:3581–3594. doi: 10.1091/mbc.E14-06-1154. [DOI] [PMC free article] [PubMed] [Google Scholar]
- 22.Heuser J. Effects of cytoplasmic acidification on clathrin lattice morphology. J Cell Biol. 1989;108:401–411. doi: 10.1083/jcb.108.2.401. [DOI] [PMC free article] [PubMed] [Google Scholar]
- 23.Kaksonen M, Toret CP, Drubin DG. Harnessing actin dynamics for clathrin-mediated endocytosis. Nat Rev Mol Cell Biol. 2006;7:404–414. doi: 10.1038/nrm1940. [DOI] [PubMed] [Google Scholar]
- 24.Cureton DK, Massol RH, Saffarian S, Kirchhausen TL, Whelan SP. Vesicular stomatitis virus enters cells through vesicles incompletely coated with clathrin that depend upon actin for internalization. PLOS Pathog. 2009;5:e1000394. doi: 10.1371/journal.ppat.1000394. [DOI] [PMC free article] [PubMed] [Google Scholar]
- 25.Boulant S, Kural C, Zeeh JC, Ubelmann F, Kirchhausen T. Actin dynamics counteract membrane tension during clathrin-mediated endocytosis. Nat Cell Biol. 2011;13:1124–1131. doi: 10.1038/ncb2307. [DOI] [PMC free article] [PubMed] [Google Scholar]
- 26.Shevchuk AI, et al. An alternative mechanism of clathrin-coated pit closure revealed by ion conductance microscopy. J Cell Biol. 2012;197:499–508. doi: 10.1083/jcb.201109130. [DOI] [PMC free article] [PubMed] [Google Scholar]
- 27.Heintzmann R, Jovin TM, Cremer C. Saturated patterned excitation microscopy—a concept for optical resolution improvement. J Opt Soc Am A Opt Image Sci Vis. 2002;19:1599–1609. doi: 10.1364/JOSAA.19.001599. [DOI] [PubMed] [Google Scholar]
- 28.Gustafsson MG. Nonlinear structured-illumination microscopy: Wide-field fluorescence imaging with theoretically unlimited resolution. Proc Natl Acad Sci USA. 2005;102:13081–13086. doi: 10.1073/pnas.0406877102. [DOI] [PMC free article] [PubMed] [Google Scholar]
- 29.Rego EH, et al. Nonlinear structured-illumination microscopy with a photoswitchable protein reveals cellular structures at 50-nm resolution. Proc Natl Acad Sci USA. 2012;109:E135–E143. doi: 10.1073/pnas.1107547108. [DOI] [PMC free article] [PubMed] [Google Scholar]
- 30.Zhang X, et al. Development of a reversibly switchable fluorescent protein for super-resolution optical fluctuation imaging (SOFI) ACS Nano. 2015;9:2659–2667. doi: 10.1021/nn5064387. [DOI] [PubMed] [Google Scholar]
- 31.Xu K, Babcock HP, Zhuang X. Dual-objective STORM reveals three-dimensional filament organization in the actin cytoskeleton. Nat Methods. 2012;9:185–188. doi: 10.1038/nmeth.1841. [DOI] [PMC free article] [PubMed] [Google Scholar]
- 32.Parton RG, Simons K. The multiple faces of caveolae. Nat Rev Mol Cell Biol. 2007;8:185–194. doi: 10.1038/nrm2122. [DOI] [PubMed] [Google Scholar]
- 33.Lavoie-Cardinal F, et al. Two-color RESOLFT nanoscopy with green and red fluorescent photochromic proteins. ChemPhysChem. 2014;15:655–663. doi: 10.1002/cphc.201301016. [DOI] [PubMed] [Google Scholar]
- 34.Parton RG, Hanzal-Bayer M, Hancock JF. Biogenesis of caveolae: A structural model for caveolin-induced domain formation. J Cell Sci. 2006;119:787–796. doi: 10.1242/jcs.02853. [DOI] [PubMed] [Google Scholar]
- 35.Boucrot E, Howes MT, Kirchhausen T, Parton RG. Redistribution of caveolae during mitosis. J Cell Sci. 2011;124:1965–1972. doi: 10.1242/jcs.076570. [DOI] [PMC free article] [PubMed] [Google Scholar]
- 36.Jovic M, Sharma M, Rahajeng J, Caplan S. The early endosome: A busy sorting station for proteins at the crossroads. Histol Histopathol. 2010;25:99–112. doi: 10.14670/hh-25.99. [DOI] [PMC free article] [PubMed] [Google Scholar]
- 37.Tooze J, Hollinshead M. In AtT20 and HeLa cells brefeldin A induces the fusion of tubular endosomes and changes their distribution and some of their endocytic properties. J Cell Biol. 1992;118:813–830. doi: 10.1083/jcb.118.4.813. [DOI] [PMC free article] [PubMed] [Google Scholar]
- 38.Nielsen E, Severin F, Backer JM, Hyman AA, Zerial M. Rab5 regulates motility of early endosomes on microtubules. Nat Cell Biol. 1999;1:376–382. doi: 10.1038/14075. [DOI] [PubMed] [Google Scholar]
- 39.Otey CA, Carpen O. Alpha-actinin revisited: A fresh look at an old player. Cell Motil Cytoskeleton. 2004;58:104–111. doi: 10.1002/cm.20007. [DOI] [PubMed] [Google Scholar]
- 40.Choi CK, et al. Actin and alpha-actinin orchestrate the assembly and maturation of nascent adhesions in a myosin II motor-independent manner. Nat Cell Biol. 2008;10:1039–1050. doi: 10.1038/ncb1763. [DOI] [PMC free article] [PubMed] [Google Scholar]
- 41.Mavrakis M, et al. Septins promote F-actin ring formation by crosslinking actin filaments into curved bundles. Nat Cell Biol. 2014;16:322–334. doi: 10.1038/ncb2921. [DOI] [PubMed] [Google Scholar]
- 42.Chen BC, et al. Lattice light-sheet microscopy: Imaging molecules to embryos at high spatiotemporal resolution. Science. 2014;346:1257998. doi: 10.1126/science.1257998. [DOI] [PMC free article] [PubMed] [Google Scholar]
- 43.Legesse-Miller A, Massol RH, Kirchhausen T. Constriction and Dnm1p recruitment are distinct processes in mitochondrial fission. Mol Biol Cell. 2003;14:1953–1963. doi: 10.1091/mbc.E02-10-0657. [DOI] [PMC free article] [PubMed] [Google Scholar]
- 44.Friedman JR, et al. ER tubules mark sites of mitochondrial division. Science. 2011;334:358–362. doi: 10.1126/science.1207385. [DOI] [PMC free article] [PubMed] [Google Scholar]
- 45.Huang B, Jones SA, Brandenburg B, Zhuang X. Whole-cell 3D STORM reveals interactions between cellular structures with nanometer-scale resolution. Nat Methods. 2008;5:1047–1052. doi: 10.1038/nmeth.1274. [DOI] [PMC free article] [PubMed] [Google Scholar]
- 46.Presley JF, et al. ER-to-Golgi transport visualized in living cells. Nature. 1997;389:81–85. doi: 10.1038/38891. [DOI] [PubMed] [Google Scholar]
- 47.Hirschberg K, et al. Kinetic analysis of secretory protein traffic and characterization of golgi to plasma membrane transport intermediates in living cells. J Cell Biol. 1998;143:1485–1503. doi: 10.1083/jcb.143.6.1485. [DOI] [PMC free article] [PubMed] [Google Scholar]
- 48.Sheppard CJR. Super-resolution in confocal imaging. Optik (Stuttg) 1988;80:53. [Google Scholar]
- 49.Müller CB, Enderlein J. Image scanning microscopy. Phys Rev Lett. 2010;104:198101. doi: 10.1103/PhysRevLett.104.198101. [DOI] [PubMed] [Google Scholar]
- 50.York AG, et al. Resolution doubling in live, multicellular organisms via multifocal structured illumination microscopy. Nat Methods. 2012;9:749–754. doi: 10.1038/nmeth.2025. [DOI] [PMC free article] [PubMed] [Google Scholar]
- 51.Roberts RL, et al. Endosome fusion in living cells overexpressing GFP-rab5. J Cell Sci. 1999;112:3667–3675. doi: 10.1242/jcs.112.21.3667. [DOI] [PubMed] [Google Scholar]
- 52.Sander JD, Joung JK. CRISPR-Cas systems for editing, regulating and targeting genomes. Nat Biotechnol. 2014;32:347–355. doi: 10.1038/nbt.2842. [DOI] [PMC free article] [PubMed] [Google Scholar]
- 53.Gustafsson MGL, et al. Three-dimensional resolution doubling in wide-field fluorescence microscopy by structured illumination. Biophys J. 2008;94:4957–4970. doi: 10.1529/biophysj.107.120345. [DOI] [PMC free article] [PubMed] [Google Scholar]
- 54.Jaqaman K, et al. Robust single-particle tracking in live-cell time-lapse sequences. Nat Methods. 2008;5:695–702. doi: 10.1038/nmeth.1237. [DOI] [PMC free article] [PubMed] [Google Scholar]
Associated Data
This section collects any data citations, data availability statements, or supplementary materials included in this article.