Abstract
Purpose
The purpose of the present study is to evaluate the changes over time of the Spatial Hearing Questionnaire (SHQ; Tyler, Perreau, & Ji, 2009) and the Speech, Spatial and Qualities of Hearing Scale (SSQ; Gatehouse & Noble, 2004) in adults with simultaneous bilateral cochlear implants by collecting data for 2 years after implantation.
Method
Nineteen postlingual subjects participated in this study. Average age at implant was 63 years. The subjects' data were included in this retrospective analysis only if they completed both questionnaires. We compared subjects' SSQ and SHQ scores to word recognition and sound localization performances.
Results
The study showed SHQ and SSQ scores continuously improved up to 1 year postimplantation, with the most improvement occurring within the first 6 months of implantation. After 1 year, the scores reached a plateau. This is consistent with laboratory tests from the same 19 subjects, and they showed high correlations (p < .05). The present study also showed a high degree of correlation between SHQ and SSQ scores.
Conclusions
Both the SSQ and SHQ scores improved up to 12 months postimplantation, with the most improvement during the first 6 months of implantation. Both were consistent with laboratory tests. There was a high degree of correlation between SHQ and SSQ scores.
To document the benefit after improving hearing aid and cochlear implant (CI) performance, it is important to assess spatial hearing— the ability to hear and process sounds from different locations. This can be accomplished with a variety of tests and questionnaires.
Spatial hearing speech perception tests include tests in which the speech and noise originate from different locations. For example, words originate from one loudspeaker, and noise or a competitive signal is simultaneously sent from a different source (Arndt et al., 2011; Buss et al., 2008; Gantz et al., 2002; Hassepass et al., 2013; Litovsky, Parkinson, Arcaroli, & Sammeth, 2006; Tyler et al., 2002; Tyler, Noble, Dunn, & Witt, 2006). Localization tests usually require subjects to identify the location among an array of loudspeakers from which the sound was emitted (Chang et al., 2010; Dunn, Tyler, & Witt, 2005; Grantham, Ashmead, Ricketts, Labadie, & Haynes, 2007; Kuk, Korhonen, Lau, Keenan, & Norgaard, 2013; Moon et al., 2014).
There are two questionnaires specifically designed to focus on spatial hearing. The Speech, Spatial and Qualities of Hearing Scale (SSQ; Gatehouse & Noble, 2004) covers speech perception in the quiet conditions of a soundproof room and in spatial hearing situations, localization tasks, and rating the quality of speech perceived (naturalness, clarity, ability to differentiate speakers, and perception of music). The SSQ contains 49 questions using a scale from 0 to 10 for each question. It was developed using a clinician–patient interview experimental design. It has been widely used, and there have been several adaptations (Akeroyd, Guy, Harrison, & Suller, 2014; Desmet, Wouters, De Bodt, & Van de Heyning, 2012; Noble, Tyler, Dunn, & Bhullar, 2009; Tavora-Vieira, Marino, Krishnaswamy, Kuthbutheen, & Rajan, 2013).
The Spatial Hearing Questionnaire (SHQ; Tyler, Perreau, & Ji, 2009) focuses only on spatial hearing, covering areas of speech perception in quiet conditions, speech perception in spatial hearing situations, and localization of a sound source. It does not include questions on the quality of the speech or music. The SHQ is comprised of 24 questions using a scale from 0 to 100 (people typically choose a number between 0 and 5, 6 and 10, 11 and 15, etc., and therefore the resolution typically has 21 responses). It was validated on the basis of patients filling out the questionnaire without assistance. It has also been widely used, and there have been adaptions (Potvin, Kleine Punte, & Van de Heyning, 2011; Desmet et al., 2012; Perreau, Ou, Tyler, & Dunn, 2014; Perreau, Spejcher, Ou, & Tyler, 2014).
Research studying long-term results of SHQ and SSQ questionnaires on the benefits of CIs is limited. Hassepass et al. (2013) evaluated audiologic and SSQ outcomes at preimplantation and 12 months after CI treatment for three patients with unilateral hearing loss due to labyrinthitis ossificans. Their data showed moderate-to-high hearing benefit after CI in two cases and no benefit for the third. Tavora-Vieira et al. (2013) showed that there was a significant improvement from preoperative SSQ scores and the 3-month follow-up scores in a study to investigate CI in patients with unilateral deafness with and without tinnitus. Perreau, Ou, et al. (2014) compared pre- and postimplant scores using the SHQ for different CI profiles and found that subjective spatial hearing ability was rated higher for the bilateral and short-electrode CI users compared to the unilateral and bimodal users.
However, very little research has reported on the long-term results of SHQ and SSQ on the benefits of simultaneous bilateral CIs. This evaluation seems crucial given that implants are put into both ears, and one implant is not preserved for future medical intervention.
Research studying the correlations of SHQ and SSQ with objective results is limited. Laske et al. (2009) demonstrated that there was a statistically significant correlation of the results from the localization test and the section of the SSQ on spatial hearing (p < .05) in a study to assess subjective and objective results in 34 consecutive bilaterally implanted adult patients. However, Heo, Lee, and Lee (2013) found that the relationships were not always consistent between the objective outcomes and the subjective self-reports in a study aimed to measure the hearing aid and CI benefits on the objective and subjective outcomes for adults. To better document the benefits of the CI performances, a study that focuses on questionnaires and objective result correlation is needed.
Research studying the correlations of SSQ and SHQ is limited. SSQ and SHQ are two questionnaires focused on spatial hearing. They both have speech and localization factors. SSQ includes the evaluation of the speech quality perceived, and it is more detailed. The SHQ focus only on spatial hearing, and it is easier to do. To better choose the questionnaires for clinics and scientific research, it is necessary to know the correlations and differences between these questionnaires.
The purpose of the present study is to evaluate the changes over time of SHQ and SSQ when used on adults with simultaneous bilateral CIs by collecting data over 2 years postimplantation. We also compare the questionnaires' results with laboratory word recognition and sound localization tests. Last, we study the correlations of SSQ and SHQ over time on these subjects with simultaneous bilateral implants (CI+CI).
Method
Subjects
All subjects participated in the Iowa Adult Cochlear Implant Program, a study approved by the University of Iowa's Institutional Review Board. Of the 19 postlingual subjects participating in this study, eight were men, and 11 were women. The age when the implant was performed was 63 years (range = 20–81, SD = 13). All the subjects were CI+CI. The subjects' data were included in this retrospective analysis only if they completed both questionnaires.
Test Measures
The SSQ and SHQ were administered to the subjects in one session by a research audiologist in a quiet room. Subjects completed the questionnaire prior, during, or shortly after their research sessions at the University of Iowa using a paper-and-pencil method to record their responses, and data were entered and stored in a database for later retrieval. Responses were averaged, and the mean score for each subsection was also calculated. The three factors in SSQ are (a) speech understanding; (b) spatial perception; and (c) clarity, separation, and identification (Akeroyd et al., 2014), respectively. The three factors in SHQ are (a) sound localization, (b) speech in noise, and (c) music in noise and speech in quiet (Tyler et al., 2009).
We compared subjects' SSQ and SHQ scores to word recognition and sound localization performances. The Consonant–Nucleus–Consonant (CNC) test (Tillman & Carhart, 1966) was presented in quiet at 70 dBC, and the Everyday Sounds Localization Test (Dunn et al., 2005) was presented in a double-walled, sound-treated room. The latter test consisted of 16 everyday sounds presented through eight loudspeakers, each spaced 15.5° apart, forming a 108° arc in front of the subjects. The sound stimuli were each presented at 70 dBC. A low score on this test—that is, root-mean-square (RMS) error of < 10°—represents good localization abilities. Chance level of this test is from 44.5° to 55.53° RMS error. We simulated chance observations using statistical software R of 96 total sounds of which 12 sounds come from each of eight loudspeakers. The response value was drawn from a uniform distribution of choosing Speakers 1–8 a total of 12 times. RMS error was computed for each of 10,000 simulated draws. The mean RMS value of the simulated draws was 3.237 with a 95% confidence interval ranging from 2.874 to 3.582. If we multiply by 15.5 to gain the azimuth between speakers, we get the RMS error in degrees. In this case, the mean was 50.18 with a 95% confidence interval ranging from 44.55 to 55.53. The word recognition and localization data were administered to subjects with two devices.
Results
Changes of SHQ, SSQ, Word Recognition, and Localization Performances Over Time
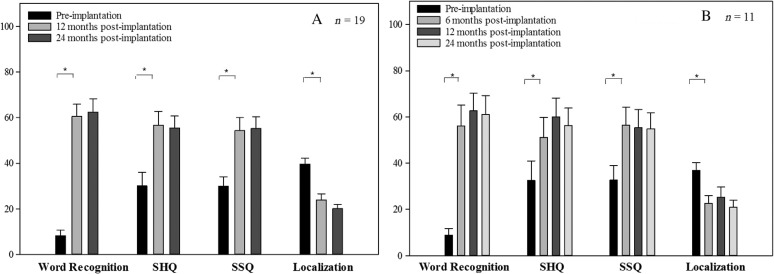
Figure 1 shows the changes of SHQ, SSQ, word recognition, and localization over time. Figure 1A shows the results from 19 subjects who all have data points at preimplantation and 12 and 24 months postimplantation. A repeated-measures analysis of variance with Bonferroni adjustment for multiple comparisons demonstrated that the first 12 months after implantation showed the largest incremental improvement for all measurements, F(2, 36) = 77.3, p < .05, for word recognition; F(2, 36) = 19.2, p < .05, for SHQ; F(2, 36) = 24.0, p < .05, for SSQ; and F(2, 36) = 36.2, p < .05, for localization performances. There is no significant difference among 12-month postimplantation and 24-month postimplantation scores for all measurements. CNC scores improved from 7.74% at preimplantation to 61.42% at 12 months with an additional benefit of 3% between 12 and 24 months. For localization performances, RMS error improved from 39.25° at implantation to 22.20° at 12 months with an additional benefit of 2° between 12 and 24 months. SHQ scores improved from 25.26 at preimplantation to 57 at 12 months with no additional benefit between 12 and 24 months. SSQ scores improved from 2.69 at preimplantation to 5.44 at 12 months with a slight benefit of 0.1 between 12 and 24 months.
Figure 1.
Changes in Spatial Hearing Questionnaire (SHQ); Speech, Spatial and Qualities of Hearing Scale (SSQ); word recognition; and localization performances over time. (A) Results from 19 subjects who all have data points at preimplantation and 12 and 24 months postimplantation. (B) Eleven subjects' results from the same 19 subjects who have data points at preimplantation and 6, 12, and 24 months postimplantation. Word recognition performances are expressed as percentage correct. Localization performances are expressed as root-mean-square error scores. SSQ scores are changed into 100 scales for comparisons. Error bars indicate standard errors. Significant differences are marked by the brackets. *p < .05.
Figure 1B shows 11 subjects' results from among the same 19 subjects who have data points at preimplantation and 6, 12, and 24 months postimplantation. A repeated-measures analysis of variance with least significant difference adjustment for multiple comparisons demonstrated that the first 6 months after implantation showed the largest incremental improvement for all measurements, F(3, 30) = 27.1, p < .05, for word recognition; F(3, 30) = 9.0, p < .05, for SHQ; F(3, 30) = 8.99, p < .05, for SSQ; and F(3, 30) = 7.2, p < .05, for localization performances. There is no significant difference among 6-, 12-, and 24-month postimplantation scores for all measurements. CNC scores improved from 8.82% at preimplantation to 56.09% at 6 months and continued to improve to 62.64% at 12 months with no additional benefit between 12 and 24 months. For localization performances, RMS error improved from 36.80° at implantation to 23.19° at 6 months with no additional benefit between 6 and 12 months and then continued to improve to 20.94° at 24 months postimplantation. SHQ scores improved from 25.82 at preimplantation to 52.46 at 6 months and continued to improve to 60 at 12 months with no additional benefit between 12 and 24 months. SSQ scores improved from 2.82 at preimplantation to 5.32 at 6 months and continued to improve to 5.53 at 12 months with no additional benefit between 12 and 24 months. Figure 1 shows that during the first 24 months postimplantation, word recognition, localization performances, SHQ, and SSQ scores mainly improved between preimplantation and 6 months postimplantation and continued to improve to 24 months postimplantation. After 12 months, it reached a plateau, and there were no big benefits (see Table 1). The study also showed that the changes of SHQ and SSQ are consistent with word recognition and localization performances over time.
Table 1.
Average scores and standard deviations of Spatial Hearing Questionnaire (SHQ); Speech, Spatial and Qualities of Hearing Scale (SSQ); word recognition; and localization performances over time.
| Time since implantation | Size | M | SD |
|---|---|---|---|
| Preimplantation | |||
| SHQ overall scores | 19 | 25.26 | 20.03 |
| SSQ overall scores | 19 | 2.69 | 1.56 |
| SHQ speech factor scores | 19 | 26.52 | 22.94 |
| SSQ speech factor scores | 19 | 1.65 | 1.30 |
| SHQ localization factor scores | 19 | 15.12 | 17.05 |
| SSQ localization factor scores | 19 | 2.19 | 1.96 |
| Word recognition | 19 | 7.74 | 9.98 |
| Localization | 19 | 39.25 | 11.88 |
| 6 months | |||
| SHQ overall scores | 11 | 52.46 | 27.69 |
| SSQ overall scores | 11 | 5.32 | 2.66 |
| SHQ speech factor scores | 11 | 52.25 | 28.97 |
| SSQ speech factor scores | 11 | 4.99 | 2.75 |
| SHQ localization factor scores | 11 | 47.16 | 29.97 |
| SSQ localization factor scores | 11 | 5.17 | 2.83 |
| Word recognition | 11 | 56.09 | 30.08 |
| Localization | 11 | 23.19 | 11.28 |
| 12 months | |||
| SHQ overall scores | 19 | 57.00 | 26.79 |
| SSQ overall scores | 19 | 5.44 | 2.49 |
| SHQ speech factor scores | 19 | 53.60 | 27.11 |
| SSQ speech factor scores | 19 | 5.01 | 2.61 |
| SHQ localization factor scores | 19 | 54.28 | 29.61 |
| SSQ localization factor scores | 19 | 5.21 | 2.86 |
| Word recognition | 19 | 61.42 | 22.20 |
| Localization | 19 | 22.20 | 9.96 |
| 24 months | |||
| SHQ overall scores | 19 | 55.66 | 22.88 |
| SSQ overall scores | 19 | 5.53 | 2.21 |
| SHQ speech factor scores | 19 | 51.37 | 24.02 |
| SSQ speech factor scores | 19 | 4.91 | 2.27 |
| SHQ localization factor scores | 19 | 54.70 | 26.84 |
| SSQ localization factor scores | 19 | 5.13 | 2.99 |
| Word recognition | 19 | 64.00 | 23.45 |
| Localization | 19 | 20.33 | 8.22 |
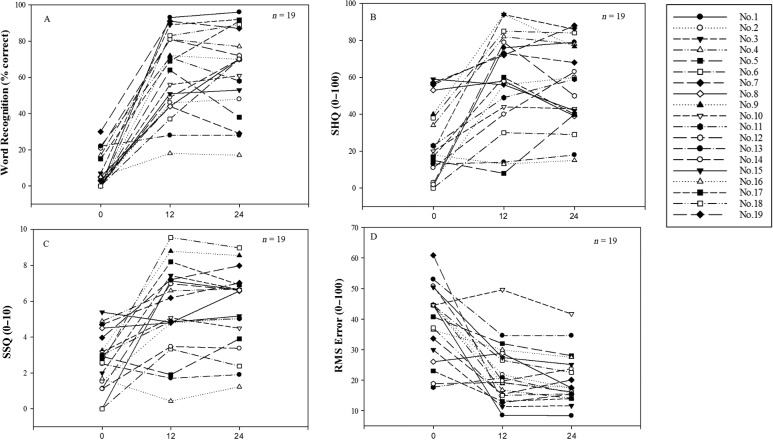
Figure 2 shows the individual results for word recognition, SHQ, SSQ, and localization performances at preimplantation and 12 and 24 months postimplantation for the same 19 subjects shown in Figure 1A. There are large individual differences in performances over time.
Figure 2.
Panels A–D: Individual results for word recognition; Spatial Hearing Questionnaire (SHQ); Speech, Spatial and Qualities of Hearing Scale (SSQ); and localization performances at preimplantation and 12 and 24 months postimplantation for the same 19 subjects shown in Figure 1A. RMS = root-mean-square.
Correlations of SSQ/SHQ Scores and Word Recognition Over Time
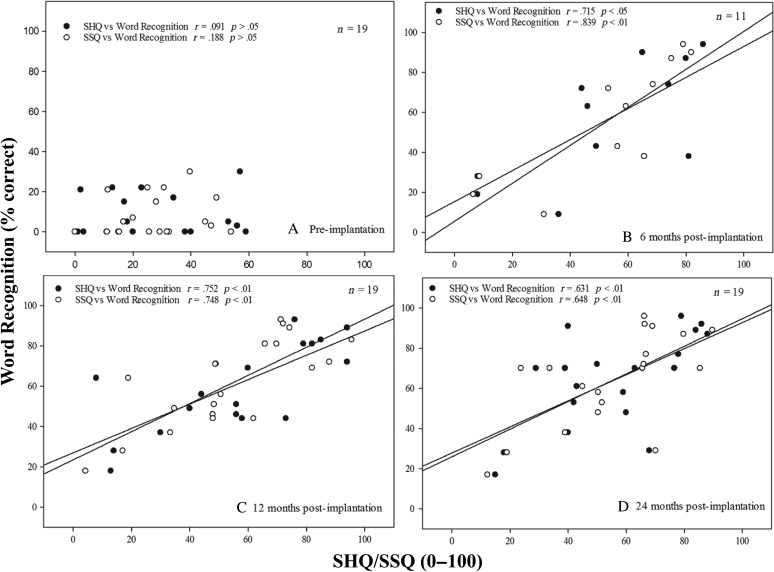
Figures 3A, 3C, and 3D show the correlations of SSQ/SHQ and word recognition at preimplantation and 12 and 24 months postimplantation from the same 19 subjects shown in Figure 1A. Figure 3B shows the correlations at 6 months postimplantation from the same 11 subjects shown in Figure 1B. Significant correlations were found between SHQ/SSQ scores and word recognition at 6, 12, and 24 months postimplantation. Pearson correlation coefficients for SHQ/SSQ and word recognition at 6 months postimplantation were 0.715 (p < .05) and 0.839 (p < .01), respectively. Pearson correlation coefficients for SHQ/SSQ and word recognition at 12 months postimplantation were 0.752 and 0.748, respectively (p < .01). Pearson correlation coefficients for SHQ/SSQ and word recognition at 24 months postimplantation were 0.631 and 0.648, respectively (p < .01). No significant correlations were found between SHQ/SSQ scores and word recognition at preimplantation.
Figure 3.
Correlations of Spatial Hearing Questionnaire (SHQ) scores; Speech, Spatial and Qualities of Hearing Scale (SSQ) scores; and word recognition over time. Panel A: Preimplantation correlations from the same 19 subjects shown in Figure 1A. Panel B: The 6-month postimplantation correlations from the same 11 subjects shown in Figure 1B. Panel C: The 12-month postimplantation correlations from the same 19 subjects shown in Figure 1A. Panel D: The 24-month postimplantation correlations from the same 19 subjects shown in Figure 1A. Word recognition performance is expressed as percentage correct. SSQ scores are changed into 100 scales for comparisons. r = Pearson correlation coefficients. Significant differences are marked in the figures.
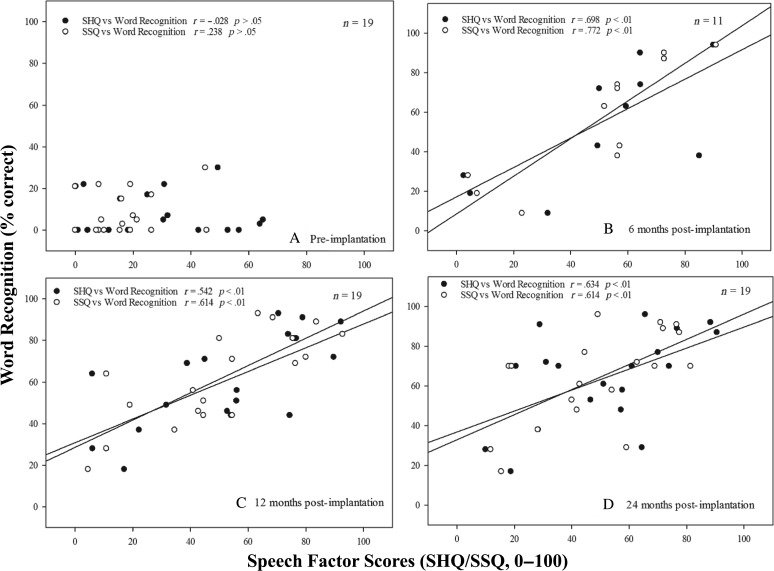
Figure 4 shows that significant correlations were found between SHQ/SSQ speech factor scores and word recognition at 6, 12, and 24 months postimplantation. Pearson correlation coefficients for SHQ/SSQ speech factor scores and word recognition at 6 months postimplantation were 0.698 and 0.772, respectively (p < .01). Pearson correlation coefficients for SHQ/SSQ speech factor scores and word recognition at 12 months postimplantation were 0.542 and 0.614, respectively (p < .01). Pearson correlation coefficients for SHQ/SSQ speech factor scores and word recognition at 24 months postimplantation were 0.634 and 0.614, respectively (p < .01). No significant correlations were found between SHQ/SSQ speech factor scores and word recognition at preimplantation.
Figure 4.
Correlations of Spatial Hearing Questionnaire (SHQ) scores; Speech, Spatial and Qualities of Hearing Scale (SSQ) scores; and word recognition over time. Panels A, C, and D: Correlations at preimplantation and 12 and 24 months postimplantation from the same 19 subjects shown in Figure 1A. Panel B: Correlations at 6 months postimplantation from the same 11 subjects shown in Figure 1B. Word recognition performance is expressed as percentage correct. SSQ scores are changed into 100 scales for comparisons. r = Pearson correlation coefficients. Significant differences are marked in the figures.
Figure 3 shows that SHQ and SSQ overall scores had good correlations with word recognition performances over time. Furthermore, Figure 4 shows that SHQ and SSQ speech factor scores also had good correlations with word recognition over time.
Correlations of SSQ/SHQ Scores and Localization Over Time
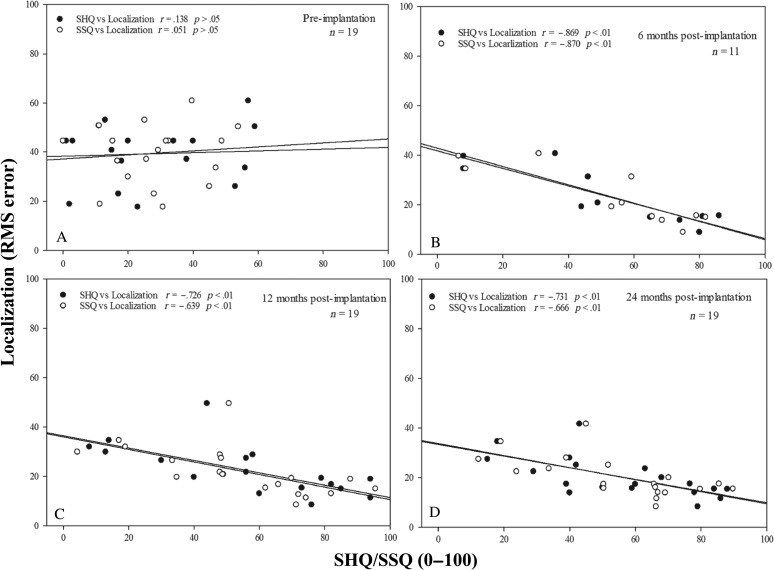
Figures 5A, 5C, and 5D show the correlations of SSQ/SHQ scores and localization from the same 19 subjects shown in Figure 1A at preimplantation and 6, 12, and 24 months postimplantation. Figure 5B shows the correlations from the same 11 subjects shown in Figure 1B at 6 months postimplantation. Significant correlations were found between SHQ/SSQ scores and localization at 6, 12, and 24 months postimplantation in Figure 5. Pearson correlation coefficients for SHQ/SSQ scores and localization performances at 6 months postimplantation were −0.869 and −0.870, respectively (p < .01). Pearson correlation coefficients for SHQ/SSQ scores and localization at 12 months postimplantation were −0.726 and −0.639, respectively (p < .01). Pearson correlation coefficients for SHQ/SSQ scores and localization at 24 months postimplantation were −0.731 and −0.666, respectively (p < .01). No significant correlations were found between SHQ/SSQ scores and localization at preimplantation.
Figure 5.
Correlations of Spatial Hearing Questionnaire (SHQ) scores; Speech, Spatial and Qualities of Hearing Scale (SSQ) scores; and localization performances over time. Panel A: Preimplantation correlations from the same 19 subjects shown in Figure 1A. Panel B: The 6-month postimplantation correlations from the same 11 subjects shown in Figure 1B. Panel C: The 12-month postimplantation correlations from the same 19 subjects shown in Figure 1A. Panel D: The 24-month postimplantation correlations from the same 19 subjects shown in Figure 1A. Localization performances are expressed as root-mean-square (RMS) error scores. SSQ scores are changed into 100 scales for comparisons. r = Pearson correlation coefficients. Significant differences are marked in the figures.
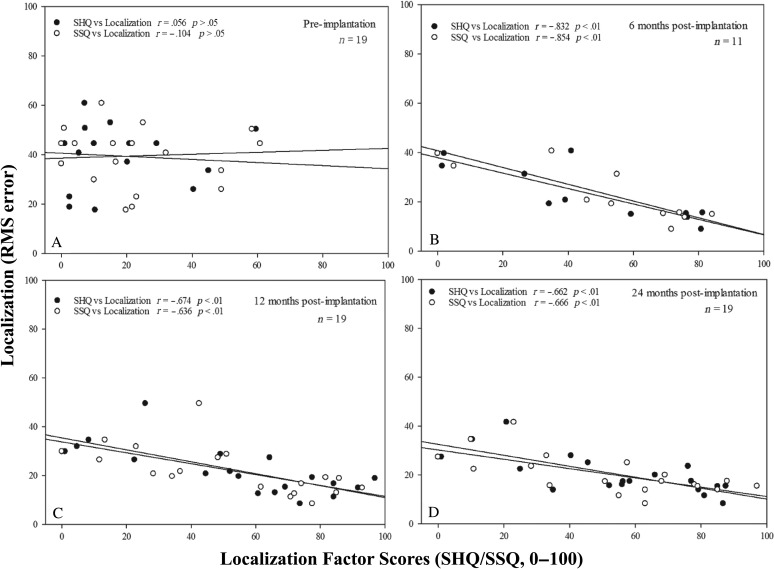
Figure 6 shows that significant correlations were found between SHQ/SSQ localization factor scores and localization at 6, 12, and 24 months postimplantation. Pearson correlation coefficients for SHQ/SSQ localization factor scores and localization at 6 months postimplantation were −0.817 and −0.882, respectively (p < .01). Pearson correlation coefficients for SHQ/SSQ localization factor scores and localization at 12 months postimplantation were −0.726 and −0.639, respectively (p < .01). Pearson correlation coefficients for SHQ/SSQ localization factor scores and localization at 24 months postimplantation were −0.662 and −0.666, respectively (p < .01). No significant correlations were found between SHQ/SSQ localization factor scores and localization at preimplantation. Figures 5 and 6 show that both SHQ and SSQ overall scores and speech factor scores had good correlations with word recognition over time.
Figure 6.
Correlations of Spatial Hearing Questionnaire (SHQ) scores; Speech, Spatial and Qualities of Hearing Scale (SSQ) scores; localization scores; and localization performances over time. Panels A, C, and D: Correlations at preimplantation and 12 and 24 months postimplantation from the same 19 subjects shown in Figure 1A. Panel B: Correlations at 6 months postimplantation from the same 11 subjects shown in Figure 1B. Localization performance is expressed as root-mean-square (RMS) error scores. SSQ scores are changed into 100 scales for comparisons. r = Pearson correlation coefficients. Significant differences are marked in the figures.
Correlations of the SSQ Scores and SHQ Scores Over Time
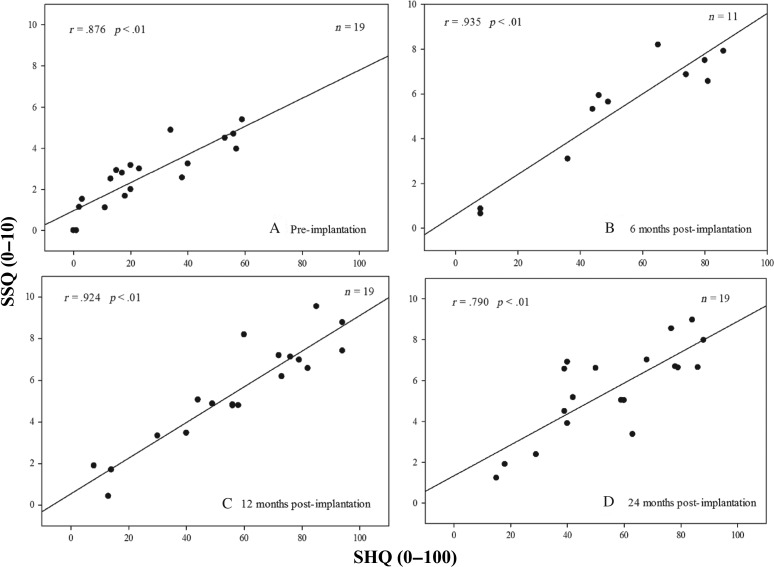
Figure 7 shows the correlations of SHQ and SSQ overall scores over time. Figures 7A, 7C, and 7D show the correlations at preimplantation and 12 and 24 months postimplantation from the same 19 subjects shown in Figure 1A. Figure 7B shows the correlations at 6 months postimplantation from the same 11 subjects shown in Figure 1B. Pearson correlation coefficients for each panel are 0.876, 0.935, 0.924, and 0.790, respectively (p < .01).
Figure 7.
Correlations of Spatial Hearing Questionnaire (SHQ) and Speech, Spatial and Qualities of Hearing Scale (SSQ) overall scores over time. Panels A, C, and D: Correlations at preimplantation and 12 and 24 months postimplantation from the same 19 subjects shown in Figure 1A. Panel B: Correlations at 6 months postimplantation from the same 11 subjects shown in Figure 1B. r = Pearson correlation coefficients. Significant differences are marked in the figures.
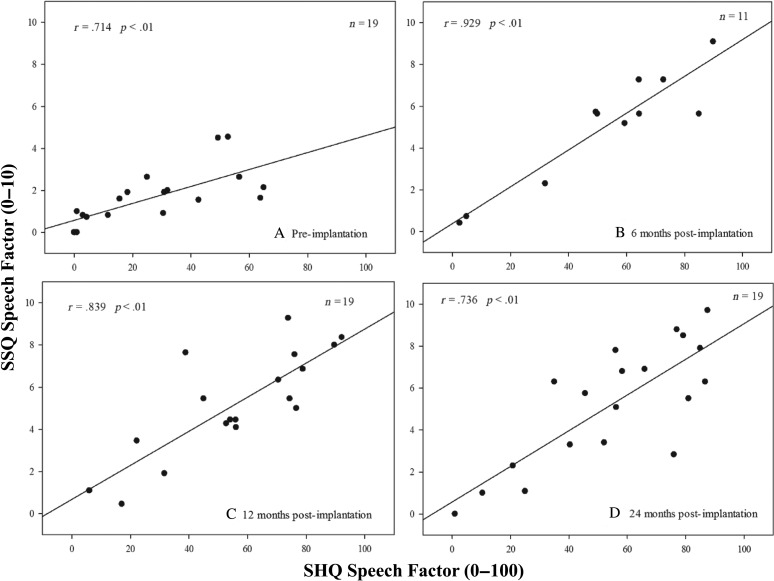
Figure 8 shows the correlations of SHQ speech factor scores and SSQ speech factor scores over time. Pearson correlation coefficients for each panel are 0.714, 0.929, 0.839, and 0.736, respectively (p < .01).
Figure 8.
Correlations of Spatial Hearing Questionnaire (SHQ) and Speech, Spatial and Qualities of Hearing Scale (SSQ) speech factor scores over time. Panels A, C, and D: Correlations at preimplantation and 12 and 24 months postimplantation from the same 19 subjects shown in Figure 1A. Panel B: Correlations at 6 months postimplantation from the same 11 subjects shown in Figure 1B. r = Pearson correlation coefficients. Significant differences are marked in the figures.
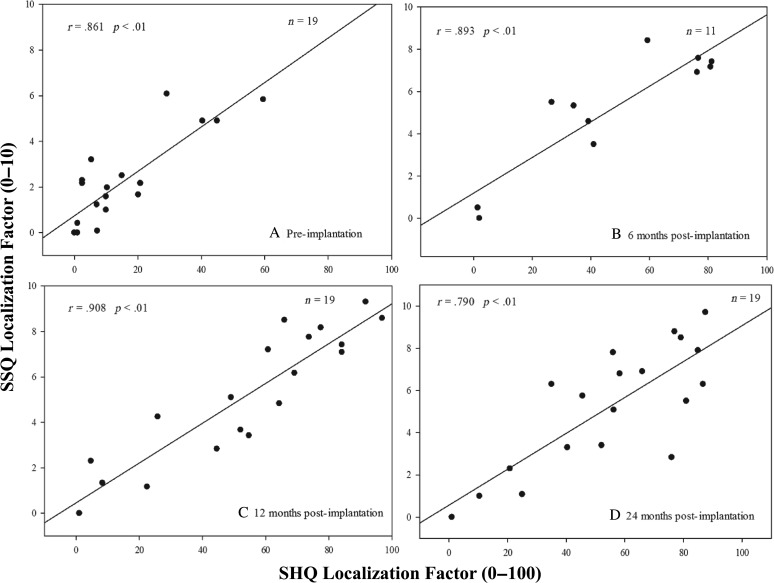
Figure 9 shows the correlations of SHQ localization factor scores and SSQ localization factor scores over time. Pearson correlation coefficients for each panel are 0.861, 0.893, 0.908, and 0.790, respectively (p < .01).
Figure 9.
Correlations of Spatial Hearing Questionnaire (SHQ) and Speech, Spatial and Qualities of Hearing Scale (SHQ) localization factor scores over time. Panels A, C, and D: Correlations at preimplantation and 12 and 24 months postimplantation from the same 19 subjects shown in Figure 1A. Panel B: Correlations at 6 months postimplantation from the same 11 subjects shown in Figure 1B. r = Pearson correlation coefficients. Significant differences are marked in the figures.
One Subject's Questionnaire Results Were Not Consistent With Objective Tests Results
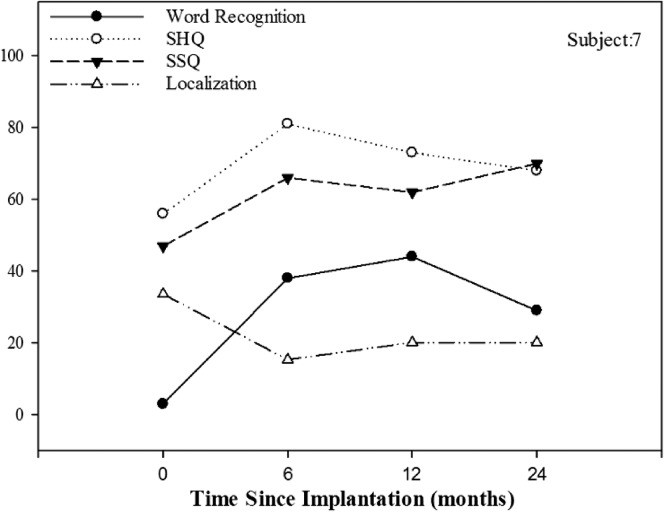
Figure 10 shows the changes of SHQ, SSQ, word recognition, and localization for Subject 7. Her word recognition scores improved from 3% at preimplantation to 38% at 6 months with a small benefit of 6% from 6 to 12 months postimplantation and then declined to 29% at 24 months postimplantation. However, her SHQ scores improved from 56 at preimplantation to 81 at 6 months with a slight reduction to 73 at 24 months and continued to decline to 68 at 24 months postimplantation. The SSQ scores improved from 4.7 at preimplantation to 6.56 at 6 months and slightly reduced to 6.19 at 12 months postimplantation and improved to 7.02 at 24 months postimplantation. For this subject, the trend of SHQ and SSQ changes was consistent with word recognition performances. However, the SHQ and SSQ scores were very high even though her CNC scores were very low. This shows that the subjective feelings were not consistent with the laboratory test results.
Figure 10.
The changes of Spatial Hearing Questionnaire (SHQ); Speech, Spatial and Qualities of Hearing Scale (SSQ); word recognition; and localization for Subject 7. Word recognition performances are expressed as percentage correct. Localization performances are expressed as root-mean-square error scores. SSQ scores are changed into 100 scales for comparisons. The SHQ and SSQ scores were high before and after implantation, and the Consonant–Nucleus–Consonant test scores were very low. This indicated that the subjective feelings were not consistent with the laboratory test results for some subjects.
Discussion
The purpose of the present study was to document the performance changes of two questionnaires over time on adults with CI+CI. We also compared the questionnaires' results with laboratory word recognition and sound localization tests. Furthermore, we studied the correlations of SSQ and SHQ over time on these subjects with CI+CI.
Changes of SHQ and SSQ Over Time on Adults With CI+CI
In the present study, the data show that during the first 24 months postimplantation, SHQ and SSQ scores continuously improved up to 1 year postimplantation with the most benefit occurring within the first 6 months of implantation. After 1 year, scores reached a plateau.
In this study, SHQ scores improved from 25.3 at preimplantation to 57 at 12 months postimplantation. This is consistent with previous studies. Perreau, Ou, et al. (2014) demonstrated that the total SHQ score for bilateral CI users was 59.2. Compared with different CI profiles (CI, CI + hearing aid, hybrid), subjective spatial hearing ability rated higher for the bilateral and short-electrode CI users.
Correlation of SHQ and SSQ Scores and Word Recognition and Localization Over Time
In this study, we observed that subjects showed substantial improvement in word recognition and localization over the first 1–12 months postimplantation. Major improvement occurred within 6 months, and for some subjects, the improvement extended to 24 months. This is consistent with earlier work that showed the majority of CI+CI patients showed improvement in speech perception and localization in 6 months (Buss et al., 2008; Chang et al., 2010; Hamzavi, Baumgartner, Pok, Franz, & Gstoettner, 2003; Litovsky et al., 2006; Välimaa, Määttä, Löppönen, & Sorri, 2002).
The present study showed that both SSQ and SHQ scores were consistent with word recognition and localization performances. We compared both SSQ and SHQ (overall and speech and localization factor scores) with word recognition and localization scores of the same patients from preimplantation to 24 months postimplantation, and they showed high correlations (p < .05). Thus, we conclude that both questionnaires document changes in spatial hearing abilities and speech perception in spatially separate noise and localization.
Of the 19 subjects, one subject's questionnaire results were not consistent with objective results. Her SHQ and SSQ scores were high, and her CNC scores were very low before and after implantation. This might indicate that the patient believed it was easier to communicate in real-life quiet situations than those we predicted by traditional laboratory measures. One possible explanation for this is that people speak slowly or repeat items when they talk to listeners with hearing impairment, which helps listeners understand and respond. It is also likely that the context of the communication situation facilitates speech understanding. Questionnaires have been developed for this purpose to more specifically report the situations faced by listeners with hearing impairment. Thus, questionnaire results may not be consistent with laboratory tests. There are large individual differences in the performances. To better characterize the degree of handicap and to assess spatial hearing, it is important to combine the subjective and objective results.
Correlations of SSQ and SHQ
The SHQ and SSQ were designed to assess subjects' spatial hearing abilities. Compared to the SSQ, which includes a subscale on spatial hearing as well as general questions about hearing ability, the SHQ focuses specifically on spatial hearing ability. The SHQ also assesses subjective hearing ability using stimuli with different frequency content (e.g., male voices vs. children's voices). The questions on the SSQ have more detail. The SHQ has fewer questions and requires less time to administer. Despite the differences, the present study shows a high degree of correlation between SHQ and SSQ overall scores and speech factor scores as well as localization factor scores.
Acknowledgments
This research was supported by National Institutes of Health Program Project Grant P50 DC 00242 (awarded to Bruce Gantz), Beijing Municipal Commission of Education Foundation Grant KZ201410025027 (awarded to Ningyu Wang), and Capital Health Research and Development of Special in China Grant 2011200302 (awarded to Ningyu Wang). We thank Dan Younkin for proofreading the article.
Funding Statement
This research was supported by National Institutes of Health Program Project Grant P50 DC 00242 (awarded to Bruce Gantz), Beijing Municipal Commission of Education Foundation Grant KZ201410025027 (awarded to Ningyu Wang), and Capital Health Research and Development of Special in China Grant 2011200302 (awarded to Ningyu Wang).
References
- Akeroyd M. A., Guy F. H., Harrison D. L., & Suller S. L. (2014). A factor analysis of the SSQ (Speech, Spatial, and Qualities of Hearing Scale). International Journal of Audiology, 53, 101–114. [DOI] [PMC free article] [PubMed] [Google Scholar]
- Arndt S., Aschendorff A., Laszig R., Beck R., Schild C., Kroeger S., … Wesarg T. (2011). Comparison of pseudobinaural hearing to real binaural hearing rehabilitation after cochlear implantation in patients with unilateral deafness and tinnitus. Otology & Neurotology, 32, 39–47. [DOI] [PubMed] [Google Scholar]
- Barco A. L. (2008). Multicenter U.S. bilateral MED-EL cochlear implantation study: Speech perception over the first year of use. Ear and Hearing, 29, 20–32. [DOI] [PubMed] [Google Scholar]
- Buss E., Pillsbury H. C., Buchman C. A., Pillsbury C. H., Clark M. S., Haynes D. S., … Barco A. L. (2008). Multicenter U.S. bilateral MED-EL cochlear implantation study: speech perception over the first year of use. Ear and Hearing, 29, 20–32. [DOI] [PubMed] [Google Scholar]
- Chang S.-A., Tyler R., Dunn C., Ji H., Witt S., Gantz B., & Hansen M. (2010). Performance over time on adults with simultaneous bilateral cochlear implants. Journal of the American Academy of Audiology, 21, 35–43. [DOI] [PMC free article] [PubMed] [Google Scholar]
- Desmet J. B., Wouters K., De Bodt M., & Van de Heyning P. (2012). Comparison of 2 implantable bone conduction devices in patients with single-sided deafness using a daily alternating method. Otology & Neurotology, 33, 1018–1026. [DOI] [PubMed] [Google Scholar]
- Dunn C. C., Tyler R. S., & Witt S. A. (2005). Benefit of wearing a hearing aid on the unimplanted ear in adult users of a cochlear implant. Journal of Speech, Language, and Hearing Research, 48, 668–680. [DOI] [PubMed] [Google Scholar]
- Gantz B. J., Tyler R. S., Rubinstein J. T., Wolaver A., Lowder M., Abbas P., … Preece J. P. (2002). Binaural cochlear implants placed during the same operation. Otology & Neurotology, 23, 169–180. [DOI] [PubMed] [Google Scholar]
- Gatehouse S., & Noble W. (2004). The Speech, Spatial and Qualities of Hearing Scale (SSQ). International Journal of Audiology, 43, 85–99. [DOI] [PMC free article] [PubMed] [Google Scholar]
- Grantham D. W., Ashmead D. H., Ricketts T. A., Labadie R. F., & Haynes D. S. (2007). Horizontal-plane localization of noise and speech signals by postlingually deafened adults fitted with bilateral cochlear implants. Ear and Hearing, 28, 524–541. [DOI] [PubMed] [Google Scholar]
- Hamzavi J., Baumgartner W. D., Pok S. M., Franz P., & Gstoettner W. (2003). Variables affecting speech perception in postlingually deaf adults following cochlear implantation. Acta Oto-Laryngologica, 123, 493–498. [DOI] [PubMed] [Google Scholar]
- Hassepass F., Schild C., Aschendorff A., Aschendorff A., Laszig R., Laszig R., … Arndt S. (2013). Clinical outcome after cochlear implantation in patients with unilateral hearing loss due to labyrinthitis ossificans. Otology & Neurotology, 34, 1278–1283. [DOI] [PubMed] [Google Scholar]
- Heo J. H., Lee J. H., & Lee W. S. (2013). Bimodal benefits on objective and subjective outcomes for adult cochlear implant users. Korean Journal of Audiology, 17, 65–73. [DOI] [PMC free article] [PubMed] [Google Scholar]
- Kuk F., Korhonen P., Lau C., Keenan D., & Norgaard M. (2013). Evaluation of a pinna compensation algorithm for sound localization and speech perception in noise. American Journal of Audiology, 22, 84–93. [DOI] [PubMed] [Google Scholar]
- Laske R. D., Veraguth D., Dillier N., Binkert A., Holzmann D., & Huber A. M. (2009). Subjective and objective results after bilateral cochlear implantation in adults. Otology & Neurotology, 30, 313–318. [DOI] [PubMed] [Google Scholar]
- Litovsky R., Parkinson A., Arcaroli J., & Sammeth C. (2006). Simultaneous bilateral cochlear implantation in adults: Multicenter clinical study. Ear and Hearing, 27, 714–731. [DOI] [PMC free article] [PubMed] [Google Scholar]
- Moon I. J., Byun H., Jin S. H., Kwon S., Chung W. H., Hong S. H., … Cho Y. S. (2014). Sound localization performance improves after canaloplasty in unilateral congenital aural atresia patients. Otology & Neurotology, 35, 639–644. [DOI] [PubMed] [Google Scholar]
- Noble W., Tyler R. S., Dunn C. C., & Bhullar N. (2009). Younger- and older-age adults with unilateral and bilateral cochlear implants: Speech and spatial hearing self-ratings and performance. Otology & Neurotology, 30, 921–929. [DOI] [PMC free article] [PubMed] [Google Scholar]
- Perreau A. E., Ou H., Tyler R., & Dunn C. (2014). Self-reported spatial hearing abilities across different cochlear implant profiles. American Journal of Audiology, 23, 374–384. [DOI] [PMC free article] [PubMed] [Google Scholar]
- Perreau A. E., Spejcher B., Ou H., & Tyler R. (2014). The Spatial Hearing Questionnaire: Data from individuals with normal hearing. American Journal of Audiology, 23, 173–181. [DOI] [PubMed] [Google Scholar]
- Potvin J., Kleine Punte A., & Van de Heyning P. (2011). Validation of the Dutch version of the Spatial Hearing Questionnaire. B-ENT, 7, 235–244. [PubMed] [Google Scholar]
- Tavora-Vieira D., Marino R., Krishnaswamy J., Kuthbutheen J., & Rajan G. P. (2013). Cochlear implantation for unilateral deafness with and without tinnitus: A case series. The Laryngoscope, 123, 1251–1255. [DOI] [PubMed] [Google Scholar]
- Tillman T. W., & Carhart R. (1966). An expanded test for speech discrimination utilizing CNC monosyllabic words: Northwestern University Auditory Test No. 6 [Technical report]. Brooks Air Force Base, TX: U.S. Air Force School of Aerospace Medicine. [DOI] [PubMed] [Google Scholar]
- Tyler R. S., Gantz B. J., Rubinstein J. T., Wilson B. S., Parkinson A. J., Wolaver A., … Lowder M. W. (2002). Three-month results with bilateral cochlear implants. Ear and Hearing, 23(Suppl. 1), 80S–89S. [DOI] [PubMed] [Google Scholar]
- Tyler R. S., Noble W., Dunn C., & Witt S. (2006). Some benefits and limitations of binaural cochlear implants and our ability to measure them. International Journal of Audiology, 45(Suppl. 1), S113–S119. [DOI] [PubMed] [Google Scholar]
- Tyler R. S., Perreau A. E., & Ji H. (2009). Validation of the Spatial Hearing Questionnaire. Ear and Hearing, 30, 466–474. [DOI] [PMC free article] [PubMed] [Google Scholar]
- Välimaa T. T., Määttä T. K., Löppönen H. J., & Sorri M. J. (2002). Phoneme recognition and confusions with multichannel cochlear implants: Consonants. Journal of Speech, Language, and Hearing Research, 45, 1055–1069. [DOI] [PubMed] [Google Scholar]


