

Abstract
STUDY OBJECTIVES
To compare breast cancer metastases between obese and nonobese women and to evaluate the effect of first-line metastatic chemotherapy in each group.
METHOD
A retrospective study was performed in an educational institute in Ireland. The study consisted of two parts: the first part was a comparative analysis of metastases development in obese (arm A) and nonobese patients (arm B). The second part was a comparison between both arms in relation to their response to first-line metastatic chemotherapy and their survival data.
RESULTS
Between 2009 and 2014, we reviewed 118 patients with metastatic breast cancer. All the patients fulfilled our inclusion criteria. In all, 48% of patients were obese and 52% were nonobese. There were no statistically significant differences between the two groups. For arms A and B, the median interval between initial cancer diagnosis and distant metastases development (distant metastases-free survival) was 5.8 versus 7.6 years, respectively (Pvalue 0.04). Earlier visceral (liver and lung) metastases were observed in obese compared to nonobese women (Pvalues were 0.05 and 0.04, respectively). The most commonly used chemotherapy was weekly paclitaxel. Our treatments showed significantly better treatment response and better survival results in nonobese women than in obese ones, who were premenopausal with performance state 2, pathological grade 3, and four or more positive lymph nodes.
CONCLUSION
Obesity is linked with visceral metastases development, especially lung and liver metastases. Furthermore, first-line metastatic chemotherapy achieved better results in nonobese patients.
Keywords: obesity, visceral, paclitaxel, ORR, PFS, OS
Introduction
As of 2015, there are an estimated 700 million obese people worldwide. In the USA, the prevalence of obesity is 32% among adult individuals, while it ranges from 13 to 24% in Europe. The Multinational Monitoring of trends and determinants in Cardiovascular disease (MONICA) project, sponsored by the World Health Organization (WHO), showed that 30% of population in the Arab World are overweight or obese.1–3
The WHO defines obesity as a body mass index (BMI) of ≥30 (Kg/m2). Overweight is defined as a BMI of 25.0–29.9.4
Obesity is linked with the development of several cancer types, including esophageal, pancreatic, colon, breast, endometrial, ovarian, gall bladder, and kidney cancers.5,6
Studies showed that obese breast cancer patients are more likely to develop larger primary tumor, higher grade pathology, and more lymph node–positive disease.7
Furthermore, recent studies showed that obesity is linked with the development of metastases in women with breast cancer.7,8
Ewertz et al. also observed that both chemotherapy and endocrine therapy are less potent in obese patients compared with nonobese ones.7
A recent report on early breast cancer by Pan et al. showed that obesity appeared to be strongly and independently associated with breast cancer mortality in pre/perimenopausal breast cancer patients.9
Other reports demonstrated that the relationship between obesity and breast cancer may be affected by the stages of life in which a woman gains weight and becomes obese. Epidemiologists are actively working to address this issue. Weight gain during adult life, most often from about age 18 to between the ages of 50 and 60 years, has been consistently associated with a higher risk of breast cancer after menopause.10
The relation between obesity and the development of breast cancer may also vary by race and ethnicity. There is limited evidence to confirm whether the risk associated with being overweight or obese may be less among African American and Hispanic women than among white women.10,11
Study Objectives
The objectives of this study are to compare the development of breast cancer metastases in obese and nonobese women and to evaluate the effect of first-line metastatic chemotherapy in each group in terms of treatment response and survival benefit.
Primary end points
The primary end points were breast cancer metastases, distant metastases-free survival (DMFS), and the response to first-line metastatic chemotherapy.
Secondary end points
The secondary end points were progression-free survival (PFS) and overall survival (OS).
Study Design
This is a retrospective study. The research was approved by the Health Service Executive (HSE) North East Research Ethics Committee.
Participating institute
This study was performed in Our Lady of Lourdes Hospital, Drogheda, Republic of Ireland.
Eligibility criteria
Inclusion criteria
The inclusion criteria of the current study are patients should be aged between 18 and 70 years, have an Eastern Cooperative Oncology Group performance status ≤2, and have a pathologically proven primary invasive breast cancer with concurrent or subsequent development of distant metastases. In addition, they should have initial pathology: tumors ≥1.0 cm in the largest diameter and positive hormone receptor status (estrogen receptor [ER] and/or partial remission [PR]), including either positive or negative human epidermal growth factor receptor 2 (HER2)/neu.
For the second part of the study, patients must have adequate bone marrow reserve and renal and liver functions for chemotherapy. Patients may be chemonaive or received chemotherapy as part of their adjuvant treatment. They should not have received any prior chemotherapy in the metastatic setting.
Exclusion criteria
Patients who did not fit with the above-mentioned criteria were excluded. Furthermore, patients who had locoregional recurrence, multiple comorbidities, or poor performance status were excluded from the second part of the study.
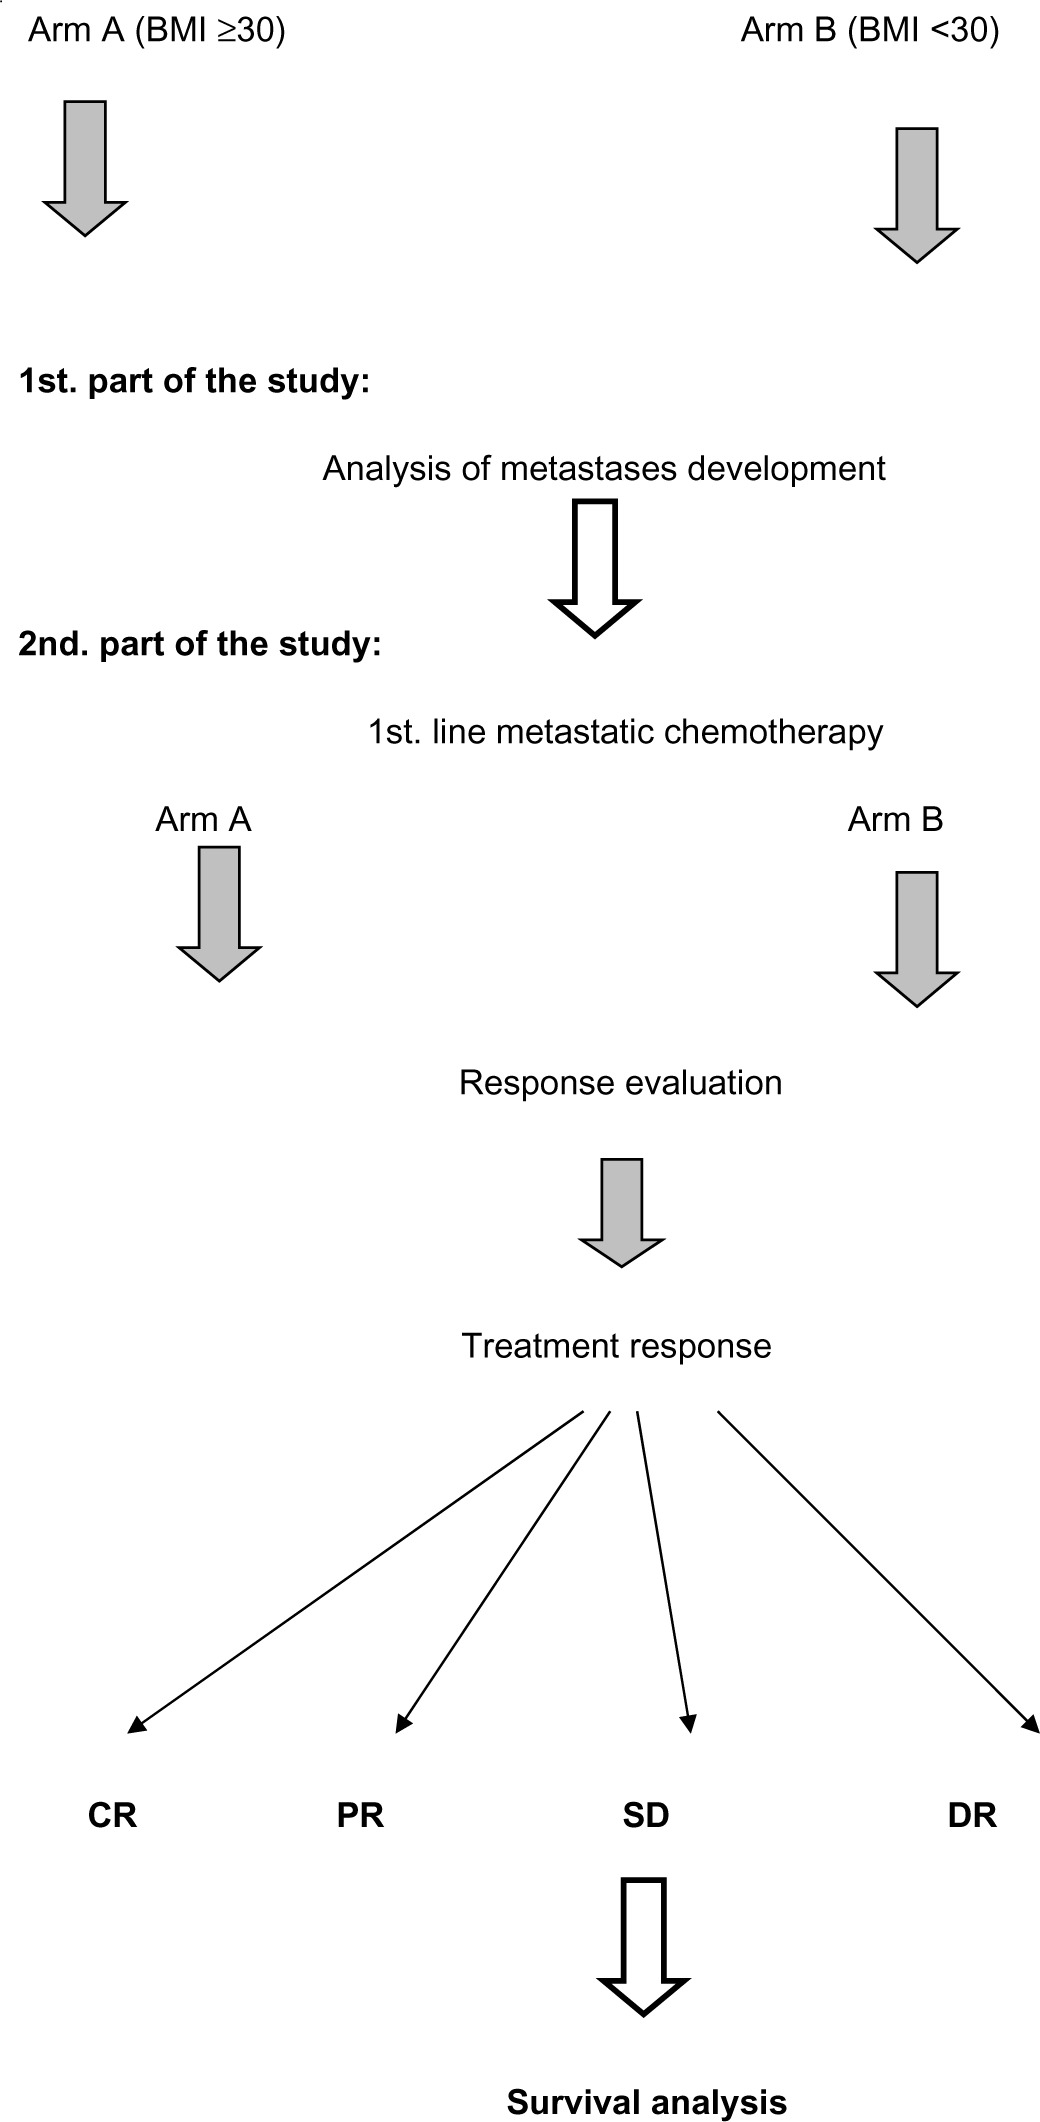
The study design is shown in Table 1, and the study consists of two parts.
Table 1.
Study design.
|
The first part is a comparative analysis of metastases development of breast cancer in obese (arm A) and nonobese patients (arm B).
Obesity was defined as a BMI of ≥30. The non-obese group included patients with a BMI <30, including overweight patients.
The second part is a comparison between arm A (obese) and arm B (nonobese) in relation to their response to first-line metastatic chemotherapy and their survival.
Response definitions
The following definitions are employed Response Evaluation Criteria In Solid Tumors (RECIST 1.1):
Complete response (CR) is defined as disappearance of all measurable lesions.
PR is defined as ≥30% reduction in the size of all measurable lesions.
Disease progression (DP) is defined as ≥20% increase in the size of all measurable lesions or appearance of new lesions on computed tomography or magnetic resonance imaging.
Stable disease (SD) is defined as all other situations.12
Objective response rate (ORR) was defined as CR plus PR.
DMFS was checked from the initial cancer diagnosis or the first clinic visit till the time of distant cancer development. PFS was measured from the time of metastases development till progression or censored at the last follow-up visit. OS was measured from the time of metastases development until death or censored at the last follow-up visit.
Statistical analysis
All calculations were carried out using SPSS, version 20 software for windows. Mean, median values, and 95% confidence interval (CI) were used for the description of continuous data. Survival data for each arm were analyzed by the Kaplan–Meier method and compared using the log-rank and Wilcoxon tests. For comparison between the two arms, t tests and P value were used. Cox multivariate hazard analysis was used to evaluate the effect of prespecified prognostic factors, including age, performance state, histopathological type, grade, stage, HER2 status, and the number of positive lymph nodes, ORR, PFS, and OS times of arm A in comparison with arm B. P value ≤ 0.05 was considered statistically significant.
Results
Between January 2009 and December 2014, our institute reviewed 118 patients with metastatic breast cancer. Of these patients, 77 developed distant recurrence subsequent to the treatment of early breast cancer and 41 developed de novo metastatic breast cancer. Among the patients, 56 (48%) patients were obese, 62 (52%) were nonobese, and 24 (20%) were overweight. In arms A and B, the median ages were 54 and 50 years (P value 0.08) and the median BMI values were 34 and 22 (P value 0.03), respectively.
Table 2 shows the patients’ characteristics of the two study arms.
Table 2.
Patients’ characteristics of each study arm.
| CHARACTERISTICS | ARM A (56) | ARM B (62) | P-VALUE | ||
|---|---|---|---|---|---|
| NUMBER | % | NUMBER | % | ||
| Age (At time of metastases) | |||||
| 18–<40 | 3 | 5 | 7 | 11 | 0.05 |
| 40–<51 | 11 | 20 | 19 | 31 | 0.06 |
| 51–<65 | 19 | 34 | 21 | 34 | 0.1 |
| 65–70 | 23 | 41 | 15 | 24 | 0.04 |
| Body mass index (BMI) | |||||
| <25 | 0 | 0 | 38 | 61 | – |
| 25–29.9 | 0 | 0 | 24 | 39 | – |
| ≥30% | 56 | 100 | 0 | 0 | – |
| Performance status (ECOG) | |||||
| 0 | 28 | 50 | 38 | 61 | 0.06 |
| 1 | 18 | 32 | 16 | 26 | 0.1 |
| 2 | 10 | 18 | 8 | 13 | 0.08 |
| Pathological classification | |||||
| Ductal | 52 | 92 | 53 | 85 | 0.06 |
| Lobular | 4 | 8 | 9 | 15 | 0.06 |
| Pathological grade | |||||
| 1 | 0 | 0 | 2 | 3 | 0.07 |
| 2 | 26 | 46 | 29 | 47 | 0.1 |
| 3 | 30 | 54 | 31 | 50 | 0.08 |
| Initial stage (pathological) | |||||
| I–II | 21 | 37 | 18 | 29 | 0.07 |
| III | 18 | 33 | 20 | 33 | 0.08 |
| IV | 17 | 30 | 24 | 38 | 0.05 |
| Number of positive lymph node | |||||
| 0 | 6 | 11 | 6 | 10 | 0.15 |
| 1–3 | 15 | 27 | 12 | 20 | 0.08 |
| 4–9 | 16 | 29 | 16 | 26 | 0.2 |
| >9 | 3 | 5 | 6 | 9 | 0.06 |
| Unknown | 16 | 28 | 22 | 35 | – |
| Metastases site | |||||
| Lung | 15 | 27 | 12 | 19 | 0.06 |
| Liver | 20 | 36 | 16 | 26 | 0.05 |
| Both | 5 | 9 | 3 | 5 | 0.06 |
| Brain | 7 | 12 | 6 | 10 | 0.1 |
| Bone | 4 | 7 | 20 | 32 | 0.03 |
| Bone and visceral | 5 | 9 | 5 | 8 | 0.1 |
| Receptor status | |||||
| ER +ve, PR +ve | 22 | 39 | 23 | 38 | 0.15 |
| ER +ve, PR −ve | 31 | 55 | 35 | 56 | 0.15 |
| ER−ve, PR+ve | 3 | 6 | 4 | 6 | 0.19 |
| Her 2 neu | |||||
| Positive | 20 | 35 | 22 | 36 | 0.17 |
| Negative | 36 | 65 | 40 | 64 | 0.15 |
| Invasion | |||||
| Lymphatic | 16 | 29 | 19 | 30 | 0.16 |
| Vascular/Perineural | 12 | 21 | 13 | 20 | 0.15 |
In arm A versus B, the median DMFS was 5.8 versus 7.6 years and the mean DMFS was 5.9 versus 7.7 years, respectively (range 3–11 versus 3–18 years, respectively; P value 0.04; Table 3).
Table 3.
The site of metastases and the median DMFS for each arm (years).
| METASTASES SITE | ARM A | ARM B | P VALUE | ||
|---|---|---|---|---|---|
| MEDIAN DMFS (YEARS) | RANGE (YEARS) | MEDIAN DMFS (YEARS) | RANGE (YEARS) | ||
| Lung | 5.2 | 3–11 | 7.2 | 3–18 | 0.05 |
| Liver | 5.5 | 2–10 | 7.4 | 3–15 | 0.04 |
| Brain | 4.9 | 3–6 | 5.9 | 3–9 | 0.09 |
| Bone | 6.8 | 4–11 | 7.9 | 4–18 | 0.1 |
For the second part of the study, 45 and 38 patients from arms A and B, respectively, were found to be eligible for inclusion into the study, and they underwent chemotherapy treatment. Tables 4 and 5 respectively summarize the patients’ characteristics and the details regarding chemotherapy treatment, including the median cycles administered in each arm.
Table 4.
Patients’ characteristics of each arm.
| ARM A VERSUS B VISCERAL METASTASES | ARM A VERSUS B BONE METASTASES | |||
|---|---|---|---|---|
| RR | P-VALUE | RR | P-VALUE | |
| Age | ||||
| 18–<40 | 0.7 | 0.04 | 0.9 | 0.09 |
| 40–<51 | 0.8 | 0.05 | 1.0 | 0.1 |
| 51–<65 | 0.9 | 0.07 | 1.0 | 0.1 |
| 65–70 | 1.0 | 0.1 | 1.1 | 0.1 |
| Performance status:(ECOG) | ||||
| 0 | 1.0 | 0.1 | 1.0 | 0.09 |
| 1 | 1.0 | 0.1 | 0.9 | 0.1 |
| 2 | 0.8 | 0.07 | 0.9 | 0.09 |
| Pathological classification | ||||
| Ductal | 0.8 | 0.04 | 1.1 | 0.09 |
| Lobular | 0.9 | 0.09 | 0.9 | 0.09 |
| Pathological grade | ||||
| 1 | 0 | 0 | 0 | 0 |
| 2 | 0.8 | 0.06 | 1.0 | 0.1 |
| 3 | 0.6 | 0.04 | 1.1 | 0.09 |
| Initial stage (pathological) | ||||
| I–II | 1.0 | 0.1 | 1.1 | 0.1 |
| III | 0.8 | 0.05 | 0.9 | 0.9 |
| Number of positive lymph node | ||||
| 0 | 1.0 | 0.1 | 1.2 | 0.1 |
| 1–3 | 1.0 | 0.07 | 1.1 | 0.1 |
| 4–9 | 0.8 | 0.05 | 1.0 | 0.09 |
| >9 | 0.6 | 0.01 | 0.07 | 0.04 |
| Receptor status: Her 2 neu | ||||
| Positive | 0.6 | 0.03 | 1.1 | 0.07 |
| Negative | 0.7 | 0.05 | 1.2 | 0.09 |
| Invasion | ||||
| Lymphatic | 0.7 | 0.05 | 0.8 | 0.09 |
| Vascular/Perineural | 0.8 | 0.09 | 1.0 | 0.1 |
Table 5.
Chemotherapy regimens.
| CHEMOTHERAPY REGIMENS | ARM A | ARM B | P-VALUE | ||
|---|---|---|---|---|---|
| PATIENT NUMBERS | CYCLES NUMBERS (MEDIAN) | PATIENT NUMBERS | CYCLES NUMBERS (MEDIAN) | ||
| –AC then T | 8 | 8 | 7 | 8 | 0.1 |
| –AC then TH | 4 | 17 | 4 | 17 | 0.1 |
| –Weekly paclitaxel | 22 | 10 | 15 | 10 | 0.08 |
| –Weekly paclitaxel, herceptin | 8 | 15 | 4 | 14 | 0.06 |
| –Three weekly docetaxel | 0 | – | 5 | 8 | – |
| –Others | 3 | 8 | 3 | 8 | 0.1 |
Treatment response evaluation
In arms A and B, 40 and 35 patients of the 45 and 38 chemotherapy groups underwent treatment response evaluation (89 and 92%), respectively. In arms A and B, 5 and 4 patients achieved CR,15 and 13 patients achieved PR, 12 and 11 patients had SD, and 8 and 7 patients had DP, respectively (Fig. 1).
Figure 1.

Treatment response for both arms.
The ORRs for arms A and B were 50 and 48.6%, respectively (P value 0.09; Table 6).
Table 6.
RR for ORR of arm A over arm B.
| CHARACTERISTICS | ARM A (45) | ARM B (38) | P-VALUE | ||
|---|---|---|---|---|---|
| NUMBER | % | NUMBER | % | ||
| Age (At time of metastases) | |||||
| 18–<40 | 2 | 4 | 3 | 7 | 0.09 |
| 40–<51 | 9 | 20 | 10 | 26 | 0.08 |
| 51–<65 | 16 | 36 | 14 | 37 | 0.15 |
| 65–70 | 18 | 40 | 11 | 30 | 0.06 |
| Age (median) | 53 | – | 50 | – | 0.9 |
| Body mass index (BMI) | |||||
| <25 | 0 | 0 | 22 | 58 | – |
| 25–29.9 | 0 | 0 | 16 | 42 | – |
| ≥30% | 45 | 100 | 0 | 0 | – |
| BMI (median) | 33 | – | 21 | – | 0.04 |
| Performance status (ECOG) | |||||
| 0 | 22 | 49 | 24 | 58 | 0.09 |
| 1 | 15 | 34 | 10 | 27 | 0.06 |
| 2 | 8 | 17 | 6 | 15 | 0.09 |
| Performance status (median) | 0 | – | 0 | – | 0.1 |
| Pathological classification | |||||
| Ductal | 41 | 91 | 32 | 84 | 0.06 |
| Lobular | 4 | 9 | 6 | 16 | 0.08 |
| Pathological grade | |||||
| 1 | 0 | 0 | 0 | 0 | – |
| 2 | 19 | 42 | 18 | 47 | 0.09 |
| 3 | 26 | 58 | 20 | 53 | 0.07 |
| Grade (median) | 3 | – | 3 | – | 0.1 |
| Initial stage (pathological) | |||||
| I–II | 15 | 33 | 10 | 27 | 0.06 |
| III | 14 | 31 | 13 | 34 | 0.09 |
| IV | 16 | 36 | 15 | 39 | 0.08 |
| Number of positive lymph node | |||||
| 0 | 2 | 4 | 2 | 5 | 0.1 |
| 1–3 | 13 | 29 | 8 | 21 | 0.07 |
| 4–9 | 14 | 31 | 10 | 26 | 0.08 |
| >9 | 3 | 7 | 4 | 11 | 0.06 |
| Unknown | 13 | 29 | 14 | 37 | 0.06 |
| Lymph node number (median) | 5 | – | 4.5 | 0.1 | |
| Metastases site | |||||
| Lung | 15 | 33 | 12 | 32 | 0.09 |
| Liver | 20 | 45 | 16 | 42 | 0.07 |
| Both | 5 | 11 | 3 | 8 | 0.08 |
| Bone | 1 | 2 | 2 | 5 | 0.06 |
| Bone and visceral | 4 | 9 | 5 | 13 | 0.06 |
| Receptor status: Her 2 neu | |||||
| Positive | 16 | 35 | 13 | 34 | 0.1 |
| Negative | 29 | 65 | 25 | 66 | 0.1 |
| Invasion | |||||
| Lymphatic | 14 | 31 | 18 | 47 | 0.06 |
| Vascular/Perineural | 10 | 22 | 12 | 31 | 0.06 |
Survival data
The median PFS rates for arms A and B were 16.5 and 19 months, respectively (95% CI was 7–26 and 10–28 months, respectively, P value 0.06). (Figure 2, Table 7).
Figure 2.
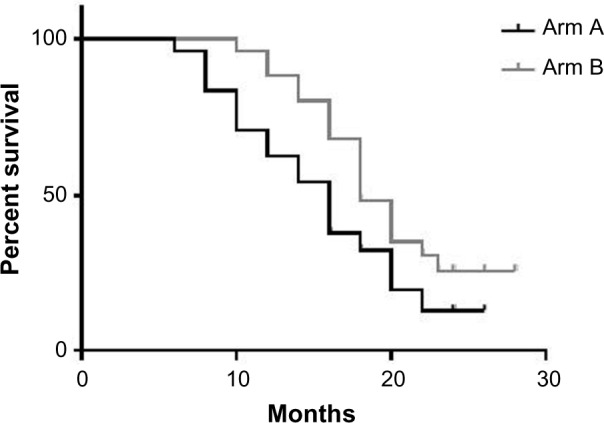
Median PFS of the two groups.
Table 7.
RR for PFS of arm A over arm B.
| RISK FACTOR | RR OF ARM A OVER B | |
|---|---|---|
| RR | P-VALUE | |
| Age | ||
| 18–<40 | 1.2 | 0.04 |
| 40–<51 | 1.1 | 0.08 |
| 51–<65 | 1.0 | 0.1 |
| 65–70 | 1.0 | 0.1 |
| Performance status (ECOG) | ||
| 0 | 1.0 | 0.1 |
| 1 | 1.0 | 0.1 |
| 2 | 0.9 | 0.09 |
| Pathological classification | ||
| Ductal | 0.8 | 0.06 |
| Lobular | 0.9 | 0.09 |
| Pathological grade | ||
| 1 | – | – |
| 2 | 1.0 | 0.1 |
| 3 | 1.0 | 0.09 |
| Initial stage (pathological) | ||
| I–II | 0.9 | 0.08 |
| III | 1.1 | 0.09 |
| Number of positive lymph node | ||
| 0 | 0.9 | 0.1 |
| 1–3 | 1.0 | 0.1 |
| 4–9 | 1.1 | 0.1 |
| >9 | 1.2 | 0.1 |
| Receptor status: Her 2 neu | ||
| Positive | 1.0 | 0.1 |
| Negative | 1.0 | 0.09 |
| Invasion | ||
| Lymphatic | 0.9 | 0.09 |
| Vascular/Perineural | 1.1 | 0.1 |
The median OS rates for arms A and B were 24.5 and 27 months, respectively (95% CI was 9–46 and 10–48+ months, respectively; P value 0.06; (Figs. 3 and Tables 8).
Figure 3.
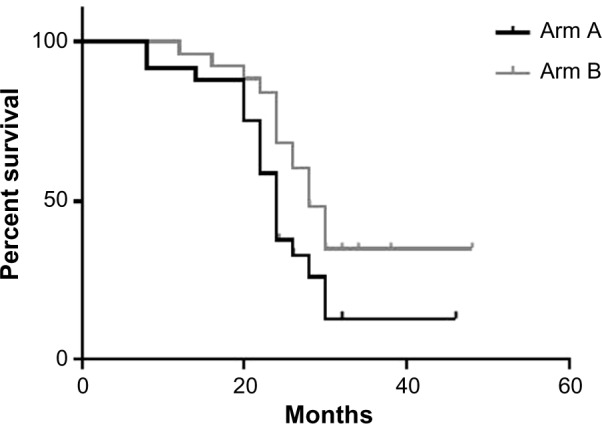
Median OS of the two groups.
Table 8.
RR for OS of arm A over arm B.
| RISK FACTOR | RR OF PFS OF ARM A OVER B | |
|---|---|---|
| RR | P-VALUE | |
| Age | ||
| 18–<40 | 1.2 | 0.05 |
| 40–<51 | 1.1 | 0.9 |
| 51–<65 | 1.0 | 0.08 |
| 65–70 | 1.0 | 0.09 |
| Performance status (ECOG) | ||
| 0 | 1.0 | 0.09 |
| 1 | 1.0 | 0.09 |
| 2 | 1.1 | 0.09 |
| Pathological classification | ||
| Ductal | 1.0 | 0.1 |
| Lobular | 0.95 | 0.06 |
| Pathological grade | ||
| 1 | – | – |
| 2 | 1.1 | 0.08 |
| 3 | 0.9 | 0.06 |
| Initial stage (pathological) | ||
| I-II | 1.1 | 0.09 |
| III | 0.9 | 0.08 |
| Number of positive lymph node | ||
| 0 | 1.0 | 0.15 |
| 1–3 | 1.0 | 0.1 |
| 4–9 | 1.1 | 0.09 |
| >9 | 1.2 | 0.07 |
| Receptor status: Her 2 neu | ||
| Positive | 1.0 | 0.09 |
| Negative | 1.1 | 0.08 |
| Invasion | ||
| Lymphatic | 1.0 | 0.09 |
| Vascular/Perineural | 1.1 | 0.08 |
Discussion
It is increasingly recognized that obesity and breast cancer are linked. Additionally, obesity increases breast cancer mortality as demonstrated in three large population-based cohort studies.13,14
Studies have shown that adjuvant chemotherapy in obese patients is well tolerated and the dose increases proportionally to weight without conferring a higher risk for toxicity. Nevertheless, adjuvant undertreatment of obese patients, if chemotherapy is not strictly weight based, is increasingly recognized as an important factor in early relapse.15,16
Ewertz et al.7 showed that adjuvant chemotherapy and endocrine therapies are less effective in obese patients, especially after 10 years from the diagnosis, compared with non-obese patients. These differences in the adjuvant setting were attributed to undertreatment of obese women.7
Other studies showed that endocrine treatment was less efficient in obese breast cancer patients. In one study, anastrozole was associated with a significantly higher recurrence rate in obese compared with nonobese postmenopausal patients.8
Studies have also shown that breast cancer was more likely to be discovered at an advanced stage in obese patients.17–19 Several recent reports have shown that obesity is linked with metastases development. A recent American Society of Clinical Oncology 2014 abstract included data from 70 clinical trials among 60,000 patients with ER-positive metastatic disease, in which the authors reported that BMI was significantly associated with breast cancer mortality in premenopausal women with ER-positive tumors. Obese women were found to have a 34% higher risk of dying from breast cancer.9
Another retrospective analysis by Ewertz et al.7 including more than 18,000 patients showed that 46% of them received chemotherapy, 19% received both chemotherapy and endocrine therapy (mainly tamoxifen), 17% endocrine therapy alone (mainly tamoxifen), and 18% received no adjuvant therapy. The patients were observed for a long follow-up period, up to 30 years. The authors observed that obesity was significantly linked with higher rates of metastases and cancer-specific mortality.7 Additionally, a study by Sestak et al.8 has shown that obesity was significantly linked with metastases development (liver, lung, and bone).8
Several biological mechanisms explain the worse prognosis in obese breast cancer patients compared with nonobese patients. Probably, the increased level of estrogen in obese women is a major cause. Estrogen is produced by the ovaries, the adipose tissue, and to a less extent by the adrenal gland. Because obese women have more fat tissue, their estrogen levels are higher, potentially leading to more rapid growth and more aggressive behavior of estrogen-responsive breast tumors.10
In addition, obesity is associated with low levels of sex hormone-binding globulin that decreases estrogen activity. Further, obesity leads to insulin resistance with subsequent hyperinsulinemia. Studies showed that hyperinsulinemia was associated with a higher risk of distant recurrences and increased mortality. Insulin can also stimulate the synthesis of insulin growth factor-1, which has multiple effects that have been linked to tumor growth and metastasis in several malignancies, including breast cancer.20–22
Further, obesity leads to subclinical inflammation with large amount of proinflammatory mediators, such as tumor necrosis factor beta, interleukin-1, and interleukin-6, which further lead to insulin resistance and cancer aggressiveness.21,23,24
Adipocytes also secrete the adipokines leptin and adiponectin. Obese women have a high level of plasma leptin. On the contrary, they have less adiponectin levels. Leptin exerts the following actions: it stimulates the growth of breast cancer via signaling through the receptors that are overexpressed in breast malignancies; it promotes the transcription of aromatase enzyme with a subsequent rise in the level of serum estrogen. Furthermore, studies showed that leptin overexpression in breast cancer was associated with a high mortality due to breast cancer.
Low levels of serum adiponectin contribute to insulin resistance. Several studies have confirmed an inverse relationship between adiponectin and the risk of developing several malignancies, including breast cancer.21,22,25,26
Till date, few studies have examined the link between obesity and prognosis in patients with metastatic breast cancer. In fact, the present study is among the first reports to explore these research aspects. Moreover, to our knowledge, this is the first report to show the effect of chemotherapy in metastatic breast cancer upon progression, although the sample size is quite small.
Our patients fulfilled the inclusion criteria, and there were no statistically significant differences between the two groups.
This study showed that obesity was linked with the development of metastases in premenopausal patients and in particular with the development of liver, lung, and brain metastases. The difference was found to be statistically significant for liver and lung. For brain metastases, the result was not statistically significant, as shown in Tables 3 and 9. The studies by Ewertz et al.7, Sestak et al.8, and Pan et al.9, confirmed our results in terms of the link between obesity and the development of liver and lung metastases. Further studies are required to determine whether there is a definite link between obesity and the development of brain metastases.
Table 9.
RR for visceral metastases (lung, liver, and brain) and bone metastases in arm A versus arm B.
| RISK FACTOR | RR OF OS OF ARM A OVER B | |
|---|---|---|
| RR | P-VALUE | |
| Age | ||
| 18–<40 | 1.2 | 0.05 |
| 40–<51 | 1.1 | 0.06 |
| 51–<65 | 1.0 | 0.09 |
| 65–70 | 1.0 | 0.1 |
| Performance status (ECOG) | ||
| 0 | 1.0 | 0.1 |
| 1 | 1.0 | 0.1 |
| 2 | 1.1 | 0.09 |
| Pathological classification | ||
| Ductal | 0.95 | 0.1 |
| Lobular | 1.0 | 0.09 |
| Pathological grade | ||
| 1 | – | – |
| 2 | 1.0 | 0.1 |
| 3 | 1.0 | 0.09 |
| Initial stage (pathological) | ||
| I–II | 1.0 | 0.09 |
| III | 0.86 | 0.06 |
| Number of positive lymph node | ||
| 0 | 1.0 | 0.1 |
| 1–3 | 1.0 | 0.1 |
| 4–9 | 1.1 | 0.09 |
| .9 | 1.2 | 0.06 |
| Receptor status: Her 2 neu | ||
| Positive | 1.0 | 0.1 |
| Negative | 1.0 | 0.09 |
| Invasion | ||
| Lymphatic | 1.0 | 0.1 |
| Vascular/Perineural | 1.0 | 0.1 |
Among all the chemotherapy regimens administered to our patients, the commonest regimens were weekly paclitaxel at an average dose of 80 mg/m2 with or without trastuzumab. Most of our patients were given anthracycline in the adjuvant setting, as shown in Table 2.
Our treatment results showed that there were no significant differences in the ORR in arms A and B. But subgroup analysis illustrates that better results were achieved in nonobese women who were premenopausal with performance state 2, pathological grade 3, and four or more positive lymph nodes. Further studies are required to confirm our results.
The relation between obesity and response to chemotherapy was examined in the clinical trial by Litton et al.27 The authors showed that neoadjuvant chemotherapy achieved worse results in obese patients compared with nonobese women.27
Our survival results showed that nonobese women had a better PFS and OS than obese patients. Furthermore, subgroup analysis confirmed this observation. Better survival data were observed in nonobese women who were premenopausal with performance state 2, pathological grade 3, and four or more positive lymph nodes, although our sample was small, as shown in Tables 6 and 7. Ewertz et al.7 also found that the risk of dying from breast cancer increased in obese patients compared with nonobese women. They further observed that the positive relationship between obesity and cancer-related mortality strengthened after 10 years from diagnosis in obese breast cancer patients.
Our results also showed that obese premenopausal patients had worse ORR, PFS, and OS compared with non-obese patients, as well as obese postmenopausal patients. This finding may confirm other reports that showed obesity as an independent risk factor in breast cancer. However, this aspect was not clearly analyzed in our series.28
Finally, it might be reasonable to mention that we selected our patients based on the inclusion criteria. In our institute, we apply strict criteria to accept only fit patients for chemotherapy. We do not accept either elderly patients or patients with poor performance status (>3) to avoid other confounding variables. However, we were concerned mainly with cancer metastases development in our patients who were fit for chemotherapy.
Conclusion
Obesity is linked with visceral metastases development, especially lung and liver metastases. Moreover, first-line metastatic chemotherapy achieved better results in nonobese versus obese patients. Further studies are required to confirm our results, especially the link between obesity and chemotherapy treatment response.
Acknowledgments
The abstract and part of the results of the study were presented at the European Cancer Congress (ECCO) in Vienna in 2015, and the presented abstract was subsequently published in the European Journal of Cancer’s Abstract Book for the ECCO.
Footnotes
ACADEMIC EDITOR: William C.S. Cho, Editor in Chief
PEER REVIEW: Seven peer reviewers contributed to the peer review report. Reviewers’ reports totaled 1093 words, excluding any confidential comments to the academic editor.
FUNDING: Authors disclose no funding sources.
COMPETING INTERESTS: Authors disclose no potential conflicts of interest.
Paper subject to independent expert blind peer review. All editorial decisions made by independent academic editor. Upon submission manuscript was subject to anti-plagiarism scanning. Prior to publication all authors have given signed confirmation of agreement to article publication and compliance with all applicable ethical and legal requirements, including the accuracy of author and contributor information, disclosure of competing interests and funding sources, compliance with ethical requirements relating to human and animal study participants, and compliance with any copyright requirements of third parties. This journal is a member of the Committee on Publication Ethics (COPE). Provenance: the authors were invited to submit this paper.
Author Contributions
Conceived and designed the experiments: MAO, BH. Analyzed the data: MAO, BH. Wrote the first draft of the manuscript: MAO, BH. Contributed to the writing of the manuscript: MAO, BH. Agree with manuscript results and conclusions: MAO, BH. Jointly developed the structure and arguments for the paper: MAO, BH. Made critical revisions and approved final version: MAO, BH. Both authors reviewed and approved of the final manuscript.
REFERENCES
- 1.Flegal KM, Carroll MD, Ogden CL, Curtin LR. Prevalence and trends in obesity among US adults, 1999–2008. JAMA. 2010;303:235–41. doi: 10.1001/jama.2009.2014. [DOI] [PubMed] [Google Scholar]
- 2.Peytremann-Bridevaux I, Faeh D, Santos-Eggimann B. Prevalence of overweight and obesity in rural and urban settings of 10 European countries. Prev Med. 2007;44:442–6. doi: 10.1016/j.ypmed.2006.11.011. [DOI] [PubMed] [Google Scholar]
- 3.Martorell R, Kettel K, Hughes MH. Obesity in women from developing countries, 2000. Int J Obesity. 2000;24:959–67. doi: 10.1038/sj.ijo.0801264. [DOI] [PubMed] [Google Scholar]
- 4.Haslam DW, James WP. Obesity. Lancet. 2005;366:1197–209. doi: 10.1016/S0140-6736(05)67483-1. [DOI] [PubMed] [Google Scholar]
- 5.Ballard-Barbash R, Berrigan D, Potischman N, Dowling E. Obesity and cancer epidemiology. In: Berger NA, editor. Cancer and Energy Balance, Epidemiology and Overview. New York: Springer-Verlag; New York: LLC; 2010. pp. 45–63. [Google Scholar]
- 6.Ballard-Barbash R, Hunsberger S, Alciati MH, et al. Physical activity, weight control, and breast cancer risk and survival: clinical trial rationale and design considerations. J Natl Cancer Inst. 2009;101(9):630–43. doi: 10.1093/jnci/djp068. [DOI] [PMC free article] [PubMed] [Google Scholar]
- 7.Ewertz M, Jensen M-B, Gunnarsdóttir KÁ, et al. Effect of obesity on prognosis after early-stage breast cancer. J Clin Oncol. 2011;29:25–31. doi: 10.1200/JCO.2010.29.7614. [DOI] [PubMed] [Google Scholar]
- 8.Sestak I, Distler W, Forbes JF, Dowsett M, Howell A, Cuzick J. Effect of body mass index on recurrences in tamoxifen and anastrozole treated women: an exploratory analysis from the ATAC trial. J Clin Oncol. 2010;28:3411–5. doi: 10.1200/JCO.2009.27.2021. [DOI] [PubMed] [Google Scholar]
- 9.Pan H, Gray RG, Early Breast Cancer Trialists’ Collaborative Group Effect of obesity in premenopausal ER+ early breast cancer: EBCTCG data on 80,000 patients in 70 trials. ASCO annual meting 2014, abstract number 503. J Clin Oncol. 2014;32:35. suppl; abstr 503. [Google Scholar]
- 10.Roberts DL, Dive C, Renehan AG. Biological mechanisms linking obesity and cancer risk: new perspectives. Annu Rev Med. 2010;61:301–16. doi: 10.1146/annurev.med.080708.082713. [DOI] [PubMed] [Google Scholar]
- 11.Wolin KY, Carson K, Colditz GA. Obesity and cancer. Oncologist. 2010;15(6):556–65. doi: 10.1634/theoncologist.2009-0285. [DOI] [PMC free article] [PubMed] [Google Scholar]
- 12.Eisenhauer EA, Therasse P, Bogaerts J, et al. New response evaluation criteria in solid tumours: revised RECIST guideline (version 1.1) Eur J Cancer. 2009;45:228–47. doi: 10.1016/j.ejca.2008.10.026. [DOI] [PubMed] [Google Scholar]
- 13.Calle EE, Rodriguez C, Walker-Thurmond K, Thun MJ. Overweight, obesity, and mortality from cancer in a prospectively studied cohort of U.S. N Engl J Med. 2003;348(17):1625–38. doi: 10.1056/NEJMoa021423. [DOI] [PubMed] [Google Scholar]
- 14.Reeves GK, Pirie K, Beral V, Green J, Spencer E, Bull D. Cancer incidence and mortality in relation to body mass index in the Million Women Study: cohort study. Br Med J. 2007;335(7630):1134–9. doi: 10.1136/bmj.39367.495995.AE. [DOI] [PMC free article] [PubMed] [Google Scholar]
- 15.Poikonen P, Blomqvist C, Joensuu H. Effect of obesity on the leukocyte nadir in women treated with adjuvant cyclophosphamide, methotrexate, and fluorouracil dosed according to body surface area. Acta Oncol. 2001;40(1):67–71. doi: 10.1080/028418601750071082. [DOI] [PubMed] [Google Scholar]
- 16.Greenman CG, Jagielski CH, Griggs JJ. Breast cancer adjuvant chemotherapy dosing in obese patients: dissemination of information from clinical trials to clinical practice. Cancer. 2008;112(10):2159–65. doi: 10.1002/cncr.23416. [DOI] [PMC free article] [PubMed] [Google Scholar]
- 17.Chlebowski RT, Aiello E, McTiernan A. Weight loss in breast cancer patient management. J Clin Oncol. 2002;20:1128–43. doi: 10.1200/JCO.2002.20.4.1128. [DOI] [PubMed] [Google Scholar]
- 18.Cui Y, Whiteman MK, Flaws JA, Langenberg P, Tkaczuk KH, Bush TL. Body mass and stage of breast cancer at diagnosis. Int J Cancer. 2002;98:279–83. doi: 10.1002/ijc.10209. [DOI] [PubMed] [Google Scholar]
- 19.Griggs JJ, Sorbero ME, Lyman GH. Undertreatment of obese women receiving breast cancer chemotherapy. Arch Intern Med. 2005;165:1267–73. doi: 10.1001/archinte.165.11.1267. [DOI] [PubMed] [Google Scholar]
- 20.Goodwin PJ, Ennis M, Pritchard KI, et al. Fasting insulin and outcome in early-stage breast cancer: results of a prospective cohort study. J Clin Oncol. 2002;20:42–51. doi: 10.1200/JCO.2002.20.1.42. [DOI] [PubMed] [Google Scholar]
- 21.Zhang X, Yee D. Tyrosine kinase signalling in breast cancer: insulin-like growth factors and their receptors in breast cancer. Breast Cancer Res. 2000;2:170–5. doi: 10.1186/bcr50. [DOI] [PMC free article] [PubMed] [Google Scholar]
- 22.van Kruijsdijk RC, van der Wall E, Visseren FL. Obesity and cancer: the role of dysfunctional adipose tissue. Cancer Epidemiol Biomarkers Prev. 2009;18:2569–78. doi: 10.1158/1055-9965.EPI-09-0372. [DOI] [PubMed] [Google Scholar]
- 23.Visser M, Bouter LM, McQuillan GM, Wener MH, Harris TB. Elevated C-reactive protein levels in overweight and obese adults. JAMA. 1999;282:2131–5. doi: 10.1001/jama.282.22.2131. [DOI] [PubMed] [Google Scholar]
- 24.Olefsky JM, Glass CK. Macrophages, inflammation, and insulin resistance. Annu Rev Physiol. 2010;72:219–46. doi: 10.1146/annurev-physiol-021909-135846. [DOI] [PubMed] [Google Scholar]
- 25.Ishikawa M, Kitayama J, Nagawa H. Enhanced expression of leptin and leptin receptor (OB-R) in human breast cancer. Clin Cancer Res. 2004;10:4325–31. doi: 10.1158/1078-0432.CCR-03-0749. [DOI] [PubMed] [Google Scholar]
- 26.Mantzoros C, Petridou E, Dessypris N, et al. Adiponectin and breast cancer risk. J Clin Endocrinol Metab. 2004;89:1102–7. doi: 10.1210/jc.2003-031804. [DOI] [PubMed] [Google Scholar]
- 27.Litton JK, Gonzalez-Angulo AM, Warneke CL, et al. Relationship between obesity and pathologic response to neoadjuvant chemotherapy among women with operable breast cancer. J Clin Oncol. 2008;26(25):4072–7. doi: 10.1200/JCO.2007.14.4527. [DOI] [PMC free article] [PubMed] [Google Scholar]
- 28.Widschwendter P, Friedl T, Schwentner L, et al. The influence of obesity on survival in early, high-risk breast cancer: results from the randomized SUCCESS A trial. Breast Cancer Res. 2015;17:129. doi: 10.1186/s13058-015-0639-3. [DOI] [PMC free article] [PubMed] [Google Scholar]