Summary
Background
Intracellular pH provides information on homeostatic mechanisms in neurons and glial cells. The aim of this study was to define pH of the brain of male volunteers using phosphorus magnetic resonance spectroscopy (31PMRS) and to compare two methods of calculating this value.
Material/Methods
In this study, 35 healthy, young, male volunteers (mean age: 25 years) were examined by 31PMRS in 1.5 T MR system (Signa Excite, GE). The FID CSI (Free Induction Decay Chemical Shift Imaging) sequence was used with the following parameters: TR=4000 ms, FA=90°, NEX=2. Volume of interest (VOI) was selected depending on the size of the volunteers’ brain (11–14 cm3, mean 11.53 cm3). Raw data were analyzed using SAGE (GE) software.
Results
Based on the chemical shift of peaks in the 31PMRS spectrum, intracellular pH was calculated using two equations. In both methods the mean pH was slightly alkaline (7.07 and 7.08). Results were compared with a t-test. Significant difference (p<0.05) was found between these two methods.
Conclusions
The 31PMRS method enables non-invasive in vivo measurements of pH. The choice of the calculation method is crucial for computing this value. Comparing the results obtained by different teams can be done in a fully credible way only if the calculations were performed using the same formula.
MeSH Keywords: Brain, Healthy Volunteers, Magnetic Resonance Spectroscopy
Background
Magnetic resonance spectroscopy (MRS) is a specialized noninvasive method that enables collection of data on the metabolic profile of particular organs [1]. MRS reveals the amount and spatial distribution of particular biochemical substances involved in metabolic processes in healthy or affected tissues. [2–5] This examination takes advantage of the characteristics of elements such as 1H, 31P, 19F, 13C or 23Na, when located in a magnetic field. [6] In clinical practice, only hydrogen magnetic resonance spectroscopy (HMRS) [7] is applicable. Phosphorous magnetic resonance (31PMRS) is used less frequently due to the fact that it is not a standard clinical procedure authorized by FDA, and therefore requires a consent of the bioethics committee each time used. In addition, PMRS is characterized by a long sequence time [6] and a low signal-to-noise ratio (SNR). [8] PMRS also requires special MR coils and specially designed computer programs. [9] However, PMRS provides more information than HMRS, especially as regards the energetic profile of considered areas.
In addition, an analysis for relative location of inorganic phosphate peaks (Pi) and phosphocreatine can be used for intracellular pH assessment. [10] A change in this important parameter can indicate disorders in the cellular mechanism. [11] An increase in pH is present in epilepsy and Alzheimer disease, while bipolar disorders are characterized by a lower pH level. Acidity plays a critical role in the maintenance of the correct function of the central nervous system. [11] The pH value is influenced by many metabolic and osmotic mechanisms. [12] Assessment of pH is possible as a result of an impact of Pi on the pH level of the surroundings, whereas the chemical shift of PCr has no influence on the acidity. This phenomenon is related to the fact that Pi exists as a conjugated form of dihydrogen phosphate (H2PO4−, 3.08 ppm) and hydrogen phosphate (HPO42−, 5.57 ppm). The aforementioned ions react in both directions at the same speed: H2PO4− ↔ HPO42− + H+. Thereby, the spectrum of 31PMRS shows a single mean Pi peak instead of two independent peaks. The location of the peak depends on the balance of the aforementioned reaction, therefore, it resembles the pH level.
The present study is aimed to assess brain intracellular pH in young, healthy men and to compare different methods of pH evaluation which are currently used by researchers in different countries.
Material and Methods
Control group
The study involved 35 male volunteers in the age ranging from 21 to 34 years (mean age 24.8 years). The enrolled men did not report any history of nervous system diseases or craniocerebral injuries. In addition, all patients declared that they lead a healthy lifestyle and denied tobacco use and alcohol overconsumption. They also assured that they were free of any diseases requiring medicine administration. The project was approved by the Bioethics Committee of the Collegium Medicum of the Jagiellonian University.
Study protocol
Head MRI was performed using MR 1.5 T system (Signa, GE). Before essential 31PMRS, location scanning was performed in three planes: sagittal, transverse and frontal (TE=1.7 ms, TR=70.2 ms, FA=30o, FOV=24 cm). Obtained images were used for assessment of volume of interest (VOI), that is the volume of the brain from which the spectroscopic signal is obtained. Due to the small phosphorous concentration in the human brain, VOI covered the entire brain (Figure 1). Therefore, VOI was adjusted each time according to the size of this organ in the considered individual in order to cover the largest possible volume and exclude bones at the same time. Slice thickness was constant and amounted to 8 cm, while the field of view (FOV) ranged from 11 to 14 cm (mean 12.2 cm) according to the head size. The mean volume of interest amounted to 98 cm3 (ranging from 88 to 112 cm3). In the 31PMRS sequence FID CSI was applied (Free Induction Decay Chemical Shift Imaging) with the following parameters: TR=4000 ms, FA=90o, NEX=2. Sequence time amounted to 8:47.
Figure 1.
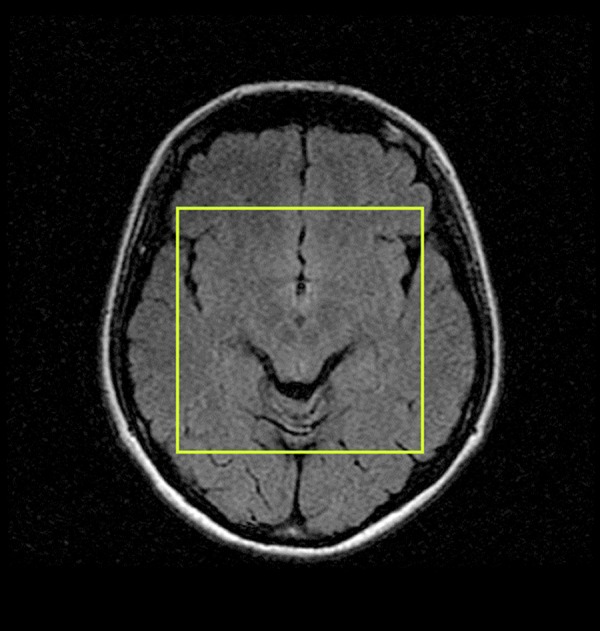
Placement of VOI in brain volume.
The examination was performed using an elastic transmit/receive coil which transmitted a signal with a frequency of 25.85 MHz. The coil was wrapped around the subject’s head.
Data analysis
Quantitative and qualitative analysis of obtained spectra was performed using specialist software called SAGE 7.0 (Spectroscopy Analysis, GE). The received signal was reconstructed and processed using the Gauss function with LB=8 Hz (line broadening). The baseline present in the spectrum was not erased; however, the phase was manually corrected (zero-order phase correction, first-order phase correction). The PCr peak, used as a reference for pH assessment, was shifted along the abscissa to the 0 ppm position. [3] This resulted in a shift of the entire spectrum.
Intracellular pH was calculated based on the chemical shift of inorganic phosphate (Pi) in relation to phosphocreatine (PCr), using two different Henderson–Hasselbalch equations:
| (1) |
| (2) |
δpi – difference in chemical shift of Pi and PCr [14].
The first equation, published by Petroff’s team, [15] is a very popular algorithm for pH calculation in the brain. [3,4,16–20] The second equation, created by a reduced team of Petroff is used just as often. [1,8,11,13,14,22,23] Those two algorithms are described most frequently in subject literature for pH assessment and are applied alternately by different research teams. In addition, many scientists developed algorithms on their own, based on conducted studies. However, due to the fact that these equations are not commonly used, they were excluded from the present analysis.
Outcomes of the data analysis were presented in the form of arithmetic means, standard deviations. Next, the statistical analysis was conducted. The results obtained using two different calculation methods were compared using Student’s t-test for dependent variables.
Results
The 31PMRS spectrum of the brain was obtained for all healthy volunteers included in the study. Based on the chemical shift of Pi in particular spectra, intracellular pH was calculated. Using equation no. 1, mean pH for the study group was assessed and amounted to 7.08±0.12 (max. pH=7.29, min. pH=6.83). Therefore, it was slightly basic. The most frequent pH results (observed in 5 cases) were 7.09 and 7.12. Using equation no. 2, the mean pH value was calculated and amounted to 7.07±0.12 (max. pH=7.26, min. pH=6.82), also slightly basic. The most frequent pH results were 7.08 and 7.11 (five cases each). Figure 2 presents evaluation of pH value coincidence rate in the considered group regarding the equation used. It is clearly visible that lower pH levels were obtained using equation no. 2 than no. 1.
Figure 2.
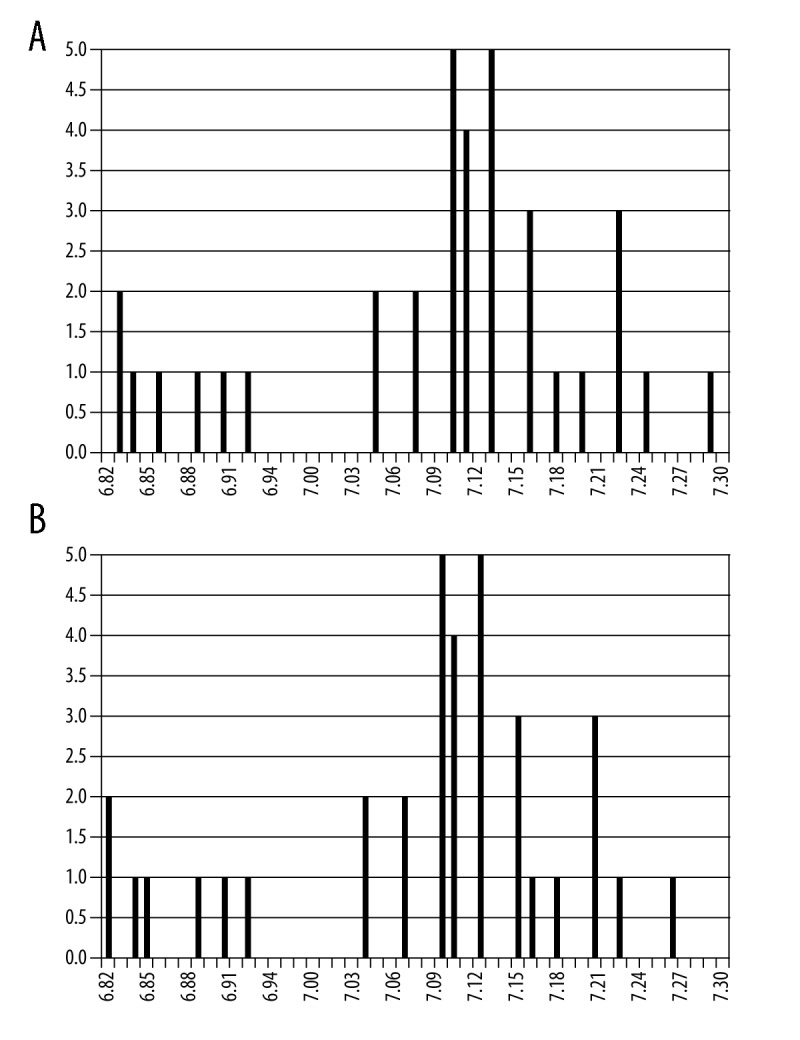
Comparison of the frequency of occurrence of pH values (A) calculated by formula (1), (B) calculated by formula (2).
The results evaluated by means of two different equations were compared using the Student’s t-test to prove that the difference is statistically significant (p<0.05). For all pH calculations a statistically significant difference was found (p=1.33E−10). Similar statistical analysis was also performed for two groups: individuals with pH <7 and pH >7. In both cases the differences were significant (pH <7: p=7.20 E−06; pH >7: p=3.73 E−12). Mean pH values calculated using both equations along with statistical significance of the differences between them were presented in Table 1. The comparison of particular pH levels using both formulas was shown in Figure 3. It was noted that the difference between pH values obtained with both methods increased proportionally to the pH value, that is, along with a rise of the chemical shift of Pi peak (Figure 4). This relationship was analyzed for the following theoretical values of chemical shift difference of PCr and Pi peaks (limited to the values obtained in the present study). These values were substituted into both formulas for pH assessment and the difference between obtained results was calculated (Figure 5). The exponential relationship was found. Along with an increase of the difference in chemical shift of those peaks, an increase of the difference in pH values, calculated using formulas no. 1 and no. 2 was observed.
Table 1.
Values of the average pH calculated using both models along with the statistical significance of the differences between them in the total examined group, subgroup of volunteers with pH <7, and a subgroup of volunteers with pH >7.
| pH calculated with equation no. 1 | pH calculated with equation no. 2 | Statistical significance | |
|---|---|---|---|
| Entire evaluated group | 7.08±0.12 | 7.07±0.12 | p=1.33E−10 |
| Subgroup with pH <7 | 6.87±0.04 | 6.87±0.04 | p=7.20E−06 |
| Subgroup with pH >7 | 7.13±0.06 | 7.12±0.06 | p=3.73E−12 |
Figure 3.
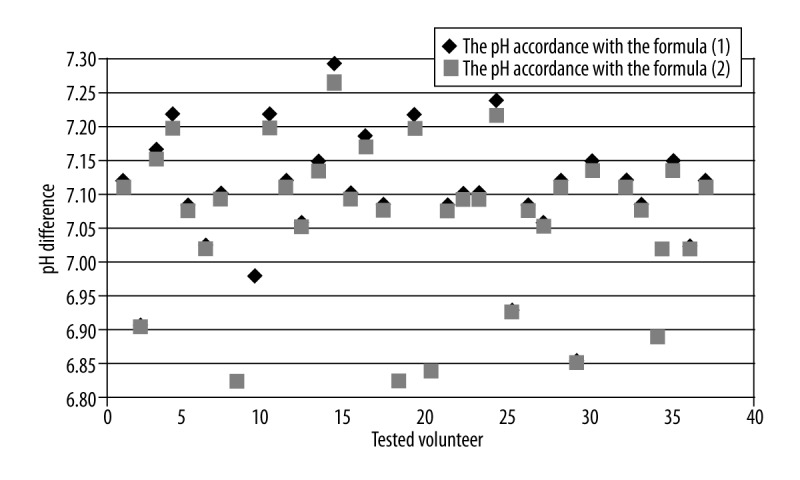
Comparison of the results of the brain pH calculation obtained using the two Hendersona-Hasselbalch models.
Figure 4.
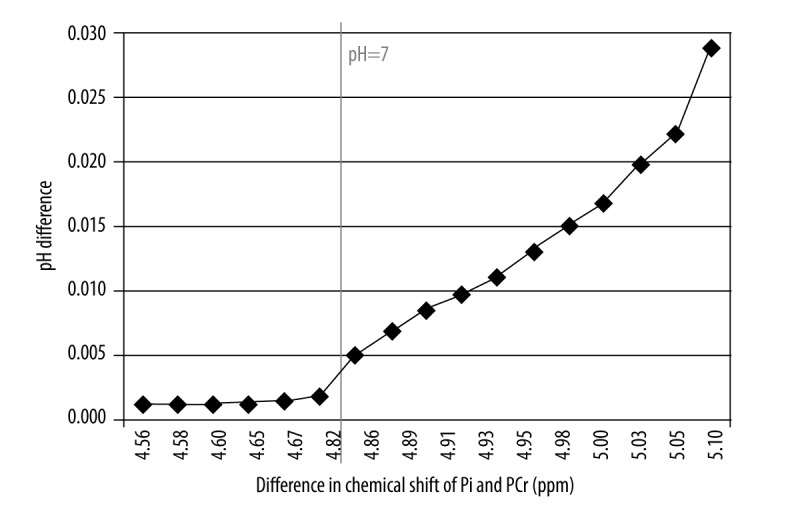
The difference in pH value calculated with formula (1) and (2) depending on the difference in chemical shift of PCr and Pi peaks for the results obtained in this examination.
Figure 5.
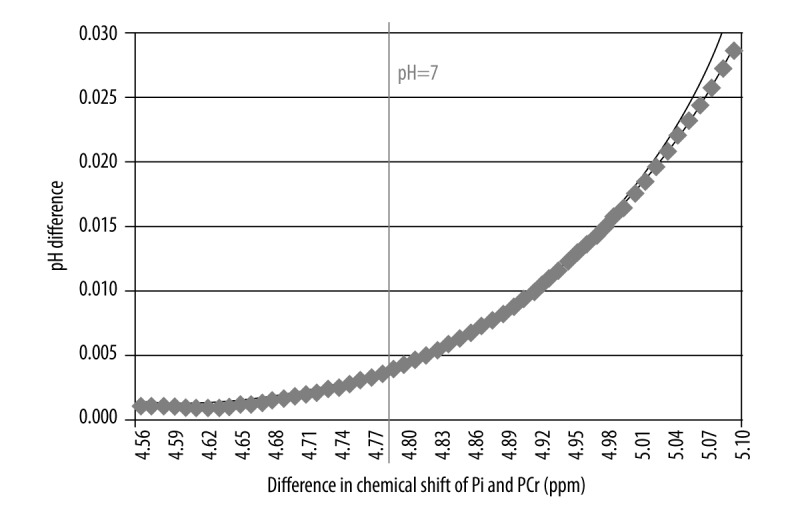
The difference in pH value calculated with formula (1) and (2) depending on the difference in chemical shift of PCr and Pi peaks for theoretical values with a trend line.
Using equation no. 1 a slightly acidic pH value (pH <7) was observed in 7 volunteers, whereas a slightly basic pH value (pH >7) was observed in 28 volunteers. Therefore, the percentage of acidic pH values (pH <7) is the same disregarding the formula used.
Discussion
The pH value might play a crucial role in the assessment of homeostatic mechanism of the nerves and glial cells, calcium transportation, disposal of metabolism waste products and bioenergetic regulation [12,20]. It is possible, because pH value is regulated by the anti-port activation on the biochemical level. Anti-ports increase or decrease mobility of Ca2+ ions and result in an increase or decrease of pH level respectively [19]. The average pH level of the brain in a healthy population, presented in subject literature by various research teams, differs but oscillates around 7 (neutral pH) and ranges from 6.96 to 7.11. [6,10,12,22] It is based on the fact that an intracellular pH level might change in the range from 0.4 to 0.8 as a result of a change in extracellular pH. These differences seem to be irrelevant but they might be clinically significant [12,13]. It is to be considered that the pH value is calculated using a logarithmic scale, therefore even small changes in pH are related to a significant difference in ion concentration [12]. Hence, knowledge of intracellular pH might be important for diagnostics.
The 31PMRS technique enables to assess the pH level in vivo for tissues located in the considered area of the brain, based on a difference in chemical shift of PCr and Pi. In the present study this difference was measured and the intracellular levels of pH were calculated using two different formulas. Both equations describing a relationship between chemical shift of metabolites and pH level, were developed experimentally by research teams through titration of phosphoric acids and they are used equivalently. Some research teams developed experimentally their own formulas for pH level assessment [25]. Unfortunately, some articles regarding pH assessment do not provide information about the formula used for calculations [25].
The current study showed that the vast majority of volunteers presented slightly basic pH in the brain and slightly acidic pH was discovered only in 7 cases, regardless of the formula used. The study also proved that the algorithm applied for pH calculation has a significant influence on the result. Therefore, the question arises if pH value assessed by means of different formulas can be directly compared. The differences between results obtained in the current study and the results of the other research teams were analyzed in the context of an equation applied for pH calculation. The pH level calculated using equation 1 amounted to 7.08; therefore, it remains within the range described in subject literature. Formula 1 was used by research teams such as the team of Mintz (pH=7.04) [3], Riehemann (pH=6.98) [19], van der Grond (pH=7.02) [30], Christensen (pH=7.09) [31], Barbirolie (pH=7.03) [32] and Forester (pH=7.00) [33]. Equation 2 was used in the present study to calculate the average pH level of 7.09. Formula 2 was also used by the research group of Barbiroli (pH = 7.04) [1], Patel (pH=7.01) [22] and Weber (pH=7.06) [14]. The pH level calculated using equation 2, similarly to the result of equation 1, remains within the range described in subject literature. As mentioned, some research teams such as the team of Urlich (pH 7.04) [26], Moller (pH=7.03) [27], Andrade (pH=7.09) [12] and Volz (pH=7.03) [29], do not include information about the equation used, in their papers. In those cases it is impossible to conduct a reliable comparison.
As presented in the current study, the pH level result is strongly influenced by the formula applied to calculations. Intensity of the magnetic field emitted by MR used for tests, also impacts indirectly the size and localization of the volume of interest. The present study used an MRI scanner with field intensity of 1.5 T, due to the fact that most of the hospitals and imaging departments are equipped with exactly these scanners. Based on the conducted studies, it is possible to assess reliable pH patterns for young, healthy individuals. The pH patterns can be used for abnormal lesion evaluation in the clinical practice. However, some obstacles are present. The usage of a 1.5 T system requires a longer examination time. Low SNR, related to the low level of phosphorous in the brain stands in need for voxels with higher volume. [6,34] The current study assessed pH in a large volume of the brain (8 cm thick voxel, FOV including the biggest possible area of the brain), as some researchers, who conducted similar MR imaging of the entire brain volume, did [6,10,12,22]. Andrade at al. calculated pH=7.09 of the entire brain using 3D chemical shift imaging [12]. Unfortunately, he did not include information regarding formula used, in his paper. Ha et al. examined the entire brain using a totally different formula (pH=7.07) and Patel et al. with formula no. 2 (pH=7.01). [22] It is relevant that many research teams assessed pH in a smaller area of the brain [4,29] which is connected with the aforementioned limitations. Hamakawa conducted a very interesting study comparing pH of the entire brain with pH levels obtained from the volume of the basal ganglia. In the first case, the SNR of the spectrum was higher and therefore, pH assessment was more precise. [10] The average pH level of the entire brain estimated by Hamakawa amounted to 6.99 (pH=7.06 for basal ganglia). Examination of local pH changes were also conducted by other researchers. Xiao-Hong et al. showed that pH of the gray matter of the brain (pH=7.06) is higher than pH of the white matter (pH=6.99). [5] Andere noted that there are significant differences in pH level between the frontoparietal cortex and semioval center [20]. Based on that fact, it can be concluded that the pH level in different brain areas varies, which can result in contradictory results obtained by particular teams. The pH levels can be reliably compared only regarding the same brain area and the same equation used.
The selection of participants is also an influencing factor for the result of pH calculation. Many of the conducted experiments included a relatively small population (<30 people), which could have a negative impact on the obtained outcomes.
Conclusions
31PMRS is an effective, noninvasive technique for pH assessment of tissue in vivo. The present study proved that the result of 31PMRS highly depends on the procedure used for data analysis. Currently, researchers use various algorithms for pH assessment although, the formula used has a statistically significant influence on obtained results. Therefore, it is necessary to use one calculation method to be able to monitor pH oscillations. In addition, the brain pH values obtained by different research groups can be reliably compared only when the same algorithm for pH calculation was used.
References
- 1.Barbiroli B, Montagna P, Martinelli P, et al. Defective brain energy metabolism shown by in vivo 31P MR spectroscopy. J Cereb Blood Flow Metab. 1993;13:469–74. doi: 10.1038/jcbfm.1993.61. [DOI] [PubMed] [Google Scholar]
- 2.Heindel W, Steinbrich W. Phosphor-NMR-Spektroskopie bei Hirntumoren. In: Schneider GH, Vogler E, editors. Digitale bildgebende Verfahren Interventionelle Verfahren Integrierte digitale. Radiologie, Berlin: Springer Verlag; 1988. pp. 3–6. [in German] [Google Scholar]
- 3.Maintz D, Heindel W, Kugel H, et al. Phosphorus-31 MR spectroscopy of normal adult human brain and brain tumours. NMR Biomed. 2002;15:18–27. doi: 10.1002/nbm.735. [DOI] [PubMed] [Google Scholar]
- 4.Mandal PK, Akolkar H, Tripathi M. Mapping of hippocampal pH and neurochemicals from in vivo multi-voxel 31P study in healthy normal young male/female, mild cognitive impairment, and Alzheimer’s disease. J Alzheimers Dis. 2012;29:1–12. doi: 10.3233/JAD-2012-120166. [DOI] [PubMed] [Google Scholar]
- 5.Zhu XH, Qiao H, Du F, et al. Quantitative imaging of energy expenditure in human brain. NeuroImage. 2012;60:2107–17. doi: 10.1016/j.neuroimage.2012.02.013. [DOI] [PMC free article] [PubMed] [Google Scholar]
- 6.Ha DH, Choi S, Oh JY, et al. Application of 31P MR Spectroscopy to the Brain Tumors. Korean J Radiol. 2013;14(3):477–86. doi: 10.3348/kjr.2013.14.3.477. [DOI] [PMC free article] [PubMed] [Google Scholar]
- 7.Wcisło B, Cichocka M, Urbanik A, et al. Phosphorus spectroscopy of calf muscles before and after exercise. Pol J Radiol. 2014;79:328–32. doi: 10.12659/PJR.890601. [DOI] [PMC free article] [PubMed] [Google Scholar]
- 8.Tavlor-Robinson SD, Marcus CD. Tissue behaviour measurements using phosphorus 31 NMR. In: Grant DM, Harris RK, editors. Encyclopedia of nuclear magnetic resonance. Chichester: John Wiley & Sons; 1996. pp. 4765–71. [Google Scholar]
- 9.Novak J, Wilson M, MacPherson L, et al. Clinical protocols for 31P MRS of the brain and their use in evaluating optic pathway gliomas in children. European J Radiol. 2014;83:106–12. doi: 10.1016/j.ejrad.2013.11.009. [DOI] [PMC free article] [PubMed] [Google Scholar]
- 10.Hamakawa H, Murashita JUN, Yamada N, et al. Reduced intracellular pH in the basal ganglia and whole brain measured by 31P-MRS in bipolar disorder. Psychiatry Clin Neurosci. 2004;58:82–88. doi: 10.1111/j.1440-1819.2004.01197.x. [DOI] [PubMed] [Google Scholar]
- 11.Shi X, Carlson PJ, Kim TS, et al. Effect of altitude on brain intracellular pH and inorganic phosphate levels. Psychiatry Res Neuroimaging. 2014;222(3):149–56. doi: 10.1016/j.pscychresns.2014.04.002. [DOI] [PMC free article] [PubMed] [Google Scholar]
- 12.Andrade CS, Otaduy MC, Valente KD, et al. Phosphorus magnetic resonance spectroscopy in malformations of cortical development. Epilepsia. 2011;52(12):2276–84. doi: 10.1111/j.1528-1167.2011.03281.x. [DOI] [PubMed] [Google Scholar]
- 13.Hamilton G, Allsop JM, Patel N, et al. Variations due to analysis technique in intracellular pH measurements in simulated and in vivo 31P MR spectra of the human brain. J Magn Reson. 2006;23:459–64. doi: 10.1002/jmri.20524. [DOI] [PubMed] [Google Scholar]
- 14.Weber WA, Dudley J, Lee JH, et al. A pilot study of alterations in high energy phosphoryl compounds and intracellular pH in unmedicated adolescents with bipolar disorder. J Affect Disord. 2013;150(3):1109–13. doi: 10.1016/j.jad.2013.04.047. [DOI] [PubMed] [Google Scholar]
- 15.Petroff OA, Prichard JW, Behar KL, et al. Cerebral intracellular pH by 31P nuclear magnetic resonance spectroscopy. Neurology. 1985;35:781–88. doi: 10.1212/wnl.35.6.781. [DOI] [PubMed] [Google Scholar]
- 16.Forester BP, Berlow YA, Harper DG, et al. Age related changes in brain energetics and phospholipid metabolism. NMR Biomed. 2010;23:242–50. doi: 10.1002/nbm.1444. [DOI] [PubMed] [Google Scholar]
- 17.McClure R, Keshavan M, Minshew NJ, et al. 31P magnetic resonance spectroscopy study of brain metabolism in schizophrenia. In: Hafner H, Gattaz WF, editors. Search for the causes of schizophrenia. Vol. 3. Berlin: Springer Berlin Heidelberg; 1995. pp. 227–51. [Google Scholar]
- 18.Riehemann S, Volz HP, Wenda B, et al. Frontal lobe in vivo 31P-MRS reveals gender differences in healthy controls, not in schizophrenics. NMR Biomed. 1999;12(8):483–89. doi: 10.1002/(sici)1099-1492(199912)12:8<483::aid-nbm589>3.0.co;2-d. [DOI] [PubMed] [Google Scholar]
- 19.Riehemann S, Hübner G, Smesny S, et al. Do neuroleptics alter the cerebral intracellular pH value in schizophrenics? – a 31P-MRS study on three diffeent patient groups. Psychiatry Res, Neuroimaging. 2002;114(2):113–17. doi: 10.1016/s0925-4927(02)00007-0. [DOI] [PubMed] [Google Scholar]
- 20.Andrade CS, Otaduy MCG, Valente KDR, et al. Widespread pH abnormalities in patients with malformations of cortical development and epilepsy: A phosphorus-31 brain MR spectroscopy study. Brain Dev. 2014;36(10):899–906. doi: 10.1016/j.braindev.2013.12.010. [DOI] [PubMed] [Google Scholar]
- 21.Petroff OAC, Prichard JW. Cerebral pH by NMR. Lancet. 1983;2:105–6. doi: 10.1016/s0140-6736(83)90088-0. [DOI] [PubMed] [Google Scholar]
- 22.Patel N, Forton DM, Coutts GA, et al. Intracellular pH measurements of the whole head and the basal ganglia in chronic liver disease: a phosphorus-31 MR spectroscopy study. Metab Brain Dis. 2000;15(3):223–40. doi: 10.1007/BF02674531. [DOI] [PubMed] [Google Scholar]
- 23.Wu RH, Liu WW, Chen YW, et al. In: Lim CT, Goh JCH, editors. Preliminary study of mapping brain ATP and brain pH using multivoxel 31P MR spectroscopy; ICBME 23, Proceedings of the 13th International Conference on Biomedical Engineering; 2009; Springer Berlin Heidelberg; 2009. pp. 362–65. [Google Scholar]
- 24.Cheng XF, Wu RH. MR-based methods for pH measurement in brain tumors: current status and clinical potential. In: Abujamra AL, editor. Diagnostic techniques and surgical management of brain tumors. New York: Intech; 2011. pp. 287–302. [Google Scholar]
- 25.Williams GD, Mosher TJ, Smith MB. Simultaneous determination of intracellular magnesium and pH from the three 31 P NMR chemical shifts of ATP. Anal Biochem. 1993;214(2):458–67. doi: 10.1006/abio.1993.1523. [DOI] [PubMed] [Google Scholar]
- 26.Ulrich M, Wokrina T, Ende G, et al. 31P-{1H} Echo-planar spectroscopic imaging of the human brain in vivo. Magn Reson Med. 2007;57:784–90. doi: 10.1002/mrm.21192. [DOI] [PubMed] [Google Scholar]
- 27.Möller HE, Ullrich K, Vermathen P, et al. In vivo study of brain metabolism in galactosemia by 1H and 31P magnetic resonance spectroscopy. Eur J Pediatr. 1995;154(2):8–13. doi: 10.1007/BF02143796. [DOI] [PubMed] [Google Scholar]
- 28.Murashita J, Kato T, Shioiri T, et al. Age-dependent alteration of metabolic response to photic stimulation in the human brain measured by 31P MR-spectroscopy. Brain Res. 1999;818(1):72–76. doi: 10.1016/s0006-8993(98)01285-2. [DOI] [PubMed] [Google Scholar]
- 29.Volz HP, Rzanny R, Riehemann S, et al. 31P magnetic resonance spectroscopy in the frontal lobe of major depressed patients. Eur Arch Psychiatry Clin Neurosci. 1998;248(6):289–95. doi: 10.1007/s004060050052. [DOI] [PubMed] [Google Scholar]
- 30.Grond J, Gerson JR, Laxer KD, et al. Regional distribution of interictal 31P metabolic changes in patients with temporal lobe epilepsy. Epilepsia. 1998;39(5):527–36. doi: 10.1111/j.1528-1157.1998.tb01416.x. [DOI] [PMC free article] [PubMed] [Google Scholar]
- 31.Christensen JD, Kaufman MJ, Levin JM, et al. Abnormal cerebral metabolism in polydrug abusers during early withdrawal: a 31P MR spectroscopy study. Magn Reson Med. 1996;35(5):658–63. doi: 10.1002/mrm.1910350506. [DOI] [PubMed] [Google Scholar]
- 32.Barbiroli B, Gaiani S, Lodi R, et al. Abnormal brain energy metabolism shown by in vivo phosphorus magnetic resonance spectroscopy in patients with chronic liver disease. Brain Res Bull. 2002;59(1):75–82. doi: 10.1016/s0361-9230(02)00839-0. [DOI] [PubMed] [Google Scholar]
- 33.Forester BP, Harper DG, Jensen JE, et al. 31Phosphorus magnetic resonance spectroscopy study of tissue specific changes in high energy phosphates before and after sertraline treatment of geriatric depression. Int J Geriatr Psychiatry. 2009;24(8):788–97. doi: 10.1002/gps.2230. [DOI] [PubMed] [Google Scholar]
- 34.Smesny S, Rosburg T, Nenadic I, et al. Metabolic mapping using 2D 31P-MR spectroscopy reveals frontal and thalamic metabolic abnormalities in schizophrenia. Neuroimage. 2007;35:729–37. doi: 10.1016/j.neuroimage.2006.12.023. [DOI] [PubMed] [Google Scholar]
- 35.Yacubian J, de Castro CC, Ometto M, et al. 31P-spectroscopy of frontal lobe in schizophrenia: alterations in phospholipid and high-energy phosphate metabolism. Schizophr Res. 2002;58(2):117–22. doi: 10.1016/s0920-9964(01)00394-2. [DOI] [PubMed] [Google Scholar]


