

Abstract
Calorie restriction (CR) is one of the most effective anti-aging interventions in mammals. A modern theory suggests that aging results from a decline in detoxification capabilities and thus accumulation of damaged macromolecules. The present study aimed to determine how short-term CR alters mRNA profiles of genes that encode metabolism and detoxification machinery in liver. Male C57BL/6 mice were fed CR (0, 15, 30, or 40%) diets for one month, followed by mRNA quantification of 98 xenobiotic processing genes (XPGs) in liver, including 7 uptake transporters, 39 phase-I enzymes, 37 phase-II enzymes, 10 efflux transporters, and 5 transcription factors. In general, 15% CR did not alter mRNAs of most XPGs, whereas 30 and 40% CR altered over half of the XPGs (32 increased and 29 decreased). CR up-regulated some phase-I enzymes (fold increase), such as Cyp4a14 (12), Por (2.3), Nqo1 (1.4), Fmo2 (5.4), and Fmo3 (346), and numerous number of phase-II enzymes, such as Sult1a1 (1.2), Sult1d1 (2.0), Sult1e1 (33), Sult3a1 (2.2), Gsta4 (1.3), Gstm2 (1.3), Gstm3 (1.7), and Mgst3 (2.2). CR feminized the mRNA profiles of 32 XPGs in livers of male mice. For instance, CR decreased the male-predominantly expressed Oatp1a1 (97%) and increased the female-predominantly expressed Oatp1a4 (11). In conclusion, short-term CR alters the mRNA levels of over half of the 98 XPGs quantified in livers of male mice, and over half of these alterations appear to be due to feminization of the liver.
Keywords: short-term CR, mice liver, xenobiotic metabolism, phase-II enzymes, feminization, mRNA profiling
INTRODUCTION
Calorie restriction (CR), defined as reduced calorie intake of a nutritious diet without causing malnutrition, is one of the most effective anti-aging interventions in various species. In addition to the first report in rats (McCay et al., 1935), CR also increases the lifespan of yeast, Drosophila, C. elegans, fish, invertebrate animals, hamsters, mice, and dogs. Moreover, CR decreases the incidence of age-related diseases, such as cardiovascular abnormalities and insulin sensitivity in nonhuman primates (Colman et al., 2009) and in humans (Fontana et al., 2004), which suggests promising life-extending effects of CR in longer-lived animals.
Genome-wide microarray analyses reveal that CR reverses a large proportion of mRNA changes that occur with aging in several tissues, including heart, liver, skeletal muscle, brain, and colon (Han et al., 2000; Lee et al., 2002; Selman et al., 2006). Although several key players (such as insulin/IGF-1, Sirtuins, FoxOs, PGC-1α, and autophagy) have been shown to be important mediators of healthy aging by CR (Martin et al., 2006; Vaquero and Reinberg, 2009; Petrovski and Das, 2010), the mechanism of how CR exerts its anti-aging effects still remains elusive.
A modern theory of aging suggests that a decline of detoxification capabilities and thus accumulation of damage to macromolecules by reactive intermediates leads to aging (Gems and McElwee, 2005). The up-regulation of phase-I and phase-II metabolizing genes, which renders broad spectrum detoxification, is proposed to be a longevity assurance mechanism. This theory was raised upon the findings in long-lived mutants of C. elegans (McElwee et al., 2004), and is supported by accumulating evidence in Drosophila (Iqbal et al., 2009) and rodents (Amador-Noguez et al., 2007; Steinbaugh et al., 2012). In alignment with this hypothesis, decreased mRNA expression of many genes in xenobiotic metabolism pathways was reported in livers of aged mice (Cao et al., 2001; Lee et al., 2011; Fu et al., 2012). However, how CR alters the mRNA expression of genes involved in xenobiotic metabolism is less studied.
Liver is the primary site of xenobiotic metabolism and detoxification, with the expression of a large number of xenobiotic processing genes (XPGs), namely uptake transporters, phase-I enzymes, phase-II enzymes, and efflux transporters. Each enzyme and transporter family has various isoforms, many of which have differential expression, substrate preference, functional activities, and possibly mechanisms of regulation (Klaassen and Lu, 2008; Aleksunes and Klaassen, 2012). Orchestrated expression of many XPGs are transcriptionally regulated by several xenobiotic-responsive transcription factors (Klaassen and Slitt, 2005). Many XPG isoforms have gender-divergent expression in liver as systemically demonstrated in our recent publication in mice (Fu et al., 2012).
Previous studies on the effect of CR on liver function have different experiment purposes of providing a global picture by genome-wide microarray (Han et al., 2000; Cao et al., 2001) or focusing on a specific pathway, such as glucose metabolism (Dhahbi et al., 1999; Luo et al., 2008) or anti-oxidant system (De Cabo et al., 2004). Discrepancies of results among various CR studies are mainly due to different species and strain of animals (Apte et al., 2002; Tsuchiya et al., 2004) or different CR feeding regimes (Selman et al., 2006; Rocha et al., 2007). The hypothesis of the present study is that CR can up-regulate the expression of many XPGs in liver. To test this, this study, for the first time to our knowledge, utilized a graded CR (0, 15, 30, or 40%) model where the same housing condition, same quality of diets, and same feeding regime are guaranteed, in order to provide with certainty which xenobiotic metabolizing enzymes and transporters have altered mRNA expression in liver during CR.
MATERIALS AND METHODS
Animal Experiments
Male C57BL/6 mice (3-month old) were purchased from Charles River Laboratories (Wilmington, MA). Mice were acclimated for one month in an AAALAC-accredited facility at the University of Kansas Medical Center, with a 14-h light/10-h dark-cycle, temperature-, and humidity-controlled environment and given ad libitum (AL) access to water. All mice were housed individually, and randomly divided into four groups, namely the AL, 15, 30, and 40% CR (n=5). The control group was given ad libitum access to purified AIN-93M diet (TD94048; Harlan Teklad, Madison, WI) throughout this study. The diet consumption of the AL (or 0% CR) group was recorded daily, and subsequently 85%, 70%, and 60% of this amount were given to 15%, 30%, and 40% CR groups, respectively, for one month. Feed was given between 17:00-18:00 daily. Body weights were recorded weekly. CR mice finished their daily feed within 2 hours after feeding. In order to prevent sudden weight loss, a gradual decrease in feed was provided to the mice one week before the start of CR feeding (Supplemental Table 1). In order to prevent malnutrition caused by insufficient intake of macronutrients or micronutrients, custom enriched diets TD110466, TD110467, and TD110468 were designed to feed 15%, 30%, and 40% CR groups respectively (Supplemental Table 2). Similar rationale of using short-term CR to recapitulate long-term effects (Cao et al., 2001; Estep et al., 2009) and designing enriched diets for CR animals (Lee et al., 2002; Barger et al., 2008; Nogueira et al., 2012) was published previously.
Four groups of mice (AL, 15%, 30%, and 40% CR) were anesthetized with pentobarbital (50 mg/kg, i.p.). After cervical dislocation of each mouse, the liver was removed, snap-frozen in liquid nitrogen, and stored at -80°C. Tissue was collected between 9:00 and 12:00 in the morning. The study was approved by the Institutional Animal Care and Use Committee at the University of Kansas Medical Center.
Total RNA Isolation
Total RNA was isolated from liver tissue using RNA Bee reagent (Tel-Test Inc., Friendswood, TX) per the manufacturer’s protocol. The concentration of total RNA in each sample was quantified spectrophotometrically at 260 nm.
Multiplex Suspension Assay
The mRNAs of genes of interest in liver were quantified by Panomics 2.0 QuantiGene Plex technology (Panomics/Affymetrix Inc., Fremont, CA). Individual gene information can be found on Panomics Web site (http://www.panomics.com) with Panel numbers 21079, 21150, 21152, 21153, 21174, 21175, and 21176. Fluorescence was analyzed using a Bio-Plex 200 system array reader with Luminex 100 X-MAP technology, and data were acquired using Bio-Plex data manager software 5.0 (Bio-Rad, Hercules, CA). The mRNA levels of target genes were normalized to Gapdh.
Reverse Transcription and Real-time PCR Analysis
Total RNA was transcribed to single-stranded cDNA using a High Capacity cDNA Reverse Transcription Kit 1001073 (Applied Biosystems, Foster City, CA), and then the cDNA products were amplified by PCR, using Power SYBR@ Green PCR Master Mix in a 7900HT Fast Real-Time PCR System (Applied Biosystems, Foster City, CA). The mRNAs of transcription factors and catechol-O-methyltransferase (Comt) were quantified by real-time PCR assays, and normalized to β-actin. The sequences of PCR primers (Integrated DNA Technologies, Coralville, IA) were detailed in Supplemental Table 3.
Statistical Analysis and Hierarchical Clustering
Data are presented as mean ± SEM. Data were analyzed by one-way ANOVA, followed by Duncan’s post-hoc test, differences being considered significant at p < 0.05 (*). Hierarchical clustering of XPGs that had mRNA changes by CR (p < 0.05, one-way ANOVA) was performed using JMP 8.0 software (SAS Institute, Cary, NC). Relative higher mRNAs are represented in red color, whereas relative lower mRNAs are in blue. The relative color intensity is not comparable between genes.
RESULTS
Effect of Graded CR on Body Weight
As expected, the body weights of CR mice were lower than AL mice, and they reached a “steady state” by the end of the one-month CR feeding (Fig. 1). It is very interesting to note that the final body weights of 15%, 30%, and 40% CR mice were 15%, 28%, and 38% lower than AL mice, respectively (Fig. 1).
Fig. 1. The Body Weight Changes by Graded CR.

Body weight was recorded weekly during this study (Day 0 represents the start for one-month CR). The curves show body weight changes in four groups of mice, namely AL, 15%, 30%, and 40% CR. Data are presented as means ± SEM of 5 mice.
The Effect of Graded CR on mRNA Changes of Uptake Transporters in Liver
Xenobiotic uptake transporters remove xenobiotics and/or their metabolites from the systemic circulation. Organic anion-transporting polypeptides (Oatps) are sodium-independent uptake transporters for a wide range of substrates, mainly amphipathic organic compounds, including bile salts, hormones and their conjugates, toxins, and various drugs (Hagenbuch and Gui, 2008). The mRNA of Oatp1a1 was decreased markedly by 30% CR (54.7%) and 40% CR (97.2%) (Fig. 2). In contrast, Oatp1a4 mRNA was increased markedly by 30% CR (462%) and 40% CR (11.3-fold) (Fig. 2). The mRNA of Oatp1b2 was not altered by CR (Fig. 2), as well as Oatp2b1 (data not shown). Organic anion transporter 2 (Oat2) mediates the uptake of various organic anions, such as 5-fluorouracil and paclitaxel (Klaassen and Lu, 2008). Oat2 mRNA was decreased by 30% CR (54.3%) and 40% CR (77.0%) (Fig. 2). Organic cation transporter 1 (Oct1) plays an important role in the uptake of cationic drugs, such as acetylcholine, acyclovir, cimetidine, and tetraethylammonium (Klaassen and Aleksunes, 2010). Oct1 mRNA was decreased by 30% CR (23.9%) and 40% CR (34.4%) (Fig. 2). Equilibrative nucleoside transporters (Ents) are sodium-independent, bidirectional facilitated carriers of endogenous nucleosides as well as cancer and antiviral nucleoside analogs (Klaassen and Aleksunes, 2010). Ent1 mRNA was increased by 30% CR (53.4%) and 40% CR (77.8%). In general, CR altered the mRNA levels of 5 of the 7 uptake transporters quantified in liver, increasing 2 (Oatp1a4 and Ent1) and decreasing 3 (Oatp1a1, Oat2, and Oct1).
Fig. 2. The mRNA changes of uptake transporters in livers by graded CR.

Data are presented as means ± SEM of 5 mice. Asterisks (*) represent statistically significant differences were considered at p < 0.05 by one-way ANOVA, followed by Duncan’s post-hoc test. The gradient filling of the triangle marks represents increased calorie restriction (CR).
The Effect of Graded CR on mRNA Changes of Phase-I Enzymes in Liver
Phase-I enzymes catalyze oxidation, reduction, and hydrolysis reactions of xenobiotics. Cytochrome P450s (P450s) are heme-containing monooxygenases. P450s involved in xenobiotic metabolism primarily belong to Cyp1, Cyp2, and Cyp3 families. Substrates for the Cyp4 family are mainly fatty acids and eicosanoids, but also include some xenobiotics (Renaud et al., 2011). The mRNA of Cyp1a1 was increased 191% by 30% CR (Fig. 3). Cyp1a2 mRNA was increased 55.3% by 15% CR, but decreased 38.1% by 40% CR. Cyp2b10 and Cyp3a11 mRNA levels were not altered by CR. Cyp4a14 mRNA was increased markedly by 30% CR (534%) and 40% CR (12.1-fold). The mRNA of cytochrome P450 reductase (Por), the electron donor to P450s, was increased by 30% CR (84.1%) and 40% CR (233%). NAD(P)H:quinone oxidoreductase 1 (Nqo1) reduces quinones to hydroquinones, and thus prevents the one electron reduction of quinones that results in free radical production. Nqo1 mRNA was increased 135% by 40% CR. In general, CR altered the mRNA levels of 5 of the 7 P450-related enzymes quantified in liver, increasing Cyp1a1, Cyp4a14, Por, and Nqo1.
Fig. 3. The mRNA changes of P450s, Por, and Nqo1 in livers by graded CR.
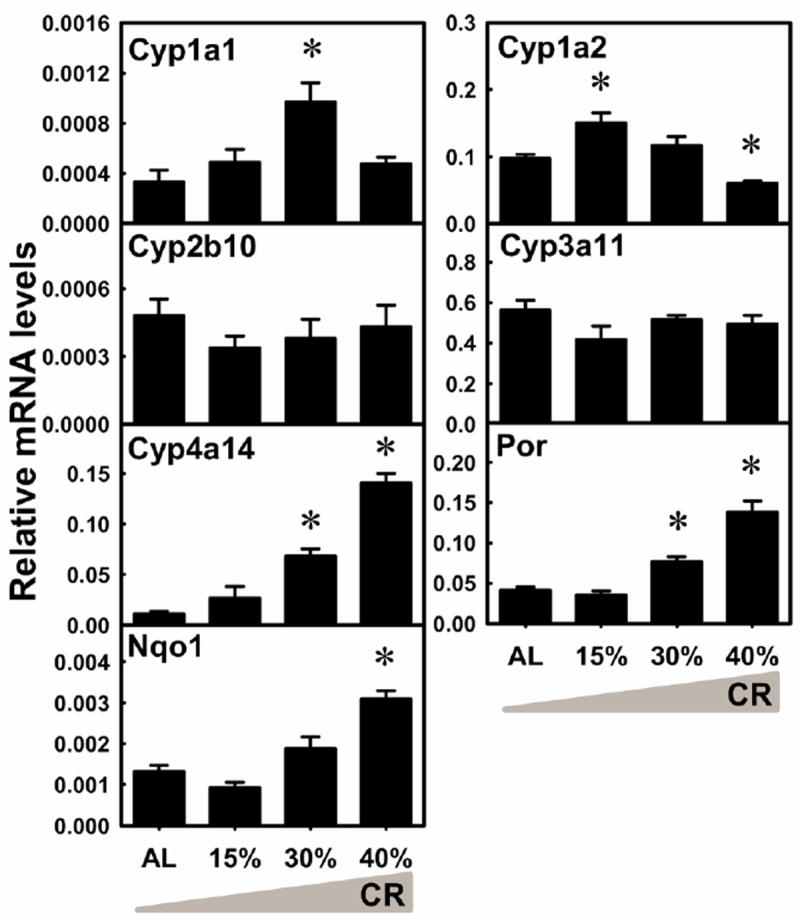
Data are presented as means ± SEM of 5 mice. Asterisks (*) represent statistically significant differences were considered at p < 0.05 by one-way ANOVA, followed by Duncan’s post-hoc test. The gradient filling of the triangle marks represents increased calorie restriction (CR).
Flavin-containing monooxygenases (Fmos) catalyze the oxidation of endobiotics, as well as a wide range of xenobiotics, including secondary and tertiary alkyl- and arylamines, many hydrazines, thiocarbamides, thioamides, sulfides, disulfides, thiols, and other soft nucleophiles (Hines et al., 1994). The mRNA of Fmo1 was decreased 33.2% by 15% CR, but increased 58.5% by 40% CR (Fig. 4). Fmo2 mRNA was increased by 30% CR (206%) and 40% CR (535%). Noticeably, Fmo3 mRNA was increased 346-fold by 40% CR. Fmo4 mRNA was increased 150% by 40% CR. Fmo5 mRNA was decreased by 15% CR (43.3%), 30% CR (38.5%), and 40% CR (26.8%). Fmo9 mRNA was decreased by 15% CR (79.9%), 30% CR (94.9%), and 40% CR (64.3%). Fmo13 mRNA level was not altered by CR. In general, CR altered the mRNA levels of 6 of the 7 Fmos quantified in liver, increasing 4 (Fmo1, 2, 3, 4) and decreasing 2 (Fmo5 and Fmo9).
Fig. 4. The mRNA changes of Fmos in livers by graded CR.

Data are presented as means ± SEM of 5 mice. Asterisks (*) represent statistically significant differences were considered at p < 0.05 by one-way ANOVA, followed by Duncan’s post-hoc test. The gradient filling of the triangle marks represents increased calorie restriction (CR).
Alcohol dehydrogenases (Adhs) and aldehyde dehydrogenases (Aldhs) are pivotal enzymes in metabolizing both endogenous and exogenous alcohols and aldehydes (Cheung et al., 2003). The mRNA of Adh1 was increased slightly by 30% CR (31.6%) and 40% CR (33.2%) (Fig. 5). Adh4 mRNA was decreased 36.3% by 40% CR. The mRNA levels of Adh5 and Adh6a were not altered by CR. Adh7 mRNA was decreased 27.9% by 15% CR. Adhfe1 mRNA was decreased 25.9% by 40% CR. As for the aldehyde dehydrogenase family, the mRNA of Aldh3a2 was decreased by 15% CR (36.4%), 30% CR (33.4%), and 40% CR (33.1%) (Fig. 6). Aldh8a1 mRNA was increased by 30% CR (79.9%) and 40% CR (85.7%). The mRNA levels of Aldh1a1, 1a7, 1b1, 2, 4a1, 6a1, 7a1, and 9a1 were not altered by CR. In general, CR had minor effects on the mRNA levels of Adhs and Aldhs.
Fig. 5. The mRNA changes of Adhs in livers by graded CR.

Data are presented as means ± SEM of 5 mice. Asterisks (*) represent statistically significant differences were considered at p < 0.05 by one-way ANOVA, followed by Duncan’s post-hoc test. The gradient filling of the triangle marks represents increased calorie restriction (CR).
Fig. 6. The mRNA changes of Aldhs in livers by graded CR.

Data are presented as means ± SEM of 5 mice. Asterisks (*) represent statistically significant differences were considered at p < 0.05 by one-way ANOVA, followed by Duncan’s post-hoc test. The gradient filling of the triangle marks represents increased calorie restriction (CR).
Carboxylesterases (Cess) are important for the hydrolysis of drugs, as well as detoxification of organophosphate and pyrethroid insecticides. The mRNA of Ces1e was decreased 37.1% by 40% CR (Fig. 7). Ces1f mRNA was decreased 46.5% by 40% CR. Ces2c mRNA was decreased markedly by 15% CR (54.3%), 30% CR (83.0%), and 40% CR (91.5%). Ces3a mRNA was decreased by 30% CR (42.3%) and 40% CR (75.5%). The mRNA levels of Ces1c, Ces1g, and Esd were not altered by CR. Paraoxonases (Pons) that catalyze the hydrolysis of organophosphates are also antioxidant enzymes that scavenge oxidized phospholipids (Marsillach et al., 2008). Pon1 mRNA was increased by 30% CR (62.3%) and 40% CR (64.5%). Pon3 mRNA level was not altered by CR. In general, CR altered the mRNA levels of 5 of the 9 Cess and Pons quantified in liver, increasing 1 (Pon1) and decreasing 4 (Ces1e, 1f, 2c, and Ces3a)
Fig. 7. The mRNA changes of Cess and Pons in livers by graded CR.
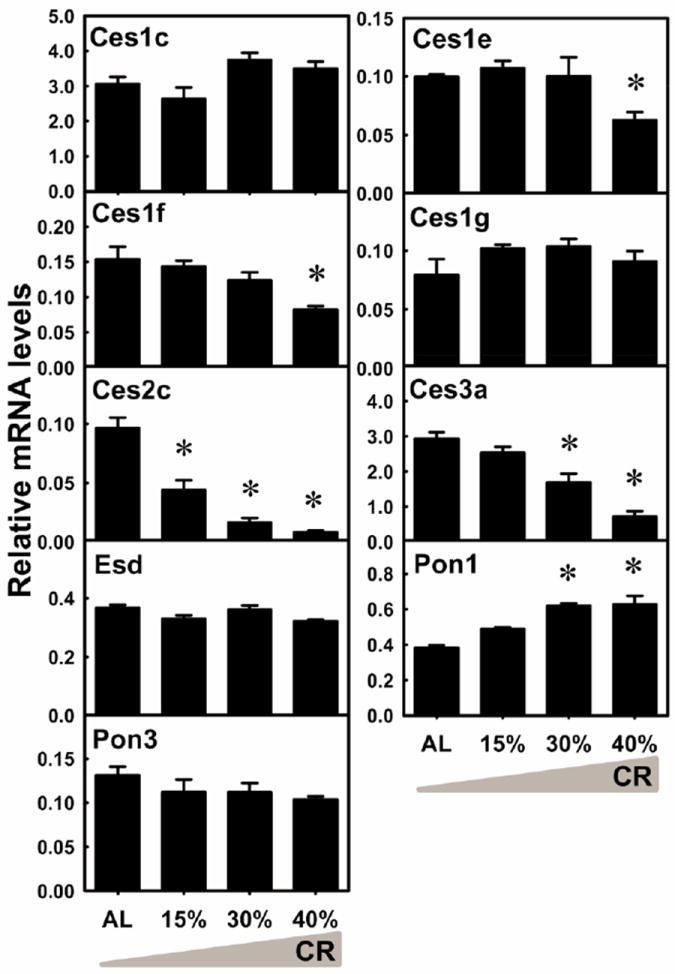
Data are presented as means ± SEM of 5 mice. Asterisks (*) represent statistically significant differences were considered at p < 0.05 by one-way ANOVA, followed by Duncan’s post-hoc test. The gradient filling of the triangle marks represents increased calorie restriction (CR).
The Effect of Graded CR on mRNA Changes of Phase-II Enzymes in Liver
Phase II reactions catalyze conjugation reactions of xenobiotics, which in general enhance the hydrophilicity of xenobiotics (except acetylation and methylation), thus favoring their excretion into bile or blood. Sulfotransferases (Sults) catalyze the conjugation of xenobiotics with sulfate. The mRNA of Sult1a1 was increased by 30% CR (84.6%) and 40% CR (123%) (Fig. 8). Sult1d1 mRNA was increased by 30% CR (126%) and 40% CR (204%). Sult1e1 mRNA was increased 33.2-fold by 40% CR. Sult2a1/2 mRNA level was not altered by CR. Sult3a1 mRNA was increased 224% by 40% CR. Sult5a1 mRNA was decreased 57.3% by 40% CR. The sulfate donor for all Sult enzymes is synthesized by two 3’-phosphoadenosine-5’-phosphosulfate synthase (Papss) enzymes. Papss1 mRNA level was not altered by CR. Papss2 mRNA was increased by 30% CR (58.3%) and 40% CR (104%). In general, CR altered the mRNA levels of 6 of the 8 Sults quantified in liver, increasing 5 (Sult1a1, 1d1, 1e1, 3a1, and Papss2) and decreasing 1 (Sult5a1).
Fig. 8. The mRNA changes of Sults and Papss in livers by graded CR.

Data are presented as means ± SEM of 5 mice. Asterisks (*) represent statistically significant differences were considered at p < 0.05 by one-way ANOVA, followed by Duncan’s post-hoc test. The gradient filling of the triangle marks represents increased calorie restriction (CR).
UDP-glucuronosyltransferases (Ugts) catalyze the conjugation reaction with glucuronic acid. The mRNA of Ugt1a1 was increased by 30% CR (36.1%) and 40% CR (73.0%) (Fig. 9). Ugt1a5 mRNA was increased by 30% CR (80.2%) and 40% CR (76.5%). Ugt1a6a mRNA was decreased by 15% CR (30.3%), 30% CR (23.3%), and 40% CR (30.3%). Ugt2b1 mRNA was decreased by 30% CR (51.0%) and 40% CR (68.5%). Ugt2b36 mRNA was decreased by 15% CR (25.6%), 30% CR (21.2%), and 40% CR (23.8%). Ugt3a1 mRNA was decreased 43.8% by 40% CR. Ugt3a2 was decreased 28.6% by 40% CR. The mRNA levels of Ugt1a9, Ugt2a3, Ugt2b34, and Ugt2b35 were not altered by CR. The co-substrate for glucuronidation, UDP-glucuronic acid, is synthesized by two sequential enzymes, namely UDP-glucose pyrophosphorylase 2 (Ugp2) and UDP-glucose 6-dehydrogenase (Ugdh). Ugp2 mRNA level was not altered by CR (data not shown). Ugdh mRNA was decreased by 15% CR (39.6%), 30% CR (38.7%), and 40% CR (50.1%). In general, CR altered the mRNA levels of 8 of the 13 Ugts quantified in liver, increasing 2 (Ugts1a1, 1a5) and decreasing 6 (Ugt1a6a, 2b1, 2b36, 3a1, 3a2, and Ugdh).
Fig. 9. The mRNA changes of Ugts and Ugdh in livers by graded CR.
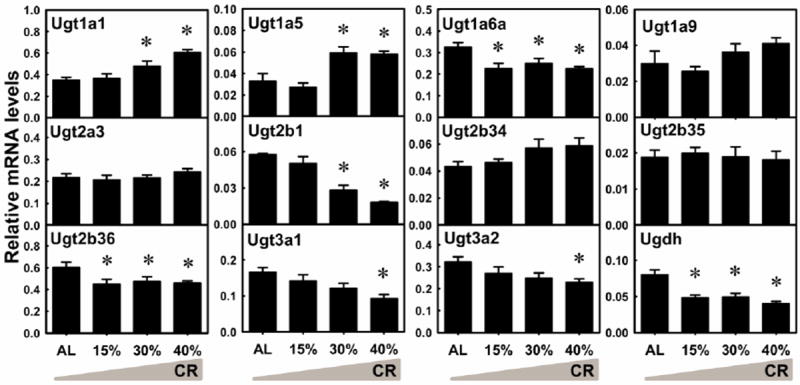
Data are presented as means ± SEM of 5 mice. Asterisks (*) represent statistically significant differences were considered at p < 0.05 by one-way ANOVA, followed by Duncan’s post-hoc test. The gradient filling of the triangle marks represents increased calorie restriction (CR).
Glutathione-S-transferases (Gsts) catalyze the conjugation of chemicals with glutathione. The mRNA of Gsta1 was increased 92.2% by 40% CR (Fig. 10). Gsta4 mRNA was increased by 30% CR (50.9%) and 40% CR (132%). Gstm1 mRNA was increased by 30% CR (37.3%) and 40% CR (38.1%). Gstm2 mRNA was increased by 15% CR (49.5%), 30% CR (139%), and 40% CR (131%). Gstm3 mRNA was increased by 30% CR (120%) and 40% CR (174%). Gstm4 mRNA was increased by 30% CR (59.4%) and 40% CR (37.7%). Gstm6 mRNA was increased by 15% CR (48.8%), 30% CR (58.8%), and 40% CR (25.6%). Gstp1 mRNA was decreased markedly by 30% CR (60.1%) and 40% CR (80.8%). Gstp2 mRNA was decreased by 30% CR (37.1%) and 40% CR (50.7%). Gstt1 mRNA was increased slightly by 30% CR (35.6%) and 40% CR (25.7%). Gstt2 mRNA was increased by 30% CR (60.5%) and 40% CR (90.6%). The mRNA of microsomal Gst Mgst1 was decreased by 15% CR (14.5%), 30% CR (25.9%), and 40% CR (41.2%). Mgst3 mRNA was increased by 15% CR (35.3%), 30% CR (151%), and 40% CR (225%). In general, CR altered the mRNA levels of all 13 Gsts quantified in liver, increasing ten (Gsta1, a4, m1, m2, m3, m4, m6, t1, t2, and Mgst3) and decreasing three (Gstp1, p2, and Mgst1).
Fig. 10. The mRNA changes of Gsts in livers by graded CR.

Data are presented as means ± SEM of 5 mice. Asterisks (*) represent statistically significant differences were considered at p < 0.05 by one-way ANOVA, followed by Duncan’s post-hoc test. The gradient filling of the triangle marks represents increased calorie restriction (CR).
N-acetyltransferases (Nats) and catechol-O-methyltransferase (Comt) catalyze conjugation reactions with acetyl and methyl groups, respectively. In contrast to the other conjugation pathways, these two pathways decrease the hydrophobicity of the substrates. The mRNA levels of Nat1 and Nat2 were not altered by CR (Fig. 11). The mRNA of Comt was decreased by 30% CR (52.2%) and 40% CR (64.6%). In general, CR decreased the mRNA levels of Comt but did not alter the expression of Nats in liver.
Fig. 11. The mRNA changes of Nats and Comt in livers by graded CR.
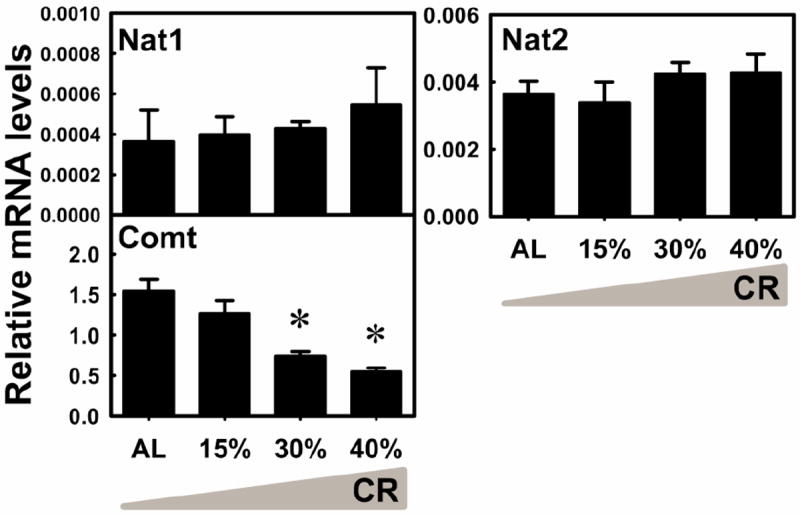
Data are presented as means ± SEM of 5 mice. Asterisks (*) represent statistically significant differences were considered at p < 0.05 by one-way ANOVA, followed by Duncan’s post-hoc test. The gradient filling of the triangle marks represents increased calorie restriction (CR).
The Effect of Graded CR on mRNA Changes of Efflux Transporters in Liver
Xenobiotic efflux transporters in liver mediate the extrusion of xenobiotics and/or their metabolites into bile or to blood. Multidrug resistance-associated protein 3 (Mrp3) is important in retro-transporting bilirubin glucuronides and bile acids back into blood, whereas breast cancer resistant protein (Bcrp) is important for transporting sulfate and glucuronide conjugates into bile. The mRNA of Mrp3 was decreased by 15% CR (38.3%), 30% CR (49.7%), and 40% CR (41.8%) (Fig. 12). Mrp6 mRNA was decreased 28.5% by 40% CR. Multidrug resistance protein 2 (Mdr2) mRNA was decreased by 30% CR (30.8%) and 40% CR (36.0%). Bcrp mRNA was decreased gradually by 15% CR (22.4%), 30% CR (53.3%), and 40% CR (67.8%). Abca1 mRNA was decreased 27.7% by 40% CR. The mRNA levels of Mrp2, Mrp4, Mate1, Abcg5, and Abcg8 were not altered by CR. In general, CR altered the mRNA levels of 5 of the 10 efflux transporters quantified in liver, decreasing Mrp3, 6, Mdr2, Bcrp, and Abca1.
Fig. 12. The mRNA changes of efflux transporters in livers by graded CR.

Data are presented as means ± SEM of 5 mice. Asterisks (*) represent statistically significant differences were considered at p < 0.05 by one-way ANOVA, followed by Duncan’s post-hoc test. The gradient filling of the triangle marks represents increased calorie restriction (CR).
The Effect of Graded CR on mRNA Changes of Transcription Factors in Liver
The expression of many XPGs are regulated by transcription factors, such as the aryl hydrocarbon receptor (AhR), constitutive androstane receptor (CAR), pregnane X receptor (PXR), peroxisome proliferator-activated receptor alpha (PPARα), and nuclear factor E2-related factor 2 (Nrf2) (Klaassen and Slitt, 2005). These transcription factors are responsive to xenobiotics and their activation leads to increased or decreased expression of various XPGs (Klaassen and Aleksunes, 2010). In order to determine the regulation of XPGs in this graded CR model, mRNA of major transcription factors were quantified in livers. The mRNA of AhR tended to be increased by 30% and 40% CR, but was not statistically significant (Fig. 13). The mRNA of CAR was increased by 30% CR (41.2%) and 40% CR (116%). The mRNA of Nrf2 was increased by 30% CR (23.2%) and 40% CR (28.1%). The mRNA levels of PXR and PPARα were not altered by CR. In general, among the transcription factors quantified, CAR and Nrf2 were the only two whose mRNA levels were increased by CR.
Fig. 13. The mRNA changes of several transcription factors in livers by graded CR.
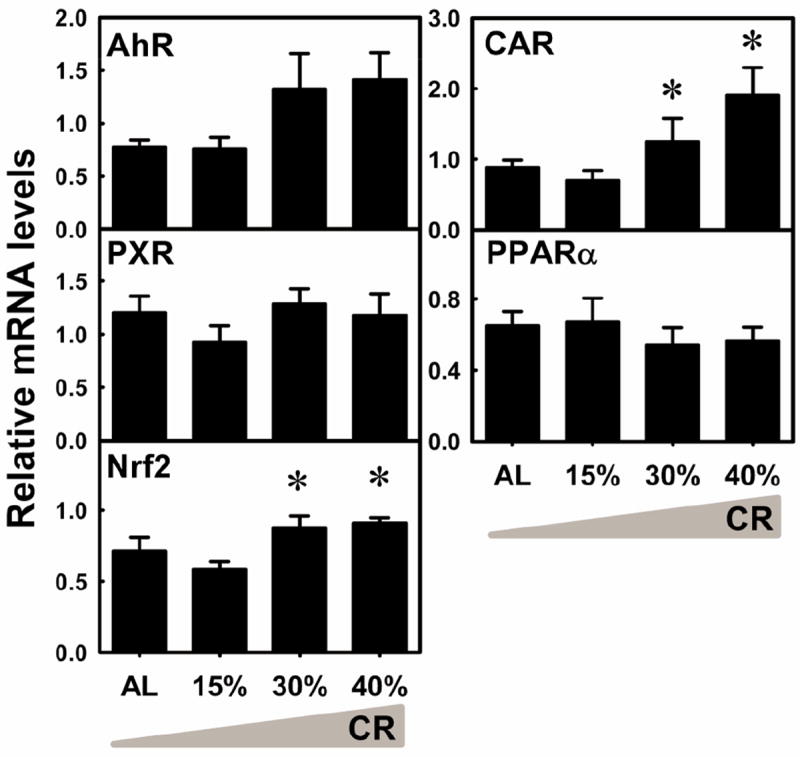
Data are presented as means ± SEM of 5 mice. Asterisks (*) represent statistically significant differences were considered at p < 0.05 by one-way ANOVA, followed by Duncan’s post-hoc test. The gradient filling of the triangle marks represents increased calorie restriction (CR).
DISCUSSION
The present study demonstrates that 15% CR does not alter the mRNA levels of most XPGs, whereas 30 and 40% CR alter over half of the XPGs (61 of 98), with 32 being increased and 29 decreased (Fig. 14). XPGs that are markedly altered by short-term CR belong to the Oatp, P450, Fmo, Sult, and Gst families.
Fig. 14. Hierarchical clustering of the mRNA profiles of XPGs in livers by graded CR.

Clustering analysis results are shown in the dendrogram, with y-axis representing the XPGs that change with graded CR (p<0.05, one-way ANOVA) and x-axis representing the graded CR (0, 15, 30, and 40%). In the heatmap, the red color represents higher abundance of mRNAs and blue lower abundance. The spectrum of each gene is standardized and specific to the scale of its own mRNA level. Therefore, it’s not valid to compare the mRNAs among different genes according to the color.
Uptake transporters Oatp1a1 and Oatp1a4 demonstrate overlapping substrate specificity in vitro, but Oatp1a4 has unique substrates such as digoxin (Klaassen and Aleksunes, 2010). Interestingly, the male-predominant Oatp1a1 and the female-predominant Oatp1a4 (Fu et al., 2012) have exact opposite regulation of mRNA expression by CR (Fig. 2), which appears to be due to feminization effects in male mice by CR.
Several P450s are up-regulated by CR. Noticeably, Cyp4a14 mRNA is increased 12-fold in the present study (Fig. 3), which is greater than the increase (2-fold) in long-lived C3B10RF1 mice with long-term CR (Cao et al., 2001), and smaller than the increase (50-fold) in 129/SV mice after 24 h starvation (Bauer et al., 2004). Various mice strains and dietary regimes probably contribute to these discrepancies. The up-regulation of Cyp4a14, a hydroxylase involved in fatty acid oxidation (Okita and Okita, 2001), reflects the increased demand for energy during CR.
Besides P450s, Fmos are also markedly altered by CR. Fmos typically make xenobiotic substrates more polar, less pharmacologically active, and more easily excreted (Cashman, 2000). Human FMO3 contributes to the metabolic clearance of a variety of drugs, such as cimetidine, nicotine, and tamoxifen, as well as the diet-derived substrate trimethylamine (Cashman, 2000). The current finding that CR markedly up-regulates Fmo3 (346-fold; Fig. 4) may suggest a marked increase in oxidative metabolism and clearance of its substrates. The CR-induced up-regulation (Fig. 4) of the female-predominant Fmo1-4 (Fu et al., 2012) is examples of feminization effects.
CR up-regulates numerous phase-II enzymes, including many Sults, some Ugts, and most Gsts, which play crucial roles in detoxification. The inhibition of CR on mammary tumorigenesis is thought to be mediated in part by suppression of estrogen levels (Sylvester et al., 1982). This correlates with the CR-induced elevation of the estrogen sulfotransferase Sult1e1 (33.2-fold) (Fig. 8). Modest up-regulation of Sult1a1 and Sult1d1 by CR (Fig. 8) suggests a possible increase in sulfation and clearance of phenolic substrates (such as acetaminophen and troglitazone). The modest increase of Sult3a1 by CR (Fig. 8) suggests possible elevation of metabolism and detoxification of its substrates, such as neurotoxicant phenyltetrahydropyridine and the rodent carcinogen 4-chloroaniline (Yoshinari et al., 1998). The CR-induced up-regulation (Fig. 8) of female-predominant Sult1a1, 1d1, 3a1, and Papss2 (Fu et al., 2012) appears to be due to feminization effects.
In comparison to Sults, Ugts are altered by CR to a lesser degree. Glucuronosyltransferases in liver are important for deactivating the biological activities of thyroid hormones (Barter and Klaassen, 1994), which are the master regulator of basal metabolic rate. CR-induced increase of Ugt1a1 (Fig. 9), which can conjugate thyroid hormones (Findlay et al., 2000), correlates with decreased thyroid hormones by CR (Fontana et al., 2006). Increased Ugt1a1 and Ugt1a5 by CR (Fig. 9) are consistent with a previous finding that mutants of C. elegens with spontaneous CR have increased mRNA expression of Ugts, as a longevity assurance mechanism (McElwee et al., 2004). Therefore, elevated detoxification might be an evolutionarily conserved anti-aging pathway. Moreover, Ugt1a1 and Ugt1a5 are female-predominantly expressed (Fu et al., 2012) and their up-regulation by CR is examples of feminization effects. In contrast, CR also down-regulates several Ugts (Fig. 9), the biological significance of which needs further study
Gsts, which conjugate and detoxify electrophilic compounds, are proposed candidates to assure longevity in multiple species (McElwee et al., 2007). A comparison of the mRNA profiles of XPGs in livers of genetic long-lived models, namely Little mice and Ames dwarf mice (Amador-Noguez et al., 2004), as well as dietary long-lived model CR mice (data from the present study), shows that common changes include increased Oatp1a4, Cyp4a14, Fmo3, Sult1a1, Papss2, Gsta4, m3, t1, and Mgst3, and decreased Oatp1a1, Ces3a, Gstp2, and Comt. Noticeably, many of these XPGs belong to the Gst family. Gsta4 plays crucial roles in detoxifying 4-hydroxy-2-nonenal, which is a major lipid peroxidation product known to cause oxidative stress and to accumulate during aging (Sohal and Weindruch, 1996). The increased mRNA expression of Gsta4 (about 2-fold) by CR (Fig. 10) may provide a potential anti-aging mechanism of CR, which is supported by the evidence that overexpression of mouse Gsta4 in C. elegans increases stress resistance and life span (Ayyadevara et al., 2005). Among the various Gsts, the Pi class has attracted attention because high levels of Gsts are linked with cancer incidence (Tew and Townsend, 2011). The marked down-regulation of Gstp1 and Gstp2 by CR (Fig. 10) correlates with lower cancer incidence in CR rodents and monkeys (Longo and Fontana, 2010). Both up-regulation of Gsta4, m2, t1, and Mgst3 and down-regulation of Gstp1 and Gstp2 are examples of feminization effects by CR in livers of male mice.
Transcription factors may not play crucial regulatory roles in CR-induced mRNA changes of XPGs. AhR, PXR, and CAR do not appear to be activated by CR, due to the lack of induction of their prototypical target genes (Cyp1a2, Cyp3a11, and Cyp2b10, respectively) (Fig. 3). Although CAR is suggested to mediate the up-regulation of some phase-II enzymes by fasting (Maglich et al., 2004), the present study has not observed increases in Cyp2b and another CAR target gene Sult2a1, indicating no CAR activation by CR, which is consistent with a previous report (Cao et al., 2001). PPARα, a regulator for fatty acid oxidation, may be activated by CR in liver, because of the increase in its prototypical target gene Cyp4a14 (Fig. 3), however, the knowledge on the role of PPARα in xenobiotic metabolism is rather limited. Nrf2, a master regulator for antioxidant defense and electrophile detoxification, might be activated by CR in liver, because of the increase in some Nrf2 target genes (such as Nqo1 and many Gsts) (Klaassen and Aleksunes, 2010; Wu et al., 2012) (Figs 3 and 10) and Nrf2 mRNA (Fig. 13). However, another Nrf2 target gene Mrp3 is down-regulated (Fig. 12). In summary, the CR-induced changes of XPGs do not appear to be regulated by a single transcription factor.
Long-lived mice have lost the sex dimorphism of gene expression (Amador-Noguez et al., 2005). Another study indicated that genomic-wide mRNA profiles in male mice seem to be feminized by CR (Estep et al., 2009) by comparing with prior database of gender-divergent gene expression. With advantages in concluding from same strain of mice and consistent animal procedure and following molecular biology techniques from the same laboratory, the present study concludes that CR feminizes the mRNA profiles of 32 XPGs by comparing with a previous report on gender differences of XPG mRNA expression in liver from our laboratory (Fu et al., 2012). These two sets of data were acquired from the same strain of mice housed in one LAR facility, thus ensuring a good comparison. As summarized in Table 1, feminization effects are observed for male-predominant Oatp1a1, Ces2c, 3a, Ugt1a6a, 2b1, Gstp1, p2, and Bcrp, as well as female-predominant Oapt1a4, Ent1, Cyp1a1, 4a14, Por, Nqo1, Fmo1-4, Aldh8a1, Pon1, Sult1a1, 1d1, 3a1, Papss2, Ugt1a1, 1a5, Gsta4, m2, t1, Mgst3, CAR, and Nrf2. However, the remaining XPGs that are altered by CR either do not have gender-divergent expression (19 XPGs) or the changes by CR fail to be explained by feminization (10 XPGs). Additional studies are required to determine the mechanism(s). The CR-induced feminization effects interestingly correlate with the phenomenon that females tend to have a longer life expectancy than males in humans (Vina et al., 2005) and rodents (Goodrick, 1975).
Table 1.
CR (30 and 40%) feminizes the mRNA profiles of over half of the XPGs that are altered in livers of male mice.
| mRNA changes by CR | List of XPGs (Category: Name) | Male or female predominant expression | |
|---|---|---|---|
| “Feminization effects” | Decrease | Uptake transporter: Oatp1a1 | Male |
| Phase-I enzymes: Ces2c, Ces3a | |||
| Phase-II enzymes: Ugt1a6a, Ugt2b1, Gstp1, Gstp2 | |||
| Efflux transporter: Bcrp | |||
| Increase | Uptake transporter: Oatp1a4, Ent1 | Female | |
| Phase-I enzymes: Cyp1a1, Cyp4a14, Por1, Nqo1, Fmo1, Fmo2, Fmo3, Fmo4, Aldh8a1, Pon1 | |||
| Phase-II enzymes: Sult1a1, Sult1d1, Sult3a1, Papss2, Ugt1a1, Ugt1a5, Gsta4, Gstm2, Gstt1, Mgst3 | |||
| Transcription factors: CAR, Nrf2 |
Gender-divergent gene expression in rodent liver is determined in large part by growth hormone (GH) secretory pattern, which is continuous in females but pulsatile in males (Waxman and O’Connor, 2006). Our laboratory has shown that male-pattern GH is an important contributor to the gender-divergent expression of many XPGs in liver, such as Oatps, Sults, Ugts, and Mrps (Cheng et al., 2006; Maher et al., 2006; Buckley and Klaassen, 2009; Alnouti and Klaassen, 2011). CR was reported to decrease plasma GH levels in males (Chacon et al., 2005). Therefore, the feminization effects of many XPGs by CR in males may be due to the CR-induced decrease in GH levels. In general, humans have much smaller gender differences in XPG expression than rodents (Waxman and O’Connor, 2006). Thus, one needs to be cautious when extrapolating the significance of feminization of XPG expression in liver by CR from mice to humans.
Protein levels and functions of XPGs investigated in the current large-scale study were not determined due to technical limitations and extensive workload. Specific antibodies, substrates, and inhibitors for many individual mouse XPGs are not available. A recent report showed that protein expression and function of some phase-II enzymes, such as Ugts, correlate well with mRNA levels during CR (Wen et al., 2013). However, whether the mRNA expression of all XPGs in this study can be extrapolated to protein levels and functions remains to be validated. Technological breakthroughs in proteomics and metabolomics and improved understanding on substrate specificity are essential to study the protein levels and functions of XPGs during CR in the future. It may also be informative to treat control and CR mice with classic inducers or inhibitors of XPG expression for comparison purposes.
In conclusion, the present study utilized a graded short-term CR model and investigated the mRNA profiles of 98 XPGs in livers of male mice during CR. Major findings are 1) CR (30 and 40%) altered over half of the XPGs; 2) CR up-regulated 17 phase-II drug metabolizing enzymes; and 3) over half of the XPGs that are altered by CR appear to be due to feminization of the liver by CR. These results provide important clues on which XPG pathways are altered, thus the dosing, pharmacokinetics, and toxicity of drugs might be altered in people on diets, and may shed light on the potential mechanisms of the anti-aging effects of CR.
Supplementary Material
Highlights.
Utilized a graded CR model in male mice.
The mRNA profiles of xenobiotic processing genes (XPGs) in liver were investigated.
CR up-regulates many phase-II enzymes.
CR tends to feminize the mRNA profiles of XPGs
Acknowledgments
The authors would like to give acknowledgements to Udayan Apte, Ph.D. for his suggestion on designing the calorie restriction study, Judith Larson, D.V.M. for her help with health checks of mice, and lab members for their help with tissue collection and critical review of the manuscript.
This study was supported by the National Institute of Health [Grants ES-009649 and DK-081461].
Abbreviations
- Abc
ATP-binding cassette
- Adh
alcohol dehydrogenase
- AhR
aryl hydrocarbon receptor
- Aldh
aldehyde dehydrogenase
- AL
ad libitum
- Bcrp
breast cancer resistant protein
- CAR
constitutive androstane receptor
- Ces
carboxylesterase
- Comt
catechol-O-methyl transferase
- CR
calorie restriction
- Ent
equilibrative nucleoside transporter
- Fmo
flavin-containing monooxygenase
- GH
growth hormone
- Gst
glutathione S-transferase
- Mate
multidrug and toxin extrusion
- Mdr
multidrug resistance protein
- Mrp
multidrug resistance-associated protein
- Nat
N-acetyltransferase
- Nqo1
NAD(P)H: quinone oxidoreductase 1
- Nrf2
nuclear factor E2-related factor 2
- Oat
organic anion transporter
- Oatp
organic anion-transporting polypeptide
- Oct
organic cation transporter
- P450
cytochrome P450
- Papss
3’-phosphoadenosine 5’-phosphosulfate synthase
- Pon
paraoxonase
- Por
cytochrome P450 reductase
- PPAR
peroxisome proliferator-activated receptor
- PXR
pregnane X receptor
- Sult
sulfotransferase
- Ugdh
UDP-glucose-6-dehydrogenase
- Ugp
UDP-glucose pyrophosphorylase
- Ugt
UDP-glucuronosyltransferase
- XPG
xenobiotic processing gene
Footnotes
Author Contributions
Participated in research design: Fu and Klaassen;
Conducted experiments: Fu;
Contributed new reagents or analytic tools: Fu and Klaassen;
Performed data analysis: Fu;
Wrote the manuscript: Fu and Klaassen.
Publisher's Disclaimer: This is a PDF file of an unedited manuscript that has been accepted for publication. As a service to our customers we are providing this early version of the manuscript. The manuscript will undergo copyediting, typesetting, and review of the resulting proof before it is published in its final citable form. Please note that during the production process errors may be discovered which could affect the content, and all legal disclaimers that apply to the journal pertain.
References
- Aleksunes LM, Klaassen CD. Coordinated regulation of hepatic phase I and II drug-metabolizing genes and transporters using AhR-, CAR-, PXR-, PPARalpha-, and Nrf2-null mice. Drug Metab Dispos. 2012;40:1366–1379. doi: 10.1124/dmd.112.045112. [DOI] [PMC free article] [PubMed] [Google Scholar]
- Alnouti Y, Klaassen CD. Mechanisms of gender-specific regulation of mouse sulfotransferases (Sults) Xenobiotica. 2011;41:187–197. doi: 10.3109/00498254.2010.535923. [DOI] [PMC free article] [PubMed] [Google Scholar]
- Amador-Noguez D, Dean A, Huang W, Setchell K, Moore D, Darlington G. Alterations in xenobiotic metabolism in the long-lived Little mice. Aging Cell. 2007;6:453–470. doi: 10.1111/j.1474-9726.2007.00300.x. [DOI] [PMC free article] [PubMed] [Google Scholar]
- Amador-Noguez D, Yagi K, Venable S, Darlington G. Gene expression profile of long-lived Ames dwarf mice and Little mice. Aging Cell. 2004;3:423–441. doi: 10.1111/j.1474-9728.2004.00125.x. [DOI] [PubMed] [Google Scholar]
- Amador-Noguez D, Zimmerman J, Venable S, Darlington G. Gender-specific alterations in gene expression and loss of liver sexual dimorphism in the long-lived Ames dwarf mice. Biochem Biophys Res Commun. 2005;332:1086–1100. doi: 10.1016/j.bbrc.2005.05.063. [DOI] [PubMed] [Google Scholar]
- Apte UM, Limaye PB, Ramaiah SK, Vaidya VS, Bucci TJ, Warbritton A, Mehendale HM. Upregulated promitogenic signaling via cytokines and growth factors: potential mechanism of robust liver tissue repair in calorie-restricted rats upon toxic challenge. Toxicol Sci. 2002;69:448–459. doi: 10.1093/toxsci/69.2.448. [DOI] [PubMed] [Google Scholar]
- Ayyadevara S, Engle MR, Singh SP, Dandapat A, Lichti CF, Benes H, Shmookler Reis RJ, Liebau E, Zimniak P. Lifespan and stress resistance of Caenorhabditis elegans are increased by expression of glutathione transferases capable of metabolizing the lipid peroxidation product 4-hydroxynonenal. Aging Cell. 2005;4:257–271. doi: 10.1111/j.1474-9726.2005.00168.x. [DOI] [PubMed] [Google Scholar]
- Barger JL, Kayo T, Vann JM, Arias EB, Wang J, Hacker TA, Wang Y, Raederstorff D, Morrow JD, Leeuwenburgh C, Allison DB, Saupe KW, Cartee GD, Weindruch R, Prolla TA. A low does of dietary resveratrol partially mimics calorie restriction and retards aging parameters in mice. PLoS One. 2008;3:e2264. doi: 10.1371/journal.pone.0002264. [DOI] [PMC free article] [PubMed] [Google Scholar]
- Barter RA, Klaassen CD. Reduction of thyroid hormone levels and alteration of thyroid function by four representative UDP-glucuronosyltransferase inducers in rats. Toxicol Appl Pharmacol. 1994;128:9–17. doi: 10.1006/taap.1994.1174. [DOI] [PubMed] [Google Scholar]
- Bauer M, Hamm AC, Bonaus M, Jacob A, Jaekel J, Schorle H, Pankratz MJ, Katzenberger JD. Starvation response in mouse liver shows strong correlation with life-span-prolonging processes. Physiological genomics. 2004;17:230–244. doi: 10.1152/physiolgenomics.00203.2003. [DOI] [PubMed] [Google Scholar]
- Buckley DB, Klaassen CD. Mechanism of gender-divergent UDP-glucuronosyltransferase mRNA expression in mouse liver and kidney. Drug Metab Dispos. 2009;37:834–840. doi: 10.1124/dmd.108.024224. [DOI] [PMC free article] [PubMed] [Google Scholar]
- Cao SX, Dhahbi JM, Mote PL, Spindler SR. Genomic profiling of short- and long-term caloric restriction effects in the liver of aging mice. Proc Natl Acad Sci U S A. 2001;98:10630–10635. doi: 10.1073/pnas.191313598. [DOI] [PMC free article] [PubMed] [Google Scholar]
- Cashman JR. Human flavin-containing monooxygenase: substrate specificity and role in drug metabolism. Curr Drug Metab. 2000;1:181–191. doi: 10.2174/1389200003339135. [DOI] [PubMed] [Google Scholar]
- Chacon F, Esquifino AI, Perello M, Cardinali DP, Spinedi E, Alvarez MP. 24-hour changes in ACTH, corticosterone, growth hormone, and leptin levels in young male rats subjected to calorie restriction. Chronobiol Int. 2005;22:253–265. doi: 10.1081/cbi-200053522. [DOI] [PubMed] [Google Scholar]
- Cheng X, Maher J, Lu H, Klaassen CD. Endocrine regulation of gender-divergent mouse organic anion-transporting polypeptide (Oatp) expression. Mol Pharmacol. 2006;70:1291–1297. doi: 10.1124/mol.106.025122. [DOI] [PubMed] [Google Scholar]
- Cheung C, Davies NG, Hoog JO, Hotchkiss SA, Pease Smith CK. Species variations in cutaneous alcohol dehydrogenases and aldehyde dehydrogenases may impact on toxicological assessments of alcohols and aldehydes. Toxicology. 2003;184:97–112. doi: 10.1016/s0300-483x(02)00552-8. [DOI] [PubMed] [Google Scholar]
- Colman RJ, Anderson RM, Johnson SC, Kastman EK, Kosmatka KJ, Beasley TM, Allison DB, Cruzen C, Simmons HA, Kemnitz JW, Weindruch R. Caloric restriction delays disease onset and mortality in rhesus monkeys. Science. 2009;325:201–204. doi: 10.1126/science.1173635. [DOI] [PMC free article] [PubMed] [Google Scholar]
- De Cabo R, Cabello R, Rios M, Lopez-Lluch G, Ingram DK, Lane MA, Navas P. Calorie restriction attenuates age-related alterations in the plasma membrane antioxidant system in rat liver. Exp Gerontol. 2004;39:297–304. doi: 10.1016/j.exger.2003.12.003. [DOI] [PubMed] [Google Scholar]
- Dhahbi JM, Mote PL, Wingo J, Tillman JB, Walford RL, Spindler SR. Calories and aging alter gene expression for gluconeogenic, glycolytic, and nitrogen-metabolizing enzymes. The American journal of physiology. 1999;277:E352–360. doi: 10.1152/ajpendo.1999.277.2.E352. [DOI] [PubMed] [Google Scholar]
- Estep PW, 3rd, Warner JB, Bulyk ML. Short-term calorie restriction in male mice feminizes gene expression and alters key regulators of conserved aging regulatory pathways. PloS one. 2009;4:e5242. doi: 10.1371/journal.pone.0005242. [DOI] [PMC free article] [PubMed] [Google Scholar]
- Findlay KA, Kaptein E, Visser TJ, Burchell B. Characterization of the uridine diphosphate-glucuronosyltransferase-catalyzing thyroid hormone glucuronidation in man. J Clin Endocrinol Metab. 2000;85:2879–2883. doi: 10.1210/jcem.85.8.6715. [DOI] [PubMed] [Google Scholar]
- Fontana L, Klein S, Holloszy JO, Premachandra BN. Effect of long-term calorie restriction with adequate protein and micronutrients on thyroid hormones. J Clin Endocrinol Metab. 2006;91:3232–3235. doi: 10.1210/jc.2006-0328. [DOI] [PubMed] [Google Scholar]
- Fontana L, Meyer TE, Klein S, Holloszy JO. Long-term calorie restriction is highly effective in reducing the risk for atherosclerosis in humans. Proc Natl Acad Sci U S A. 2004;101:6659–6663. doi: 10.1073/pnas.0308291101. [DOI] [PMC free article] [PubMed] [Google Scholar]
- Fu ZD, Csanaky IL, Klaassen CD. Effects of aging on mRNA profiles for drug-metabolizing enzymes and transporters in livers of male and female mice. Drug Metab Dispos. 2012;40:1216–1225. doi: 10.1124/dmd.111.044461. [DOI] [PMC free article] [PubMed] [Google Scholar]
- Gems D, McElwee JJ. Broad spectrum detoxification: the major longevity assurance process regulated by insulin/IGF-1 signaling? Mech Ageing Dev. 2005;126:381–387. doi: 10.1016/j.mad.2004.09.001. [DOI] [PubMed] [Google Scholar]
- Goodrick CL. Life-span and the inheritance of longevity of inbred mice. J Gerontol. 1975;30:257–263. doi: 10.1093/geronj/30.3.257. [DOI] [PubMed] [Google Scholar]
- Hagenbuch B, Gui C. Xenobiotic transporters of the human organic anion transporting polypeptides (OATP) family. Xenobiotica. 2008;38:778–801. doi: 10.1080/00498250801986951. [DOI] [PubMed] [Google Scholar]
- Han E, Hilsenbeck SG, Richardson A, Nelson JF. cDNA expression arrays reveal incomplete reversal of age-related changes in gene expression by calorie restriction. Mech Ageing Dev. 2000;115:157–174. doi: 10.1016/s0047-6374(00)00119-6. [DOI] [PubMed] [Google Scholar]
- Hines RN, Cashman JR, Philpot RM, Williams DE, Ziegler DM. The mammalian flavin-containing monooxygenases: molecular characterization and regulation of expression. Toxicol Appl Pharmacol. 1994;125:1–6. doi: 10.1006/taap.1994.1042. [DOI] [PubMed] [Google Scholar]
- Iqbal A, Piper M, Faragher RG, Naughton DP, Partridge L, Ostler EL. Chemical changes in aging Drosophila melanogaster. Age (Dordr) 2009;31:343–351. doi: 10.1007/s11357-009-9105-4. [DOI] [PMC free article] [PubMed] [Google Scholar]
- Klaassen CD, Aleksunes LM. Xenobiotic, bile acid, and cholesterol transporters: function and regulation. Pharmacol Rev. 2010;62:1–96. doi: 10.1124/pr.109.002014. [DOI] [PMC free article] [PubMed] [Google Scholar]
- Klaassen CD, Lu H. Xenobiotic transporters: ascribing function from gene knockout and mutation studies. Toxicol Sci. 2008;101:186–196. doi: 10.1093/toxsci/kfm214. [DOI] [PubMed] [Google Scholar]
- Klaassen CD, Slitt AL. Regulation of hepatic transporters by xenobiotic receptors. Curr Drug Metab. 2005;6:309–328. doi: 10.2174/1389200054633826. [DOI] [PubMed] [Google Scholar]
- Lee CK, Allison DB, Brand J, Weindruch R, Prolla TA. Transcriptional profiles associated with aging and middle age-onset caloric restriction in mouse hearts. Proc Natl Acad Sci U S A. 2002;99:14988–14993. doi: 10.1073/pnas.232308999. [DOI] [PMC free article] [PubMed] [Google Scholar]
- Lee JS, Ward WO, Liu J, Ren H, Vallanat B, Delker D, Corton JC. Hepatic xenobiotic metabolizing enzyme and transporter gene expression through the life stages of the mouse. PloS one. 2011;6:e24381. doi: 10.1371/journal.pone.0024381. [DOI] [PMC free article] [PubMed] [Google Scholar]
- Longo VD, Fontana L. Calorie restriction and cancer prevention: metabolic and molecular mechanisms. Trends Pharmacol Sci. 2010;31:89–98. doi: 10.1016/j.tips.2009.11.004. [DOI] [PMC free article] [PubMed] [Google Scholar]
- Luo MJ, Chen LL, Zheng J, Zeng TS, Deng XL. The effect of calorie restriction on the expression of liver’s gluconeogenesis genes of rats fed a high fat diet. Zhonghua gan zang bing za zhi = Zhonghua ganzangbing zazhi = Chinese journal of hepatology. 2008;16:125–128. [PubMed] [Google Scholar]
- Maglich JM, Watson J, McMillen PJ, Goodwin B, Willson TM, Moore JT. The nuclear receptor CAR is a regulator of thyroid hormone metabolism during caloric restriction. J Biol Chem. 2004;279:19832–19838. doi: 10.1074/jbc.M313601200. [DOI] [PubMed] [Google Scholar]
- Maher JM, Cheng X, Tanaka Y, Scheffer GL, Klaassen CD. Hormonal regulation of renal multidrug resistance-associated proteins 3 and 4 (Mrp3 and Mrp4) in mice) Biochem Pharmacol. 2006;71:1470–1478. doi: 10.1016/j.bcp.2006.02.005. [DOI] [PubMed] [Google Scholar]
- Marsillach J, Mackness B, Mackness M, Riu F, Beltran R, Joven J, Camps J. Immunohistochemical analysis of paraoxonases-1, 2, and 3 expression in normal mouse tissues. Free Radic Biol Med. 2008;45:146–157. doi: 10.1016/j.freeradbiomed.2008.03.023. [DOI] [PubMed] [Google Scholar]
- Martin B, Mattson MP, Maudsley S. Caloric restriction and intermittent fasting: two potential diets for successful brain aging. Ageing research reviews. 2006;5:332–353. doi: 10.1016/j.arr.2006.04.002. [DOI] [PMC free article] [PubMed] [Google Scholar]
- McCay CM, Crowell MF, Maynard LA. The effect of retarded growth upon the length of the lifespan and upon the ultimate body size. J Nutr. 1935;10:63–79. [PubMed] [Google Scholar]
- McElwee JJ, Schuster E, Blanc E, Piper MD, Thomas JH, Patel DS, Selman C, Withers DJ, Thornton JM, Partridge L, Gems D. Evolutionary conservation of regulated longevity assurance mechanisms. Genome Biol. 2007;8:R132. doi: 10.1186/gb-2007-8-7-r132. [DOI] [PMC free article] [PubMed] [Google Scholar]
- McElwee JJ, Schuster E, Blanc E, Thomas JH, Gems D. Shared transcriptional signature in Caenorhabditis elegans Dauer larvae and long-lived daf-2 mutants implicates detoxification system in longevity assurance. J Biol Chem. 2004;279:44533–44543. doi: 10.1074/jbc.M406207200. [DOI] [PubMed] [Google Scholar]
- Nogueira LM, Lavigne JA, Chandramouli GV, Lui H, Barrett JC, Hursting SD. Dose-dependent effects of calorie restriction on gene expression, metabolism, and tumor progression are partially mediated by insulin-like growth factor-1. Cancer Med. 2012;1:275–288. doi: 10.1002/cam4.23. [DOI] [PMC free article] [PubMed] [Google Scholar]
- Okita RT, Okita JR. Cytochrome P450 4A fatty acid omega hydroxylases. Curr Drug Metab. 2001;2:265–281. doi: 10.2174/1389200013338423. [DOI] [PubMed] [Google Scholar]
- Petrovski G, Das DK. Does autophagy take a front seat in lifespan extension? Journal of cellular and molecular medicine. 2010;14:2543–2551. doi: 10.1111/j.1582-4934.2010.01196.x. [DOI] [PMC free article] [PubMed] [Google Scholar]
- Renaud HJ, Cui JY, Khan M, Klaassen CD. Tissue distribution and gender-divergent expression of 78 cytochrome P450 mRNAs in mice. Toxicol Sci. 2011;124:261–277. doi: 10.1093/toxsci/kfr240. [DOI] [PMC free article] [PubMed] [Google Scholar]
- Rocha JS, Bonkowski MS, de Franca LR, Bartke A. Effects of mild calorie restriction on reproduction, plasma parameters and hepatic gene expression in mice with altered GH/IGF-I axis. Mech Ageing Dev. 2007;128:317–331. doi: 10.1016/j.mad.2007.02.001. [DOI] [PubMed] [Google Scholar]
- Selman C, Kerrison ND, Cooray A, Piper MD, Lingard SJ, Barton RH, Schuster EF, Blanc E, Gems D, Nicholson JK, Thornton JM, Partridge L, Withers DJ. Coordinated multitissue transcriptional and plasma metabonomic profiles following acute caloric restriction in mice. Physiological genomics. 2006;27:187–200. doi: 10.1152/physiolgenomics.00084.2006. [DOI] [PubMed] [Google Scholar]
- Sohal RS, Weindruch R. Oxidative stress, caloric restriction, and aging. Science. 1996;273:59–63. doi: 10.1126/science.273.5271.59. [DOI] [PMC free article] [PubMed] [Google Scholar]
- Steinbaugh MJ, Sun LY, Bartke A, Miller RA. Activation of genes involved in xenobiotic metabolism is a shared signature of mouse models with extended lifespan. Am J Physiol Endocrinol Metab. 2012;303:E488–495. doi: 10.1152/ajpendo.00110.2012. [DOI] [PMC free article] [PubMed] [Google Scholar]
- Sylvester PW, Aylsworth CF, Van Vugt DA, Meites J. Influence of underfeeding during the “critical period” or thereafter on carcinogen-induced mammary tumors in rats. Cancer Res. 1982;42:4943–4947. [PubMed] [Google Scholar]
- Tew KD, Townsend DM. Regulatory functions of glutathione S-transferase P1-1 unrelated to detoxification. Drug Metab Rev. 2011;43:179–193. doi: 10.3109/03602532.2011.552912. [DOI] [PMC free article] [PubMed] [Google Scholar]
- Tsuchiya T, Dhahbi JM, Cui X, Mote PL, Bartke A, Spindler SR. Additive regulation of hepatic gene expression by dwarfism and caloric restriction. Physiological genomics. 2004;17:307–315. doi: 10.1152/physiolgenomics.00039.2004. [DOI] [PubMed] [Google Scholar]
- Vaquero A, Reinberg D. Calorie restriction and the exercise of chromatin. Genes Dev. 2009;23:1849–1869. doi: 10.1101/gad.1807009. [DOI] [PMC free article] [PubMed] [Google Scholar]
- Vina J, Borras C, Gambini J, Sastre J, Pallardo FV. Why females live longer than males: control of longevity by sex hormones. Sci Aging Knowledge Environ. 2005;2005:pe17. doi: 10.1126/sageke.2005.23.pe17. [DOI] [PubMed] [Google Scholar]
- Waxman DJ, O’Connor C. Growth hormone regulation of sex-dependent liver gene expression. Mol Endocrinol. 2006;20:2613–2629. doi: 10.1210/me.2006-0007. [DOI] [PubMed] [Google Scholar]
- Wen H, Yang HJ, An YJ, Kim JM, Lee DH, Jin X, Park SW, Min KJ, Park S. Enhanced phase II detoxification contributes to beneficial effects of dietary restriction as revealed by multi-platform metabolomics studies. Mol Cell Proteomics. 2013;12:575–586. doi: 10.1074/mcp.M112.021352. [DOI] [PMC free article] [PubMed] [Google Scholar]
- Wu KC, Cui JY, Klaassen CD. Effect of graded Nrf2 activation on phase-I and -II drug metabolizing enzymes and transporters in mouse liver. PLoS One. 2012;7:e39006. doi: 10.1371/journal.pone.0039006. [DOI] [PMC free article] [PubMed] [Google Scholar]
- Yoshinari K, Nagata K, Ogino M, Fujita K, Shiraga T, Iwasaki K, Hata T, Yamazoe Y. Molecular cloning and expression of an amine sulfotransferase cDNA: a new gene family of cytosolic sulfotransferases in mammals. J Biochem. 1998;123:479–486. doi: 10.1093/oxfordjournals.jbchem.a021961. [DOI] [PubMed] [Google Scholar]
Associated Data
This section collects any data citations, data availability statements, or supplementary materials included in this article.