Abstract
Background
No reliable predictors of susceptibility to gemcitabine chemotherapy exist in pancreatic ductal adenocarcinoma (PDAC). MicroRNAs (miR) are epigenetic gene regulators with tumorsuppressive or oncogenic roles in various carcinomas. This study assesses chemoresistant PDAC for its specific miR expression pattern.
Methods
Gemcitabine-resistant variants of two mutant p53 human PDAC cell lines were established. Survival rates were analyzed by cytotoxicity and apoptosis assays. Expression of 1733 human miRs was investigated by microarray and validated by qRT-PCR. After in-silico analysis of specific target genes and proteins of dysregulated miRs, expression of MRP-1, Bcl-2, mutant p53, and CDK1 was quantified by Western blot.
Results
Both established PDAC clones showed a significant resistance to gemcitabine (p<0.02) with low apoptosis rate (p<0.001) vs. parental cells. MiR-screening revealed significantly upregulated (miR-21, miR-99a, miR-100, miR-125b, miR-138, miR-210) and downregulated miRs (miR-31*, miR-330, miR-378) in chemoresistant PDAC (p<0.05). Bioinformatic analysis suggested involvement of these miRs in pathways controlling cell death and cycle. MRP-1 (p<0.02) and Bcl-2 (p<0.003) were significantly overexpressed in both resistant cell clones and mutant p53 (p = 0.023) in one clone.
Conclusion
Consistent miR expression profiles, in part regulated by mutant TP53 gene, were identified in gemcitabine-resistant PDAC with significant MRP-1 and Bcl-2 overexpression. These results provide a basis for further elucidation of chemoresistance mechanisms and therapeutic approaches to overcome chemoresistance in PDAC.
Introduction
Pancreatic ductal adenocarcinoma (PDAC) is the most lethal entity among human visceral cancers with increasing incidence and mortality in the United States and Europe. PDAC is currently the fourth leading cause of cancer-related death with a 5-year overall survival rate of less than 4% and is predicted to rise to second place behind lung cancer until 2020. Despite advances in clinical management and multimodal therapeutic regimens, 6-month progression-free survival remains below 15% [1]. The advances in cancer research that have led to improved prognosis in many hematological and solid cancers could not be translated into clinical benefits for PDAC patients so far.
The poor prognosis of PDAC is mainly attributed to rapid disease progression, late diagnosis at advanced unresectable stages, and poor response to the current single first-line chemotherapeutic agent gemcitabine with objectified tumor remission in only 5–11% of patients [2]. In the absence of screening options and early clinical symptoms, early diagnosis of the disease remains unattainable. Thus, chemotherapy remains a central asset in PDAC treatment and deciphering the mechanisms underlying the disease’s high level of chemoresistance is critical.
For a decade, chemotherapy with the cytidine nucleoside analogue and ribonucleotide reductase inhibitor gemcitabine has been the gold standard in the adjuvant treatment of locally advanced PDAC. Gemcitabine is a prodrug which requires cellular uptake and intracellular phosphorylation to its active diphosphate and triphosphate metabolites that inhibit DNA and RNA replication. So far, no reliable molecular targets exist to predict or influence the success of chemotherapy with gemcitabine in PDAC.
We have previously reviewed the role of (epi-)genetic markers for chemosensitivity and chemoresistance in PDAC [3]. Specifically, we discussed the role of microRNAs (miRs), a new class of small, noncoding single-stranded RNA molecules as potential key regulators in tumor oncogenesis with oncogenic or tumor suppressive properties. In this regard, only selected miRs have thus far been investigated for a role in PDAC-chemoresistance. We hypothesized that currently unidentified miRs take part in PDAC chemoresistance and present targets for novel diagnostic and therapeutic options. In this experimental study we aimed to 1) generate stable gemcitabine-resistant variants of primary, gemcitabine-susceptible human PDAC cell lines, and 2) identify chemoresistance-specific miR expression patterns.
Materials and Methods
Cell lines and cell culture
The certified human caucasian PDAC cell lines MIA-PaCa-2, PANC-1, BxPC-3, SU.86.86, and AsPC-1 were purchased from the American Type Culture Collection (ATCC; Rockville, MD). The cell lines carry TP53 missense mutations, all sequenced and validated by ATCC.
PANC-1 and MIA-PaCa-2 cells were cultured in phenol red free Dulbecco's Modified Eagle Medium (DMEM; Lonza, Walkersville, USA) supplemented with 10% heat inactivated fetal calf serum (FCS; Gibco, Carlsbad, USA), 2mM L-glutamine (Gibco), and 1mM sodium pyruvate (Sigma, St. Louis, USA) in a humidified incubator containing 95% air and 5% CO2 at 37°C. The medium for MIA-PaCa-2 cells was also supplemented by 2% heat inactivated horse serum (Gibco). BxPC-3, SU.86.86, and AsPC-1 cells were cultured under the same conditions in phenol red free RPMI-1640 medium (Gibco) containing 10% heat inactivated FCS, 2mM L-glutamine, 1mM sodium pyruvate, and 4.5g/l glucose (Sigma). All cell culture experiments were carried out without antibiotics.
Drug sensitivity assay
Depending on the PDAC cell line, 3500–8000 cells/well were seeded into 96-well culture plates in culture medium and allowed to attach at 37°C and 5% CO2 in humidified air for 24h. To determine the intrinsic drug sensitivity, each of the 5 parental PDAC cell lines was incubated with increasing concentrations (0.0001 to 100μM) of Gemcitabine (Eli Lilly, Bad Homburg, Germany) for 72h. Subsequently, 100μl per well of methylthiazolyldiphenyl-tetrazolium bromide (MTT) solution (5mg/ml; Sigma) was added to the cells followed by incubation for 3h. Then, 100μl of dimethyl sulfoxide (DMSO; Sigma) was substituted for the supernatant, followed by incubation for 30min. Absorbance at 570nm with background subtraction at 650nm was detected using an ELISA microplate reader (Dynatech MR5000, Dynatech Laboratories Inc., VA). The MTT assay is a sensitive method of screening for in vitro drug responsiveness with a colorimetric signal proportional to the viable cell number as indicator of chemotherapy response with high reproducibility [4–7]. All results were normalized to the corresponding controls and the relative viability was calculated. Chemosensitivity assays were carried out in quadruplicate and repeated at least three times in separate experiments.
Establishment of chemoresistant PDAC cell clones
Gemcitabine-resistant PANC-1 (PANC-1-GR) and MIA-PaCa-2 (MIA-PaCa-2-GR) cell clones were produced by exposing the parental cells to repeated pulsatile gemcitabine treatment over 3 days with constant sublethal concentrations followed by recovery-periods with agent-free medium until the cells recovered exponentially. Parental PANC-1 cells were treated with 0.4μM gemcitabine cycles for approximately 9 months. Parental MIA-PaCa-2 cells were exposed to 0.06μM gemcitabine cycles for approximately 12 months.
Morphology, time to recovery, doubling time and degree of acquired chemoresistance, using MTT cytotoxicity assay, were investigated for PANC-1 cell clones after 16–17 and 28–29 chemotherapy cycles, and after 28–29 chemotherapy cylces for MIA-PaCa-2 cell clones. Parental and chemoresistant cell clones with the same number of culture passage were compared with each other. Light microscopy and imaging (Eclipse E1000M and NIS-Elements D3.1 imaging software, Nikon, Düsseldorf, Germany) were used to evaluate morphologic changes in parental and chemoresistant PANC-1 and MIA-PaCa-2 cell clones.
Apoptosis assay
Parental and chemoresistant PANC-1 (1.5x10⁵) and MIA-PaCa-2 (1.2x10⁵) cells were seeded onto covered chamberslides for 24h, followed by 72h exposure to half maximal inhibitory concentration (IC50) of gemcitabine. PDAC cell monolayers were stained with Annexin-V-FLUOS Staining Kit (Roche, Mannheim, Germany) according to the manufacturer’s instructions. Cell viability was assessed by apoptosis assays in three independent experiments and determined under a fluorescence microscope (Eclipse E800, Nikon, Düsseldorf, Germany) by counting live, apoptotic, and necrotic cells.
MicroRNA microarray and data analysis
Total RNA was isolated from parental and chemoresistant PDAC cell lines using Trizol reagent (Qiagen, Hilden, Germany) and miRNeasy Mini Kits (Qiagen) according to the manufacturer’s instructions. RNA concentration and purity were measured using a Nanodrop spectrophotometer (Thermo Fisher Scientific Inc., Braunschweig, Germany). RNA integrity was determined using the Agilent 2100 Bioanalyzer on a RNA 6000 Nano/Pico LabChip (Agilent Technologies, Santa Clara, CA). Investigated samples had RIN values >8.0.
Affymetrix GeneChip miRNA microarrays (Affymetrix UK Ltd., High Wycombe, UK) were performed using the manufacturers´ protocols. The samples were prepared from 1μg of total-RNA in accordance with the Affymetrix FlashTag Biotin HSR RNA Labeling Kit. The targets were hybridized overnight to Affymetrix GeneChip miRNA arrays. Following hybridization, the arrays were washed and stained using the Affymetrix GeneChip Fluidics Station 450 and scanned using the Affymetrix GeneChip Scanner 3000 7G.
Microarray data quality was checked as recommended by the manufacturer and by the quality metrics in the Partek Genomics Suite software (Partek Inc., St. Louis, MO). Statistical analyses of microarray data were performed using the Partek Genomics Suite. CEL-files (containing raw expression measurements) were imported to Partek GS. The robust multi-array average algorithm was used for normalization. The array data were quantile-normalized and log-2 transformed. For each probe, a one-way analysis of variance was performed. Fisher's least significant difference was tested to statistically compare the difference between the means of the groups´ expression measurements. A p-value <0.05 was used as a threshold for significance. Microarray raw data are available through Gene Expression Omnibus accession number GSE74574 (www.ncbi.nlm.nih.gov/geo).
Quantitative real time PCR
Quantitative Real-Time (qRT) PCR was performed using the miScript PCR system (Qiagen). Total RNA samples (1μg) of PDAC cell lines were reverse transcribed to cDNA using miScript Reverse Transcription Kits (Qiagen). For each sample, 5μL of the generated cDNA was mixed with 10μL 2x QuantiTect SYBR, 2μL 10x miScript Universal Primer, 2μL gene specific 10x miScript Primer Assay and 1μL nuclease free water. All samples were analyzed in triplicate reactions using Applied Biosystems 7900HT Real-Time PCR System (Applied Biosystems, Darmstadt, Germany) with miScript SYBR Green PCR Kit (Qiagen). The cycling program involved preliminary denaturation at 95°C for 10min, followed by 40 cycles of denaturation at 95°C for 15s, annealing at 60°C for 60 s and elongation at 60°C for 60s. Quantitative miR analysis was performed using SDS-Software v2.3 (Applied Biosystems). Expression of each miR was analyzed quantitatively relative to the housekeeping genes RNU6-2, SNORD68, and SNORD96A by the 2–ΔΔCT method.
Target identification and Western blot analyses
Potential gene targets or regulators of the detected miRs were identified by literature review and in silico, using Ingenuity Pathway Analysis (IPA) and DIANA-mirPath. Based on this preselection we focused on protein targets that are commonly known to be relevant for cellular resistance to chemotherapy. Due to its role as `classic`drug resistance marker, MRP-1 expression was investigated after generation of chemoresistant PDAC cell clones. Monoclonal antibodies against human MRP-1 (QCRL1; abcam, 1:100; 1.5μg/ml), p53 (1C12; Cell Signaling Technology, 1:1000), CDK1 (A17; abcam, 1:500; 2μg/ml), Bcl-2 (AW604; Millipore, 1:1000; 1μg/ml), and actin (Sigma, 1:2000; 0.35μg/ml) were used as primary antibodies.
The employed p53 antibody detects wild-type p53 as well as mutant-p53. The p53 status of both human PDAC cell lines was sequenced and validated by ATCC. Accordingly, MIA-PaCa-2 and Panc-1 are homozygous mutant p53 cell lines that carry hotspot mutations in the codons 248 and 273, respectively. Therefore, the p53 analysis allows the detection of p53 R273H expression in PANC-1 and p53 R248W in MIA-PaCa-2 cell lines [8].
Total cell lysates were obtained by incubation in lysis buffer for 1h at 4°C. After centrifugation at 14000 g, supernatant proteins were electrophoretically separated on 7.5% SDS-PAGE, loaded with equal amounts of protein. Following electrophoresis, the proteins were transferred to a nitrocellulose membrane (Amersham Life Sciences). The primary antibodies were added in the appropriate dilution and incubated overnight at 4°C. The nitrocellulose membranes were washed in PBS (pH 7.4) containing 0.05% Tween20 and incubated with the secondary antibody anti-mouse IgG-HRP (Sigma, 1:13000; 0.08μg/ml) for 1h at room temperature, followed by a repeated Tris-buffered saline (without Tween20) wash. Antibody binding signal was detected using enhanced chemiluminescence (Millipore, Schwalbach, Germany), and protein quantification and band intensities were analyzed using ImageJ densitometry software (version 1.46r, NIH, USA). Band intensity was determined by area under the curve and calibration with standards on the same blot.
Statistical analysis
Statistical analysis was performed with the Statistical Package for the Social Sciences software program, version 17.0 (SPSS inc., Munich, Germany) for Windows®. Data were expressed as means of normalized expression. Statistical significance was determined by using the two-tailed Student’s t-test to compare two data sets. P<0.05 was considered to be statistically significant.
Results
Intrinsic chemoresistance in human parental PDAC cell lines
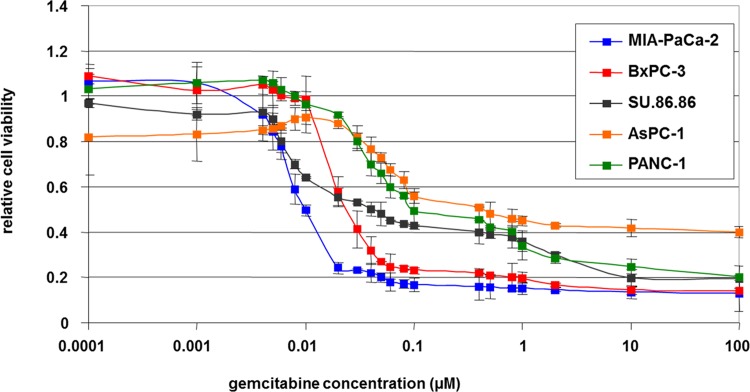
The therapeutic index was determined by MTT cytotoxicity assay using the dose-response curves of five human PDAC cell lines with IC50 and sublethal doses after 72h of gemcitabine chemotherapy (Fig 1). IC50 was recorded within a range of 0.01 to 0.8μM. Although the gemcitabine treatment caused a concentration dependent inhibition of growth in all 5 PDAC cell lines, MIA-PaCa-2 tended to be the cell line with the highest intrinsic chemosensitivity, whereas PANC-1 and AsPC-1 were the cell lines with the most distinct intrinsic chemoresistance. For further generation of acquired drug resistant cell clones, we selected MIA-PaCa-2 and PANC-1, two well-known primary PDAC cell lines of different intrinsic chemoresistance with an IC50 of 0.01μM vs. 0.1μM.
Fig 1. Intrinsic drug sensitivity of parental PDAC cell lines.
Relative cell viability of five human PDAC cell lines following 72 h exposure to ascending concentrations of gemcitabine by MTT cytotoxicity assay.
Generation of extrinsic chemoresistance in human PDAC cell lines
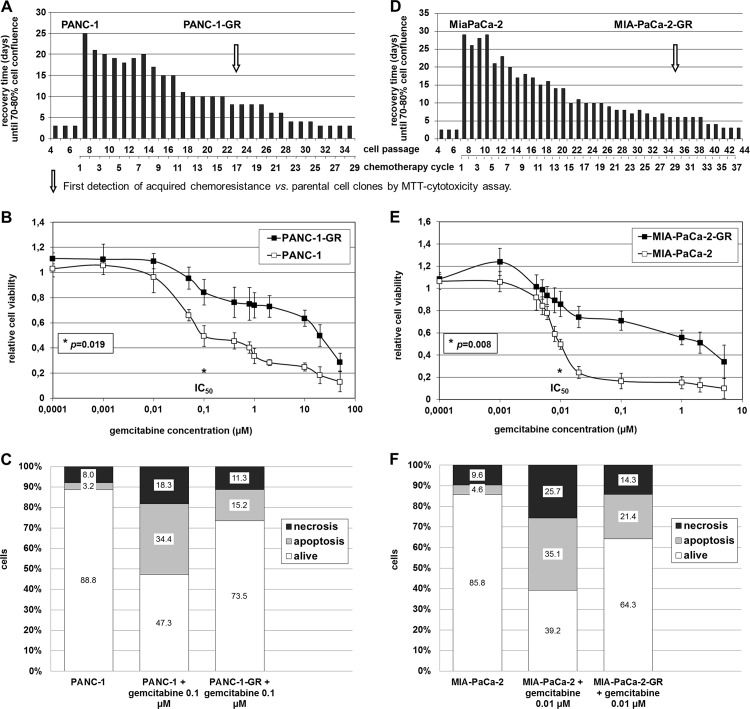
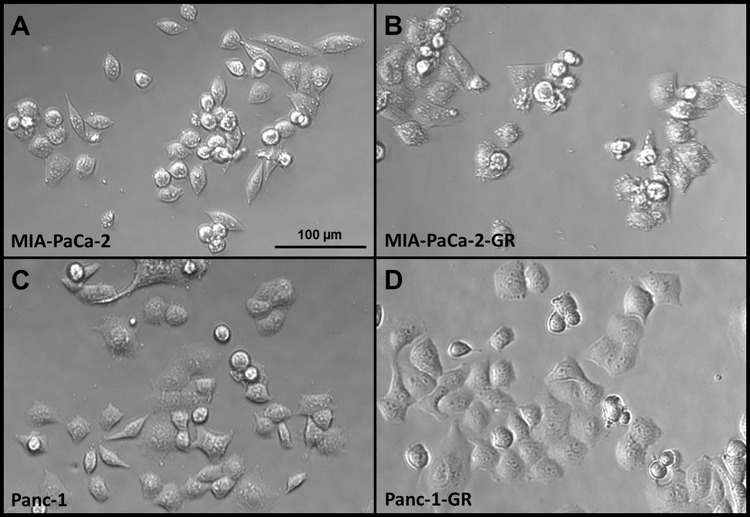
Generation of PDAC cell clones with acquired chemoresistance was achieved after 17 chemotherapy cycles in PANC-1 and after 29 cycles in MIA-PaCa-2 cells. Stably resistant PDAC cell clones were established following repeated pulsatile treatment over 3 days with constant sublethal concentrations of gemcitabine over a 9 to 12 month period (Fig 2A and 2D). MTT cytotoxicity assay revealed a significantly improved cell viability of gemcitabine treated PANC-1-GR (p = 0.019) and MIA-PaCa-2-GR cells (p = 0.008). Compared with their parental cells, the IC50 of the generated chemoresistant cell clones was about 150 to 200 times higher (Fig 2B and 2E). Concordantly, cell death analysis by Annexin-V / Propidium iodide fluorescence staining showed decreased apoptosis and necrosis of IC50 gemcitabine treated PANC-1-GR and MIA-PaCa-2-GR cell clones compared to their parental cells of 26.5 ±3.4% vs. 52.7 ±2.9% (p<0.001), respectively 35.7 ±3.5% vs. 60.8 ±7.4% (p = 0.01) (Fig 2C and 2F). Prolonged treatment of PANC-1 and MIA-PaCa-2 cells with gemcitabine resulted in morphologic changes with more plump, rounded cell morphology in MIA-PaCa-2-GR and PANC-1-GR cell clones compared with untreated PDAC cells with spindle-shaped character and enhanced formation of pseudopodia (Fig 3).
Fig 2. Establishment of chemoresistant PDAC cell clones.
Generation of chemoresistant PDAC cell clones by repeated pulsatile treatment over 3 days with constant sublethal concentrations of 0.4μM (A) or 0.06μM (D) gemcitabine followed by recovery-periods and quantification of cell viability by MTT assay as well as apoptosis assay in parental vs. chemoresistant PANC-1 (A, B, C) and MIA-PaCa-2 (D, E, F) cell clones.
Fig 3. Morphologic changes in parental and chemoresistant PANC-1 and MIA-PaCa-2.
Representative attached epithelial cells with spindle-shaped cells in untreated MIA-PaCa-2 (A) and PANC-1 cells (B) compared to more plump rounded morphology and enhanced formation of pseudopodia in their chemoresistant cell clones (C, D).
MicroRNA-expression profiling of chemoresistant human PDAC cell lines
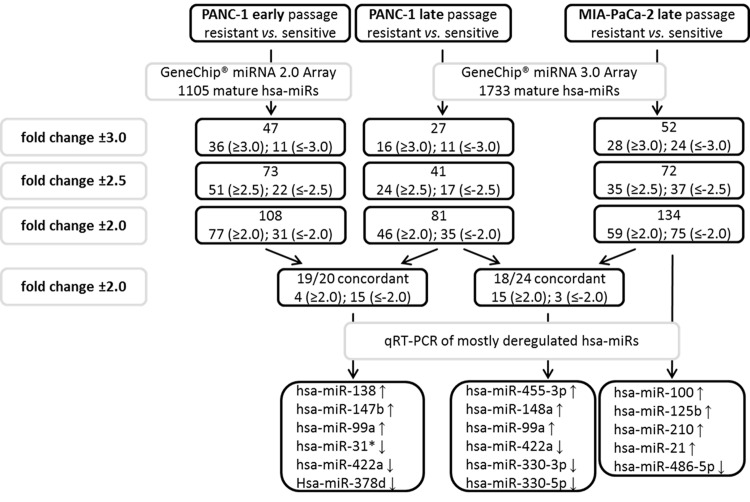
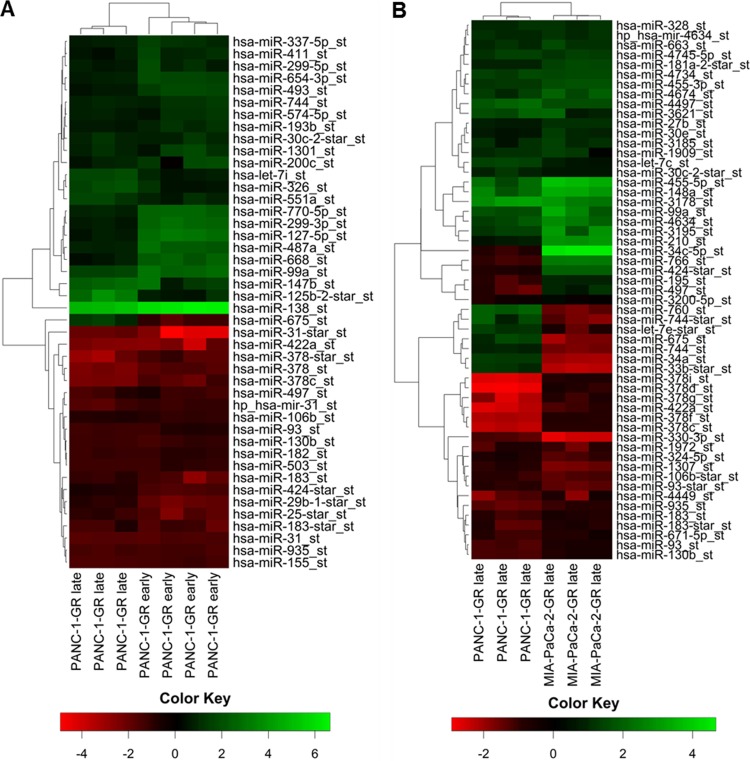
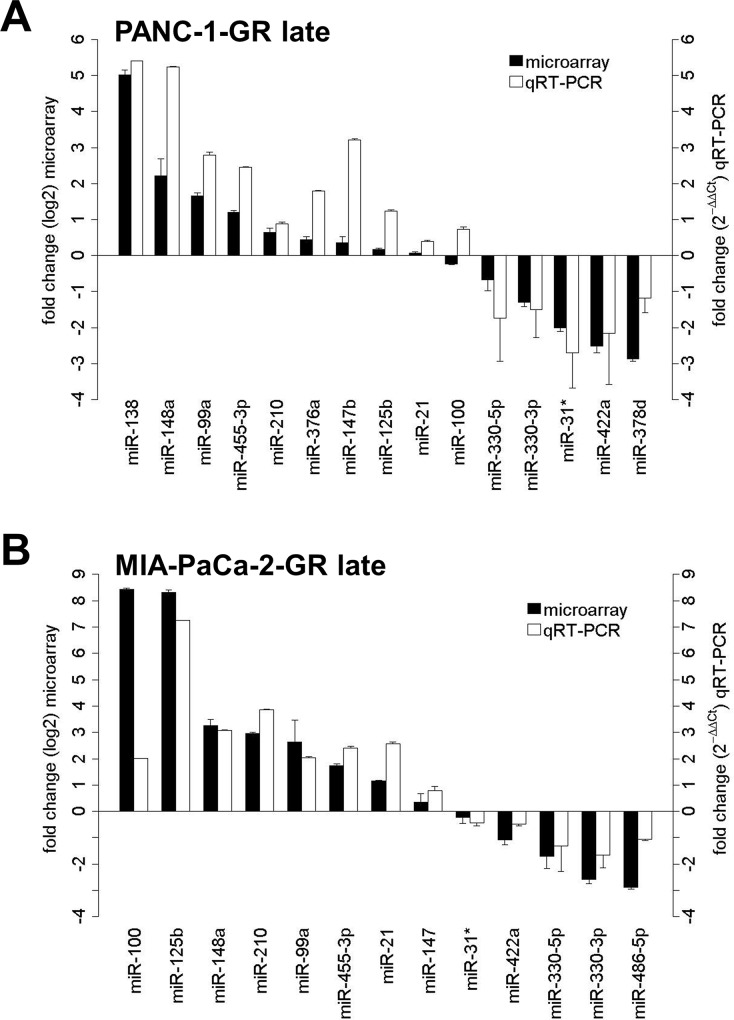
GeneChip miR microarray was finally performed in parental and chemoresistant PANC-1 cells after 17 and after 29 chemotherapy cycles. Comparing the profiles of significantly dysregulated miRs in early and late cell passage of PANC-1 cells with acquired chemoresistance, a miR panel of high congruence with 19 concordantly expressed miRs (fold change ±2) was identified (Fig 4). In hierarchical clustering using Manhattan distance and average linkage, PANC-1-GR cell clones with early and late acquired chemoresistance clustered together on the dendrogram with an accordance of significantly dysregulated and concordantly expressed miRs of more than 95%. No significant change of miR profile in early and late chemoresistance of PANC-1-GR cell clones was detected (Fig 5A). RT-PCR validation of mostly dysregulated miRs confirmed that miR-138, miR-147b, miR-148a, miR-99a, miR-455-3p and miR-125b were significantly upregulated and miR-31-star, miR-422a, miR-330-3p, mir-330-5p and miR-378d were downregulated in PANC-1-GR cell clones vs. their parental cell line (Fig 6A).
Fig 4. MicroRNA profiling.
Procedure and results of miR expression profiling by GeneChip microarray and qRT-PCR validation in parental and gemcitabine resistant PANC-1 and MIA-PaCa-2 cell clones.
Fig 5. MicroRNA heat mapping.
Hierarchical cluster heat maps of significantly dysregulated miRs in PANC-1-GR late and early cell passage (A) as well as in PANC-1-GR and MIA-PaCa-2-GR late cell passage (B). Each row shows the relative expression level for a single miR and each column shows the expression level for a single sample; fold change greater than ±2 (p<0.05). The red or green color indicates low or high expression, respectively.
Fig 6. MicroRNA microarray validation.
MiR microarray validation with qRT-PCR for significantly dysregulated miRs in PANC-1-GR (A) and MIA-PaCa-2-GR cell clones (B). Fold change from miR microarray is demostrated by log2 values (left y-axis, dark grey bars). Fold change from qRT-PCR was determined using the 2-ΔΔCt method (right y-axis, light grey bars). Error bars represent the standard deviation of mean.
Similarly, miR expression profiling in MIA-PaCa-2-GR cell clones was performed but limited to late passage cells due to the nearly identical results between early and late cycle cells in PANC-1-GR (Fig 5B). In MIA-PaCa-2-GR cell clones miR-125b, miR-210, miR-21, miR-100, miR-148a, miR-99a and miR-455-3p were significantly upregulated, whereas miR-330-3p, miR-330-5p, miR-486-5p, miR-422a and miR-31-star were significantly downregulated (Fig 6B). Further significantly dysregulated, but not yet functionally characterized miRs in both PANC-1-GR as well as MIA-PaCa-2-GR cell clones were not validated by qRT-PCR (miR-935, miR-3178, miR-3195, miR-4497, miR-4634, miR-4734, and miR-4745-5p). Overall, a panel of 18 significantly and concordantly dysregulated miRs (fold change ±2; p<0.05) in both chemoresistant PDAC cell clones was identified.
Target analysis and protein expression of MRP-1, p53, CDK1, and Bcl-2
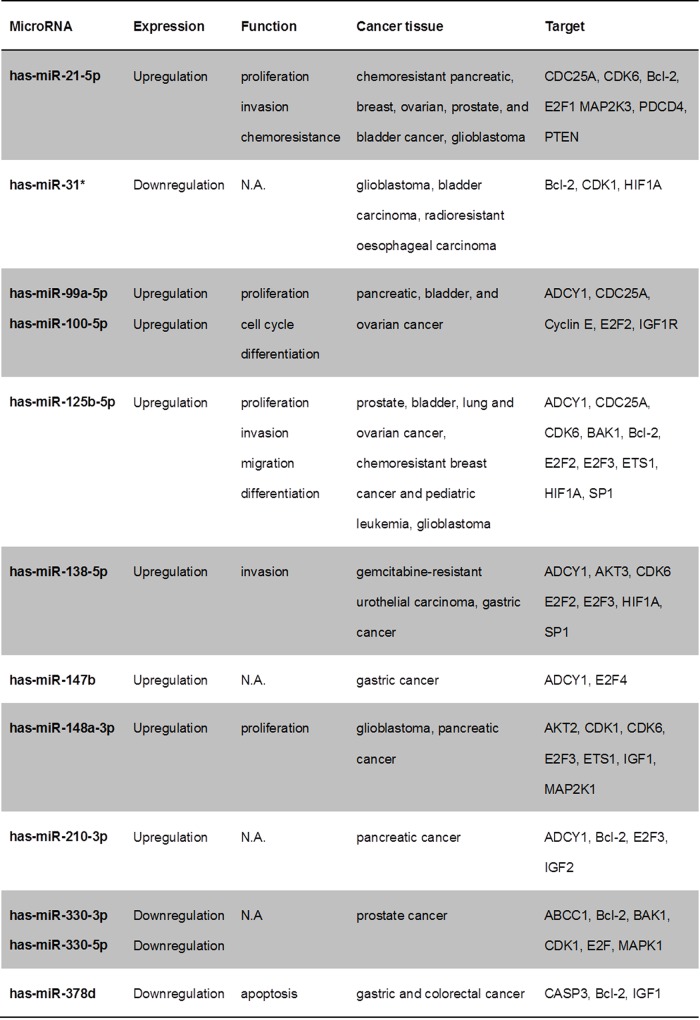
In-silico target analysis of significantly dysregulated miRs in PANC-1-GR and MIA-PaCa-2-GR and of mt-p53 identified regulators of cell cycle, proliferation, and apoptosis (Fig 7). MiR-21-5p, miR-100-5p, miR-125b-5p, miR-210-3p, miR-330-3p, miR-378a-3p, and miR-486-5p are predicted by IPA to be regulated by TP53 gene. Multidrug resistance proteins like MRP-1 (ABCC1) are highly predicted to be regulated by mt-p53, but also by miR-330-5p. Apoptosis and cell cycle regulators like Bcl-2 and CDK-1 are predicted to be regulated by most of the dysregulated miRs in chemoresistant cell clones and by mt-p53.
Fig 7. In-silico target analysis.
Overview of selected and highly predicted gene targets of dysregulated miRs in chemoresistant PDAC cell clones. (N.A., not available)
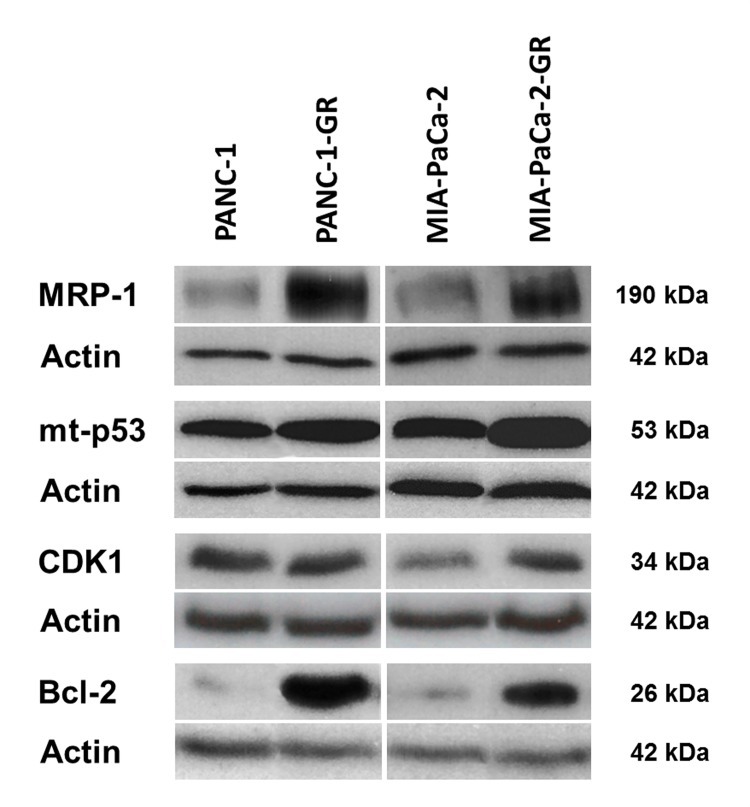
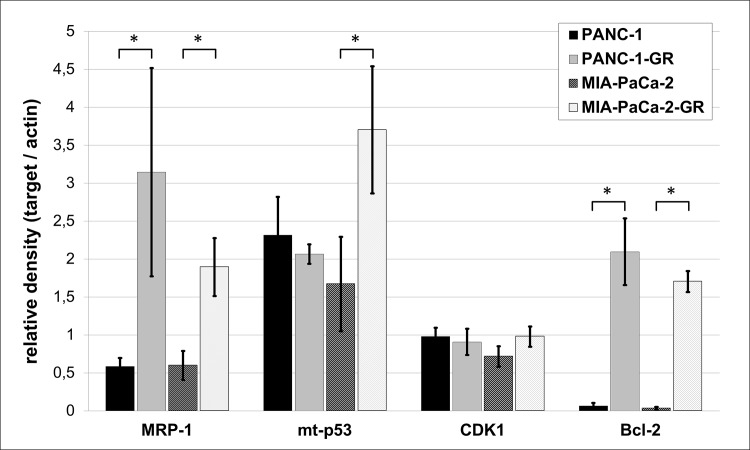
The expression of three target proteins that were selected from the in-silico analysis (p53, CDK1, Bcl-2) and the `classic`drug resistance marker MRP-1 were evaluated in parental and chemoresistant cell clones by Western blot (Figs 8 and 9). MRP-1 was significantly overexpressed in both PANC-1-GR and MIA-PaCa-2-GR cell clones (p = 0.017; p = 0.006), supporting its property as a marker for drug resistance. The miR-target and apoptosis suppressor Bcl-2 was significantly overexpressed in both PANC-1-GR and MIA-PaCa-2-GR cells (p = 0.002; p< 0.0001). High expression of mt-p53 was shown in both chemoresistant cell clones, but significance was only achieved in MIA-PaCa-2-GR (p = 0.023). Expression of the miR- and mt-p53- target and cell cycle regulator CDK1 was increased in MIA-PaCa-2-GR cells but did not reach statistical significance (p = 0.063).
Fig 8. Protein target expression.
Protein expression of MRP-1, mutant p53 (mt p53 R273H and mt p53 R248W), CDK1, Bcl-2, and actin (loading control) in parental (PANC-1, MIA-PaCa-2) and gemcitabine resistant PDAC cell clones (PANC-1-GR, MIA-PaCa-2-GR) by Western blot.
Fig 9. Protein densitometry.
Adjusted relative density of MRP-1, mutant p53 (mt p53 R273H and mt p53 R248W), CDK1, Bcl-2, and their loading controls measured by ImageJ densitometry software. Asterisks indicates to a significant difference of p<0.05, respectively.
Discussion
Chemoresistance to PDAC treatment represents both a clinical and scientific challenge. After initial response, gemcitabine treated PDAC patients finally exhibit disease progression owing to acquired chemoresistance. Therefore, several combinations of gemcitabine and gemcitabine free regimens have been evaluated but very few showed additional benefits with a slight increase in overall survival [9–14]. Understanding primary and secondary chemoresistance is therefore crucial for further clinical developments.
Human PDAC cell lines possess high intrinsic chemoresistance. The method of establishing novel chemotherapy-resistant PDAC cell clones by pulsatile treatment with short periods of exposure and high sublethal concentrations of gemcitabine seems to be an experimental setting which is comparable to the clinical relevant treatment regimens. It applied selective pressure for PANC-1 and MIA-PaCa-2 cell clones with intrinsic mutations, already conferring a degree of chemoresistance. We used the MTT cytotoxicity assay as an established in vitro method to test malignant cell resistance to clinically applied cytostatics [4–7]. It remains unclear whether these in vitro mechanisms of chemoresistance can be directly translated to the clinical setting. In the future, microdissected tumor cells of the same PDAC patients before and after gemcitabine treatment may be recovered and analyzed to identify clinically relevant chemotherapy response markers.
While the crucial role of miRs as key regulators of carcinogenesis has been recognized, little is known about their significance and clinical relevance in regard to chemoresistance.
In the present study, we have for the first time investigated the entire currently known human mature miR spectrum in two of the most studied human PDAC cell lines and their corresponding chemoresistant clones generated by pulsatile gemcitabine treatment with constant treatment dose. Concordant miR profiles were aberrantly expressed in both chemoresistant PDAC cell lines, discriminating them from their parental cell lines. Some of these miRs, such as miR-21, miR-99a, miR-100, and miR-210 are already known as potential oncogenes (oncomiRs) in PDAC. Specifically, miR-21 has been shown to be associated with poorer survival and to induce chemoresistance to gemcitabine in PDAC patients [15]. In smaller clinical studies, miR-210 has been reported to be overexpressed in PDAC patients, correlating with a worse outcome [16]. MiR-99a and miR-100, two members of the miR-99 family, were found by Bloomston et al. to be overexpressed in PDAC tissue compared with normal pancreatic tissue and chronic pancreatitis [17]. Recently, in vitro miR analysis was performed by Bera et al. in BxPC-3 PDAC cells with acquired chemoresistance by gemcitabine treatment with increasing concentrations over a six-week period [18]. In accordance with our results, miR-21, miR-100, and miR-125b were upregulated, whereas miR-455-3p and miR-378 were downregulated in chemoresistant BxPC-3. In addition, miR-330-5p could be detected by Tréhoux et al. as a tumor suppressor in PDAC in vitro and in vivo, sensitizing pancreatic cancer cells to gemcitabine [19]. Other dysregulated miRs identified in the present study have not been described in PDAC but in other carcinoma entities, so far (Fig 7) [20–40].
It appears that the selection of human PDAC cell lines and the manner of drug exposure to generate PDAC cell clones with acquired chemoresistance greatly influence molecular mechanisms of chemoresistance development with impact on the miR profile. In contrast to matching results with Bera et al., miR screening in PDAC cell lines with induced gemcitabine chemoresistance by further study groups revealed different miR profiles that did not correspond to our results. For example, Shen et al. established a chemoresistant cell clone of a wild-type p53 PDAC cell line derived from a spleen metastasis generated after 7 months of continuous gemcitabine induction with increasing concentrations. Iwagami et al. generated chemoresistant cell clones of two mutant p53 primary PDAC cell lines by exposure to gradually increasing concentrations of gemcitabine for 2 months.[18, 41, 42] Based on the analysis of different in vitro models of chemoresistance by Watson et al. the used method of pulsatile gemcitabine treatment represents a much better approximation to the clinical therapy practice with cyclic therapy protocol than the commonly used experimental continuous drug exposure with increasing drug concentrations [43].
Approximately 75% of PDAC patients have TP53 alterations [44]. Therefore, we used two human PDAC cell lines with two of the most frequent hotspot TP53 mutations in the codons 248 (MIA-PaCa-2) and 273 (PANC-1), that do not only lose the wild-type p53 tumor suppressive function, but also gain new oncogenic properties. Through this gain of function (GOF), mutant p53 is believed to actively contribute to cancer development, progression and metastasis in PDAC [44, 45]. Many GOF effects of mutant p53 rely on its ability to bind and inactivate the p53 family members p63 and p73, leading to reduced apoptosis in tumor cells and increased chemoresistance [46]. Overexpression of mutant p53 was demonstrated together with induction of various cell cycle and proliferation associated genes in response to DNA damage [47–49]. Recently, Fiorini et al. showed that gemcitabine treatment stabilized mutant p53 protein in the nuclei of PANC-1 cells and induced chemoresistance, concurrent with the mutant p53-dependent expression of CDK1 and cyclin B1, resulting in hyperproliferation [50]. In accordance with these results, we were able to show an overexpression of mutant p53 and its target protein CDK1 in chemoresistant MIA-PaCa-2 as well as an overexpression of anti-apoptotic Bcl-2 in both chemoresistant cell clones. Inversely, adenoviral vector transfection of the wild-type p53 tumor suppressor gene by Bouvet et al. in mutant p53 MIA-PaCa-2 and PANC-1 induced apoptosis and inhibited tumor cell growth [51]. Moreover, knockdown of endogenous mutant p53 rendered cancer cells more sensitive to DNA-damaging chemotherapeutic agents and reduced tumor malignancy [52]. In 1998 Wada et al. could induce apoptosis with Bcl-2 downregulation in mutant p53 PDAC cell lines by using a CDK- inhibitor.[53] Consistent with our results, loss of proapoptotic wild-type p53 activity and overexpression of oncogenic mutant p53 lead to transcriptional activation of multidrug resistance proteins, like the ATP-binding cassette transporter and drug eliminator MRP-1 [49, 54]. So far, multidrug resistance proteins were not described as targets of the identified chemoresistance-related miRs of this study. The role of microRNA-330-5p, significantly downregulated in both chemoresistant cell clones and highly predicted to target MRP-1 (ABCC1) needs to be confirmed by functional analysis.
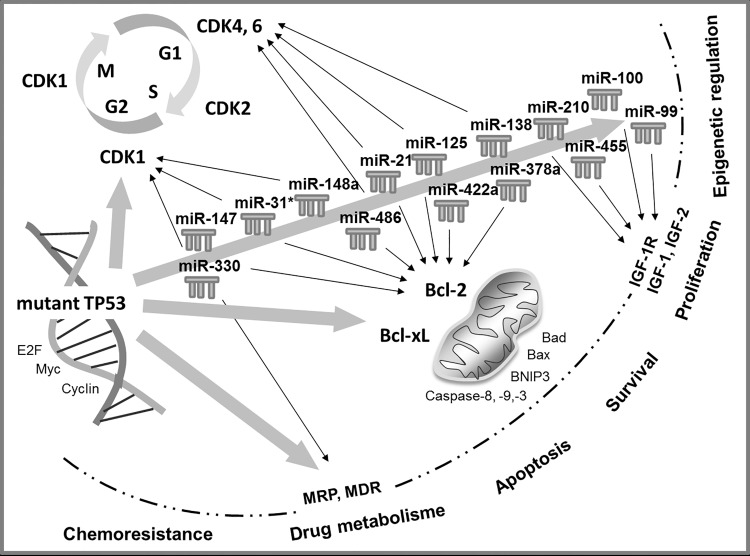
Moreover, recent studies reported that mutant p53 proteins can modulate miR expression [46, 55]. Interestingly, most of our chemoresistance-specific miRs (miR-21-5p, miR-100-5p, miR-125b-5p, miR-210-3p, miR-330-3p, miR-378a-3p, miR-486-5p) are predicted by IPA to be regulated by TP53 gene (Fig 10). Moreover, the predicted targets of these dysregulated miRs are regulators of cell cycle and proliferation or apoptosis (Fig 7). The cell division cycle 25 homolog A (CDC25A), required for progression from G1 to S phase of the cell cycle by activating cyclin-dependent kinases (CDK), is highly predicted to be targeted by miR-21, miR-99a, miR-100, and miR-125b [56]. In addition CDC25A is a target of the E2F family of transcription factors, targeted by most of the detected miRs in chemoresistant PDAC cell clones [57]. E2F1, E2F2 and E2F3a are activators of the cell cycle targeting cyclins, CDKs, DNA repair and replication proteins. Furthermore, cyclins, CDK4, CDK6, ETS1, and the G1 cell cycle phase specific transcription factor SP1 are activated by the mitogen-activated protein kinase (MAPK) signaling pathway, targeted by several dysregulated miRs [58]. The tumor suppressor genes programmed cell death 4 (PDCD4) and phosphatase and tensin homolog (PTEN), also involved in the regulation of cell cycle, are known to be targeted and repressed by miR-21 [15, 59]. Insulin-like growth factor (IGF) and its receptors are further highly predicted targets, overexpressed in most cancer tissues and function as anti-apoptotic regulators. In PDAC IGF1 mediates PTEN suppression and, together with IGF1R, enhances cell invasion and proliferation as well as chemoresistance via activation of the phosphatidylinositol 3-kinase (PI3K)/Akt signaling pathway [60–62]. Akt promotes growth factor-mediated cell survival by inhibiting pro‑apoptotic proteins such as caspase 9 and BAD. Most of identified chemoresistant-specific miRs target transcription of proapoptotic (BAX, BAK, BAD) and anti-apoptotic (Bcl-2) members of the Bcl-2 family. Dong et al. could demonstrate that direct induction of Bcl-2 by miR-21 was associated with proliferation and chemoresistance of MIA-PaCa-2 cells [63]. Our results confirm the role of Bcl-2 as apoptosis-suppressor and oncoprotein, significantly overexpressed in chemoresistant MIA-PaCa-2 and PANC-1 cell clones.
Fig 10. Interaction of mutant TP53 and microRNA signaling pathways in chemoresistant pancreatic cancer.
Target analysis was performed by Ingenuity Pathway Analysis and DIANA-mirPath.
We suggest that under acquired chemoresistance, accumulation of mutant p53 induces expression of miR-21-5p, miR-31*, miR-125b-5p, miR-210-3p, miR-330-3p, miR-378a-3p, miR-422a and miR-486-5p which in turn enhances proliferation by upregulating Bcl-2 expression in PDAC cells.
Taken together, we have identified a panel of miRs associated with induced chemoresistance in PDAC. Target analysis of the dysregulated miRs showed that mutant p53 and the putative miR-targets Bcl-2 and MRP-1 are likely to play a central role in PDAC chemoresistance. However, additional functional validation of deregulated miRs and their protein targets in context of gemcitabine resistance is required to confirm our findings. Furthermore, clinical studies are essential to evaluate whether the identified miR signature of acquired gemcitabine resistance can be used to develop strategies for targeted therapies in chemorefractive PDAC patients.
Acknowledgments
The authors thank Frauke Spiecker, and Ludgera Weber-Koberg for their support and expert technical assistance. We acknowledge support by Förderverein Peter Geiger e.V., Beilstein, Germany and Open Access Publication Fund of University of Muenster. The funders had no role in study design, data collection and analysis, decision to publish, or preparation of the manuscript.
Data Availability
All relevant data are within the paper. Microarray raw data are available through Gene Expression Omnibus accession number GSE74574 (www.ncbi.nlm.nih.gov/geo).
Funding Statement
The authors acknowledge support by Förderverein Peter Geiger e.V., Beilstein, Germany and Open Access Publication Fund of University of Muenster. The funders had no role in study design, data collection and analysis, decision to publish, or preparation of the manuscript.
References
- 1. Siegel R, Ma J, Zou Z, Jemal A. Cancer statistics, 2014. CA Cancer J Clin. 2014;64(1):9–29. Epub 2014/01/09. 10.3322/caac.21208 . [DOI] [PubMed] [Google Scholar]
- 2. Vincent A, Herman J, Schulick R, Hruban RH, Goggins M. Pancreatic cancer. Lancet. 2011;378(9791):607–20. Epub 2011/05/31. 10.1016/S0140-6736(10)62307-0 . [DOI] [PMC free article] [PubMed] [Google Scholar]
- 3. Dhayat S, Mardin WA, Mees ST, Haier J. Epigenetic markers for chemosensitivity and chemoresistance in pancreatic cancer—a review. Int J Cancer. 2011;129(5):1031–41. Epub 2011/03/18. 10.1002/ijc.26078 . [DOI] [PubMed] [Google Scholar]
- 4. Scudiero DA, Shoemaker RH, Paull KD, Monks A, Tierney S, Nofziger TH, et al. Evaluation of a soluble tetrazolium/formazan assay for cell growth and drug sensitivity in culture using human and other tumor cell lines. Cancer Res. 1988;48(17):4827–33. Epub 1988/09/01. . [PubMed] [Google Scholar]
- 5. Twentyman PR, Luscombe M. A study of some variables in a tetrazolium dye (MTT) based assay for cell growth and chemosensitivity. Br J Cancer. 1987;56(3):279–85. Epub 1987/09/01. [DOI] [PMC free article] [PubMed] [Google Scholar]
- 6. Carmichael J, Mitchell JB, DeGraff WG, Gamson J, Gazdar AF, Johnson BE, et al. Chemosensitivity testing of human lung cancer cell lines using the MTT assay. Br J Cancer. 1988;57(6):540–7. Epub 1988/06/01. [DOI] [PMC free article] [PubMed] [Google Scholar]
- 7. Campling BG, Pym J, Baker HM, Cole SP, Lam YM. Chemosensitivity testing of small cell lung cancer using the MTT assay. Br J Cancer. 1991;63(1):75–83. Epub 1991/01/01. [DOI] [PMC free article] [PubMed] [Google Scholar]
- 8. Deer EL, Gonzalez-Hernandez J, Coursen JD, Shea JE, Ngatia J, Scaife CL, et al. Phenotype and genotype of pancreatic cancer cell lines. Pancreas. 2010;39(4):425–35. Epub 2010/04/27. 10.1097/MPA.0b013e3181c15963 [DOI] [PMC free article] [PubMed] [Google Scholar]
- 9. Sheikh R, Walsh N, Clynes M, O'Connor R, McDermott R. Challenges of drug resistance in the management of pancreatic cancer. Expert Rev Anticancer Ther. 2010;10(10):1647–61. Epub 2010/10/15. 10.1586/era.10.148 . [DOI] [PubMed] [Google Scholar]
- 10. Veltkamp SA, Beijnen JH, Schellens JH. Prolonged versus standard gemcitabine infusion: translation of molecular pharmacology to new treatment strategy. Oncologist. 2008;13(3):261–76. Epub 2008/04/02. 10.1634/theoncologist.2007-0215 . [DOI] [PubMed] [Google Scholar]
- 11. Marechal R, Bachet JB, Mackey JR, Dalban C, Demetter P, Graham K, et al. Levels of gemcitabine transport and metabolism proteins predict survival times of patients treated with gemcitabine for pancreatic adenocarcinoma. Gastroenterology. 2012;143(3):664–74 e1-6. Epub 2012/06/19. 10.1053/j.gastro.2012.06.006 . [DOI] [PubMed] [Google Scholar]
- 12. Koay EJ, Truty MJ, Cristini V, Thomas RM, Chen R, Chatterjee D, et al. Transport properties of pancreatic cancer describe gemcitabine delivery and response. J Clin Invest. 2014;124(4):1525–36. Epub 2014/03/13. 10.1172/JCI73455 [DOI] [PMC free article] [PubMed] [Google Scholar]
- 13. Greenhalf W, Ghaneh P, Neoptolemos JP, Palmer DH, Cox TF, Lamb RF, et al. Pancreatic cancer hENT1 expression and survival from gemcitabine in patients from the ESPAC-3 trial. J Natl Cancer Inst. 2014;106(1):djt347. Epub 2013/12/05. 10.1093/jnci/djt347 . [DOI] [PubMed] [Google Scholar]
- 14. Matsubara J, Ono M, Honda K, Negishi A, Ueno H, Okusaka T, et al. Survival prediction for pancreatic cancer patients receiving gemcitabine treatment. Mol Cell Proteomics. 2010;9(4):695–704. Epub 2010/01/12. 10.1074/mcp.M900234-MCP200 [DOI] [PMC free article] [PubMed] [Google Scholar]
- 15. Giovannetti E, Funel N, Peters GJ, Del Chiaro M, Erozenci LA, Vasile E, et al. MicroRNA-21 in pancreatic cancer: correlation with clinical outcome and pharmacologic aspects underlying its role in the modulation of gemcitabine activity. Cancer Res. 2010;70(11):4528–38. Epub 2010/05/13. 10.1158/0008-5472.CAN-09-4467 . [DOI] [PubMed] [Google Scholar]
- 16. Ho AS, Huang X, Cao H, Christman-Skieller C, Bennewith K, Le QT, et al. Circulating miR-210 as a Novel Hypoxia Marker in Pancreatic Cancer. Transl Oncol. 2010;3(2):109–13. Epub 2010/04/03. [DOI] [PMC free article] [PubMed] [Google Scholar]
- 17. Bloomston M, Frankel WL, Petrocca F, Volinia S, Alder H, Hagan JP, et al. MicroRNA expression patterns to differentiate pancreatic adenocarcinoma from normal pancreas and chronic pancreatitis. Jama. 2007;297(17):1901–8. Epub 2007/05/03. 10.1001/jama.297.17.1901 . [DOI] [PubMed] [Google Scholar]
- 18. Bera A, VenkataSubbaRao K, Manoharan MS, Hill P, Freeman JW. A miRNA signature of chemoresistant mesenchymal phenotype identifies novel molecular targets associated with advanced pancreatic cancer. PLoS One. 2014;9(9):e106343 Epub 2014/09/04. 10.1371/journal.pone.0106343 [DOI] [PMC free article] [PubMed] [Google Scholar]
- 19. Trehoux S, Lahdaoui F, Delpu Y, Renaud F, Leteurtre E, Torrisani J, et al. Micro-RNAs miR-29a and miR-330-5p function as tumor suppressors by targeting the MUC1 mucin in pancreatic cancer cells. Biochim Biophys Acta. 2015;1853(10 Pt A):2392–403. Epub 2015/06/04. 10.1016/j.bbamcr.2015.05.033 . [DOI] [PubMed] [Google Scholar]
- 20. Shi XB, Xue L, Ma AH, Tepper CG, Kung HJ, White RW. miR-125b promotes growth of prostate cancer xenograft tumor through targeting pro-apoptotic genes. Prostate. 2011;71(5):538–49. Epub 2010/10/05. 10.1002/pros.21270 [DOI] [PMC free article] [PubMed] [Google Scholar]
- 21. Wu N, Lin X, Zhao X, Zheng L, Xiao L, Liu J, et al. MiR-125b acts as an oncogene in glioblastoma cells and inhibits cell apoptosis through p53 and p38MAPK-independent pathways. Br J Cancer. 2013;109(11):2853–63. Epub 2013/10/31. 10.1038/bjc.2013.672 [DOI] [PMC free article] [PubMed] [Google Scholar]
- 22. Zhou M, Liu Z, Zhao Y, Ding Y, Liu H, Xi Y, et al. MicroRNA-125b confers the resistance of breast cancer cells to paclitaxel through suppression of pro-apoptotic Bcl-2 antagonist killer 1 (Bak1) expression. J Biol Chem. 2010;285(28):21496–507. Epub 2010/05/13. 10.1074/jbc.M109.083337 [DOI] [PMC free article] [PubMed] [Google Scholar]
- 23. Emmrich S, Rasche M, Schoning J, Reimer C, Keihani S, Maroz A, et al. miR-99a/100~125b tricistrons regulate hematopoietic stem and progenitor cell homeostasis by shifting the balance between TGFbeta and Wnt signaling. Genes Dev. 2014;28(8):858–74. Epub 2014/04/17. 10.1101/gad.233791.113 [DOI] [PMC free article] [PubMed] [Google Scholar]
- 24. Song T, Xia W, Shao N, Zhang X, Wang C, Wu Y, et al. Differential miRNA expression profiles in bladder urothelial carcinomas. Asian Pac J Cancer Prev. 2010;11(4):905–11. Epub 2010/12/08. . [PubMed] [Google Scholar]
- 25. Nam EJ, Yoon H, Kim SW, Kim H, Kim YT, Kim JH, et al. MicroRNA expression profiles in serous ovarian carcinoma. Clin Cancer Res. 2008;14(9):2690–5. Epub 2008/05/03. 10.1158/1078-0432.CCR-07-1731 . [DOI] [PubMed] [Google Scholar]
- 26. Kozinn SI, Harty NJ, Delong JM, Deliyiannis C, Logvinenko T, Summerhayes IC, et al. MicroRNA Profile to Predict Gemcitabine Resistance in Bladder Carcinoma Cell Lines. Genes Cancer. 2013;4(1–2):61–9. Epub 2013/08/16. 10.1177/1947601913484495 [DOI] [PMC free article] [PubMed] [Google Scholar]
- 27. Ujifuku K, Mitsutake N, Takakura S, Matsuse M, Saenko V, Suzuki K, et al. miR-195, miR-455-3p and miR-10a (*) are implicated in acquired temozolomide resistance in glioblastoma multiforme cells. Cancer Lett. 2010;296(2):241–8. Epub 2010/05/07. 10.1016/j.canlet.2010.04.013 . [DOI] [PubMed] [Google Scholar]
- 28. Yao Y, Suo AL, Li ZF, Liu LY, Tian T, Ni L, et al. MicroRNA profiling of human gastric cancer. Mol Med Rep. 2009;2(6):963–70. Epub 2009/11/01. 10.3892/mmr_00000199 . [DOI] [PubMed] [Google Scholar]
- 29. Zhang GJ, Zhou H, Xiao HX, Li Y, Zhou T. MiR-378 is an independent prognostic factor and inhibits cell growth and invasion in colorectal cancer. BMC Cancer. 2014;14:109 Epub 2014/02/22. 10.1186/1471-2407-14-109 [DOI] [PMC free article] [PubMed] [Google Scholar]
- 30. Lee KH, Chen YL, Yeh SD, Hsiao M, Lin JT, Goan YG, et al. MicroRNA-330 acts as tumor suppressor and induces apoptosis of prostate cancer cells through E2F1-mediated suppression of Akt phosphorylation. Oncogene. 2009;28(38):3360–70. Epub 2009/07/15. 10.1038/onc.2009.192 . [DOI] [PubMed] [Google Scholar]
- 31. Wang J, Tian X, Han R, Zhang X, Wang X, Shen H, et al. Downregulation of miR-486-5p contributes to tumor progression and metastasis by targeting protumorigenic ARHGAP5 in lung cancer. Oncogene. 2014;33(9):1181–9. Epub 2013/03/12. 10.1038/onc.2013.42 [DOI] [PMC free article] [PubMed] [Google Scholar]
- 32. Tahiri A, Leivonen SK, Luders T, Steinfeld I, Ragle Aure M, Geisler J, et al. Deregulation of cancer-related miRNAs is a common event in both benign and malignant human breast tumors. Carcinogenesis. 2014;35(1):76–85. Epub 2013/10/10. 10.1093/carcin/bgt333 . [DOI] [PubMed] [Google Scholar]
- 33. Oh HK, Tan AL, Das K, Ooi CH, Deng NT, Tan IB, et al. Genomic loss of miR-486 regulates tumor progression and the OLFM4 antiapoptotic factor in gastric cancer. Clin Cancer Res. 2011;17(9):2657–67. Epub 2011/03/19. 10.1158/1078-0432.CCR-10-3152 . [DOI] [PubMed] [Google Scholar]
- 34. Wang S, Jiao B, Geng S, Song J, Liang Z, Lu S. Concomitant microRNA-31 downregulation and radixin upregulation predicts advanced tumor progression and unfavorable prognosis in patients with gliomas. J Neurol Sci. 2014;338(1–2):71–6. Epub 2014/01/02. 10.1016/j.jns.2013.12.019 . [DOI] [PubMed] [Google Scholar]
- 35. Wang S, Li Q, Wang K, Dai Y, Yang J, Xue S, et al. Decreased expression of microRNA-31 associates with aggressive tumor progression and poor prognosis in patients with bladder cancer. Clin Transl Oncol. 2013;15(10):849–54. Epub 2013/02/15. 10.1007/s12094-013-1014-4 . [DOI] [PubMed] [Google Scholar]
- 36. Lynam-Lennon N, Reynolds JV, Marignol L, Sheils OM, Pidgeon GP, Maher SG. MicroRNA-31 modulates tumour sensitivity to radiation in oesophageal adenocarcinoma. J Mol Med (Berl). 2012;90(12):1449–58. Epub 2012/06/19. 10.1007/s00109-012-0924-x . [DOI] [PubMed] [Google Scholar]
- 37. Delpu Y, Lulka H, Sicard F, Saint-Laurent N, Lopez F, Hanoun N, et al. The rescue of miR-148a expression in pancreatic cancer: an inappropriate therapeutic tool. PLoS One. 2013;8(1):e55513 Epub 2013/02/06. 10.1371/journal.pone.0055513 [DOI] [PMC free article] [PubMed] [Google Scholar]
- 38. Kim J, Zhang Y, Skalski M, Hayes J, Kefas B, Schiff D, et al. microRNA-148a is a prognostic oncomiR that targets MIG6 and BIM to regulate EGFR and apoptosis in glioblastoma. Cancer Res. 2014;74(5):1541–53. Epub 2014/01/16. 10.1158/0008-5472.CAN-13-1449 [DOI] [PMC free article] [PubMed] [Google Scholar]
- 39. Cui EH, Li HJ, Hua F, Wang B, Mao W, Feng XR, et al. Serum microRNA 125b as a diagnostic or prognostic biomarker for advanced NSCLC patients receiving cisplatin-based chemotherapy. Acta Pharmacol Sin. 2013;34(2):309–13. Epub 2012/09/18. 10.1038/aps.2012.125 [DOI] [PMC free article] [PubMed] [Google Scholar]
- 40. Wang H, Tan G, Dong L, Cheng L, Li K, Wang Z, et al. Circulating MiR-125b as a marker predicting chemoresistance in breast cancer. PLoS One. 2012;7(4):e34210 Epub 2012/04/24. 10.1371/journal.pone.0034210 [DOI] [PMC free article] [PubMed] [Google Scholar]
- 41. Shen Y, Pan Y, Xu L, Chen L, Liu L, Chen H, et al. Identifying microRNA-mRNA regulatory network in gemcitabine-resistant cells derived from human pancreatic cancer cells. Tumour Biol. 2015;36(6):4525–34. Epub 2015/02/28. 10.1007/s13277-015-3097-8 . [DOI] [PubMed] [Google Scholar]
- 42. Iwagami Y, Eguchi H, Nagano H, Akita H, Hama N, Wada H, et al. miR-320c regulates gemcitabine-resistance in pancreatic cancer via SMARCC1. Br J Cancer. 2013;109(2):502–11. Epub 2013/06/27. 10.1038/bjc.2013.320 [DOI] [PMC free article] [PubMed] [Google Scholar]
- 43. Watson MB, Lind MJ, Cawkwell L. Establishment of in-vitro models of chemotherapy resistance. Anticancer Drugs. 2007;18(7):749–54. Epub 2007/06/22. 10.1097/CAD.0b013e3280a02f43 . [DOI] [PubMed] [Google Scholar]
- 44. Weissmueller S, Manchado E, Saborowski M, Morris JPt, Wagenblast E, Davis CA, et al. Mutant p53 drives pancreatic cancer metastasis through cell-autonomous PDGF receptor beta signaling. Cell. 2014;157(2):382–94. Epub 2014/04/15. 10.1016/j.cell.2014.01.066 [DOI] [PMC free article] [PubMed] [Google Scholar]
- 45. Brosh R, Rotter V. When mutants gain new powers: news from the mutant p53 field. Nat Rev Cancer. 2009;9(10):701–13. Epub 2009/08/21. 10.1038/nrc2693 . [DOI] [PubMed] [Google Scholar]
- 46. Masciarelli S, Fontemaggi G, Di Agostino S, Donzelli S, Carcarino E, Strano S, et al. Gain-of-function mutant p53 downregulates miR-223 contributing to chemoresistance of cultured tumor cells. Oncogene. 2014;33(12):1601–8. Epub 2013/04/16. 10.1038/onc.2013.106 . [DOI] [PubMed] [Google Scholar]
- 47. Scian MJ, Stagliano KE, Ellis MA, Hassan S, Bowman M, Miles MF, et al. Modulation of gene expression by tumor-derived p53 mutants. Cancer Res. 2004;64(20):7447–54. Epub 2004/10/20. 10.1158/0008-5472.CAN-04-1568 . [DOI] [PubMed] [Google Scholar]
- 48. Gurtner A, Starace G, Norelli G, Piaggio G, Sacchi A, Bossi G. Mutant p53-induced up-regulation of mitogen-activated protein kinase kinase 3 contributes to gain of function. J Biol Chem. 2010;285(19):14160–9. Epub 2010/03/13. 10.1074/jbc.M109.094813 [DOI] [PMC free article] [PubMed] [Google Scholar]
- 49. Freed-Pastor WA, Prives C. Mutant p53: one name, many proteins. Genes Dev. 2012;26(12):1268–86. Epub 2012/06/21. 10.1101/gad.190678.112 [DOI] [PMC free article] [PubMed] [Google Scholar]
- 50. Fiorini C, Cordani M, Padroni C, Blandino G, Di Agostino S, Donadelli M. Mutant p53 stimulates chemoresistance of pancreatic adenocarcinoma cells to gemcitabine. Biochim Biophys Acta. 2015;1853(1):89–100. Epub 2014/10/15. 10.1016/j.bbamcr.2014.10.003 . [DOI] [PubMed] [Google Scholar]
- 51. Bouvet M, Bold RJ, Lee J, Evans DB, Abbruzzese JL, Chiao PJ, et al. Adenovirus-mediated wild-type p53 tumor suppressor gene therapy induces apoptosis and suppresses growth of human pancreatic cancer [seecomments]. Ann Surg Oncol. 1998;5(8):681–8. Epub 1998/12/30. . [DOI] [PubMed] [Google Scholar]
- 52. Blandino G, Levine AJ, Oren M. Mutant p53 gain of function: differential effects of different p53 mutants on resistance of cultured cells to chemotherapy. Oncogene. 1999;18(2):477–85. Epub 1999/02/02. . [DOI] [PubMed] [Google Scholar]
- 53. Wada M, Hosotani R, Lee JU, Doi R, Koshiba T, Fujimoto K, et al. An exogenous cdk inhibitor, butyrolactone-I, induces apoptosis with increased Bax/Bcl-2 ratio in p53-mutated pancreatic cancer cells. Anticancer Res. 1998;18(4A):2559–66. Epub 1998/08/15. . [PubMed] [Google Scholar]
- 54. Wang Q, Beck WT. Transcriptional suppression of multidrug resistance-associated protein (MRP) gene expression by wild-type p53. Cancer Res. 1998;58(24):5762–9. Epub 1998/12/29. . [PubMed] [Google Scholar]
- 55. Li XL, Jones MF, Subramanian M, Lal A. Mutant p53 exerts oncogenic effects through microRNAs and their target gene networks. FEBS Lett. 2014;588(16):2610–5. Epub 2014/04/15. 10.1016/j.febslet.2014.03.054 . [DOI] [PMC free article] [PubMed] [Google Scholar]
- 56. Wang P, Zou F, Zhang X, Li H, Dulak A, Tomko RJ Jr., et al. microRNA-21 negatively regulates Cdc25A and cell cycle progression in colon cancer cells. Cancer Res. 2009;69(20):8157–65. Epub 2009/10/15. 10.1158/0008-5472.CAN-09-1996 [DOI] [PMC free article] [PubMed] [Google Scholar]
- 57. Reichert M, Saur D, Hamacher R, Schmid RM, Schneider G. Phosphoinositide-3-kinase signaling controls S-phase kinase-associated protein 2 transcription via E2F1 in pancreatic ductal adenocarcinoma cells. Cancer Res. 2007;67(9):4149–56. Epub 2007/05/08. 10.1158/0008-5472.CAN-06-4484 . [DOI] [PubMed] [Google Scholar]
- 58. Kopper F, Binkowski AM, Bierwirth C, Dobbelstein M. The MAPK-activated protein kinase 2 mediates gemcitabine sensitivity in pancreatic cancer cells. Cell Cycle. 2014;13(6):884–9. Epub 2014/02/22. 10.4161/cc.28292 [DOI] [PMC free article] [PubMed] [Google Scholar]
- 59. Frankel LB, Christoffersen NR, Jacobsen A, Lindow M, Krogh A, Lund AH. Programmed cell death 4 (PDCD4) is an important functional target of the microRNA miR-21 in breast cancer cells. J Biol Chem. 2008;283(2):1026–33. Epub 2007/11/10. 10.1074/jbc.M707224200 . [DOI] [PubMed] [Google Scholar]
- 60. Ma J, Sawai H, Matsuo Y, Ochi N, Yasuda A, Takahashi H, et al. IGF-1 mediates PTEN suppression and enhances cell invasion and proliferation via activation of the IGF-1/PI3K/Akt signaling pathway in pancreatic cancer cells. J Surg Res. 2010;160(1):90–101. Epub 2009/06/30. 10.1016/j.jss.2008.08.016 . [DOI] [PubMed] [Google Scholar]
- 61. Li B, Tsao SW, Chan KW, Ludwig DL, Novosyadlyy R, Li YY, et al. Id1-induced IGF-II and its autocrine/endocrine promotion of esophageal cancer progression and chemoresistance—implications for IGF-II and IGF-IR-targeted therapy. Clin Cancer Res. 2014;20(10):2651–62. Epub 2014/03/07. 10.1158/1078-0432.CCR-13-2735 . [DOI] [PubMed] [Google Scholar]
- 62. Tian X, Hao K, Qin C, Xie K, Xie X, Yang Y. Insulin-like growth factor 1 receptor promotes the growth and chemoresistance of pancreatic cancer. Dig Dis Sci. 2013;58(9):2705–12. Epub 2013/04/17. 10.1007/s10620-013-2673-2 . [DOI] [PubMed] [Google Scholar]
- 63. Dong J, Zhao YP, Zhou L, Zhang TP, Chen G. Bcl-2 upregulation induced by miR-21 via a direct interaction is associated with apoptosis and chemoresistance in MIA PaCa-2 pancreatic cancer cells. Arch Med Res. 2011;42(1):8–14. Epub 2011/03/08. 10.1016/j.arcmed.2011.01.006 . [DOI] [PubMed] [Google Scholar]
Associated Data
This section collects any data citations, data availability statements, or supplementary materials included in this article.
Data Availability Statement
All relevant data are within the paper. Microarray raw data are available through Gene Expression Omnibus accession number GSE74574 (www.ncbi.nlm.nih.gov/geo).


