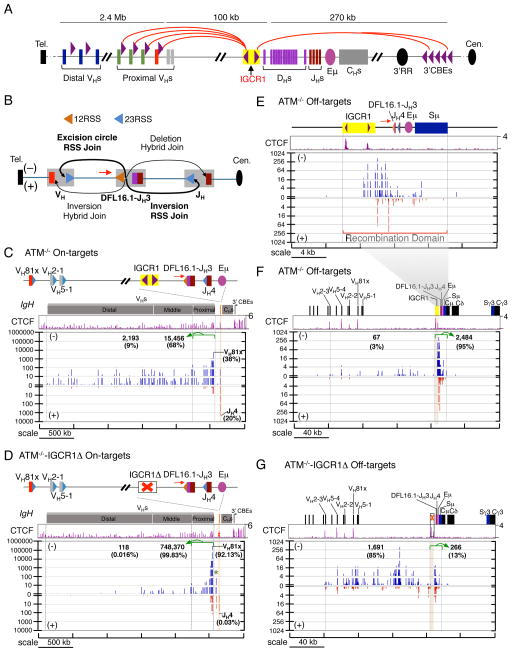
Figure 6. Effect of IGCR1 Deletion on RAG Targeting in the IgH Locus.
(A) Schematic of murine IgH locus. Purple arrowheads indicate position and orientation of CBEs. Red arches show proposed looping between convergent IgH CBEs (Lin et al., 2015). (B) Illustration of possible joining outcomes between bona fide RSSs from DFL16.1 5′ RSS bait end to upstream VH and downstream JH broken ends. Red arrows in all panels indicate the position and orientation of HTGTS primer. (C,D) Upper panels are IgH annotation track. Middle panels show CTCF ChIP-seq profiles. Lower panels are pooled HTGTS junction profiles for IgH bona fide RSSs (n=3). Junctions are displayed as stacked tracks (log scale between tracks, linear scale within each track). Junction numbers and percentages as of total IgH on-targets in indicated regions are shown. We note that beyond junctions described in the text we also detected junctions between DFL16.1 5′RSS and pseudo DH RSSs in the VH to DH intervening region in ATM−/−-IGCR1Δ cells (Green star; see also Figure S6E). We also found a very small number of hybrid joins to VH coding ends (+ joins) or JH4 coding end (− joins). (E) Pooled RAG off-target junction profile of a 24-kb region including the recombination domain for ATM-deficient cells (n=3). (F, G) show pooled RAG off-target junction profiles of a 240-kb region including the recombination domain for ATM-deficient cells with (F) or without (G) IGCR1, respectively (n=3). Brown shadowed region marks the location of IGCR1. Junction numbers and percentages as of total IgH off-targets in indicated regions are shown. See also Figure S6 and Table S4.

