Abstract
Visual cortical prostheses have the potential to restore partial vision. Still limited by the low-resolution visual percepts provided by visual cortical prostheses, implant wearers can currently only “see” pixelized images, and how to obtain the specific brain responses to different pixelized images in the primary visual cortex (the implant area) is still unknown. We conducted a functional magnetic resonance imaging experiment on normal human participants to investigate the brain activation patterns in response to 18 different pixelized images. There were 100 voxels in the brain activation pattern that were selected from the primary visual cortex, and voxel size was 4 mm × 4 mm × 4 mm. Multi-voxel pattern analysis was used to test if these 18 different brain activation patterns were specific. We chose a Linear Support Vector Machine (LSVM) as the classifier in this study. The results showed that the classification accuracies of different brain activation patterns were significantly above chance level, which suggests that the classifier can successfully distinguish the brain activation patterns. Our results suggest that the specific brain activation patterns to different pixelized images can be obtained in the primary visual cortex using a 4 mm × 4 mm × 4 mm voxel size and a 100-voxel pattern.
Keywords: nerve regeneration, primary visual cortex, electrical stimulation, visual cortical prosthesis, low resolution vision, pixelized image, functional magnetic resonance imaging, voxel size, neural regeneration, brain activation pattern
Introduction
Visual cortical prostheses can provide partial visual information to implant wearers by electrically stimulating their remaining functional visual cortical neurons (Brindley and Lewin, 1968; Dobelle et al., 1974). At present, because the number of implantable electrodes is limited, implant wearers can only “see” low-resolution pixelized images of objects (Dobelle et al., 1976; Normann et al., 1999). It is important to investigate how to design the low-resolution electrical stimulation to evoke the desired brain responses (Fernandez et al., 2005; Morillas et al., 2007). Specifically, we need to learn how different two patterns of electrical stimulation must be to evoke two specific brain responses that allow the wearers to “see” two different pixelized images (Normann et al., 2009). The specific brain responses in the primary visual cortex (the implant area) evoked by the different pixelized images will hopefully help the design of electrical stimulation patterns. However, how to obtain the specific brain responses to different pixelized images is still unknown.
Recent functional magnetic resonance imaging (fMRI) studies have shown that visual stimuli can be decoded using brain activation patterns from multiple voxels (Haynes and Rees, 2006; Norman et al., 2006). Previous studies have suggested that brain activation patterns have many potential applications for cortical neural prostheses (Kay and Gallant, 2009; Smith et al., 2013). For example, a recent study has shown that it is possible to control a prosthetic device using brain activation patterns in the motor cortex (Velliste et al., 2008). Therefore, it is hoped that brain activation patterns can improve the design of electrical stimulation for visual cortical prostheses (Figure 1). Brain responses were recorded while a participant viewed a “triangle”, and the brain activation pattern evoked by the “triangle” could be obtained. Using electrical stimulation, we could also obtain a brain activation pattern. If the brain activation pattern evoked by the electrical stimulation approaches the brain activity pattern evoked by the “triangle”, then the pixelized images elicited by the electrical stimulation may be similar to the “triangle”. Therefore, we hope that the brain activation patterns evoked by the pixelized images can be used to improve the design of the electrical stimulation.
Figure 1.
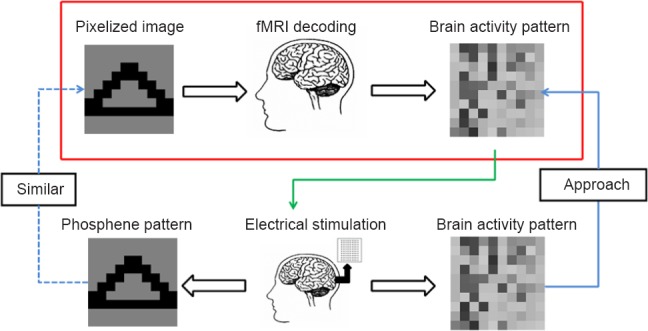
Illustration of the approach to improve the electrical stimulation design.
The brain activation pattern evoked by the “triangle” can be obtained using functional magnetic resonance imaging (fMRI) recoding. Using electrical stimulation, a brain activation pattern can also be obtained. If the brain activation pattern evoked by the electrical stimulation approaches the brain activity pattern evoked by the “triangle” (blue solid line), then the pixelized images elicited by the electrical stimulation may be similar to the “triangle” (blue dotted line). Therefore, hopefully the brain activation patterns evoked by the pixelized images can be used to improve the design of the electrical stimulation (green line). In this study, we used fMRI to obtain the brain activation patterns and multi-voxel pattern analysis to test whether they were specific (red frame).
The appropriate resolution of the electrical stimulation needs to be determined first. Implant wearers could provide some suggestions (Schmidt et al., 1996; Dobelle, 2000); however, because of clinical limitations, recent studies have investigated this issue in normal participants (Thompson et al., 2003; Chen et al., 2005; Chai et al., 2007; Guo et al., 2010, 2013; Zhao et al., 2011; Chang et al., 2012; Li et al., 2012; Wang et al., 2014). In this study, the resolution of electrical stimulation was determined as 10 × 10 based on the behavioral performances of normal participants, and the technological feasibility of the electrode array. Five volunteers participated in an independent behavioural experiment to address whether the 10 × 10 pixelized images could be recognized. The high recognition accuracies (the average recognition accuracy = 89%) of the 18 pixelized images suggested that useful visual information could be received. Moreover, we have already successfully produced the 10 × 10 electrode array, and have performed a preliminary implantation experiment (Chen et al., 2010).
Participants and Methods
Participants
Six volunteers, consisting of three females and three males aged 24 ± 4 years, participated in the fMRI experiment. All participants had normal or corrected-to-normal visual acuity. All of the participants gave written informed consent and were compensated for their time. The study was approved by the Committee for the Protection of Human Subjects at Dartmouth College in the United States.
Stimuli and image processing
Three categories were used in this study: English letters, visual acuity charts and simple shapes. There were six different pixelized images in each category: the English letters were C, Q, U, B, M and E (the abbreviation of our institution); the visual acuity charts included three different orientations of the letters C and E; and the simple shapes were upright/inverted images of a triangle, a T shape, and horizontal/vertical images of a rectangle. A total of 18 pixelized images were used in this study.
An image-processing model was designed to convert the original image into a pixelized image. To substantially simplify the pixelized image, we only chose those pixels that were related to the basic structure of the original image (Figure 2). The pixelized image was generated according to the following steps: (1) Overlap the original image onto the 10 × 10 pixel array. (2) Obtain the blocking image according to the overlapping image. (3) Calculate the pixel value γ as
Figure 2.
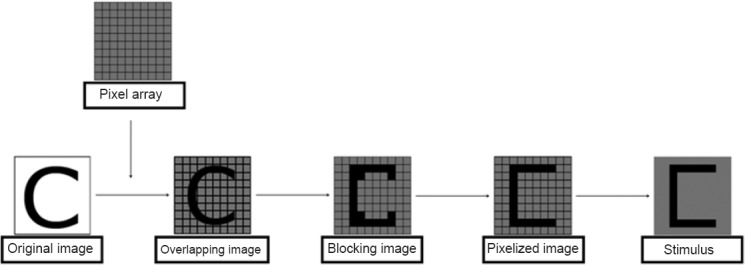
The image-processing model for generating pixelized images.
The original image was overlapped onto a 10 × 10 pixel array to obtain the overlapping image. The pixel value was calculated based on the blocking image that was obtained from the overlapping image. Finally, we selected the pixels with the value “1” to form the pixelized image.

i = 1, 2, 3… 10; j = 1, 2, 3… 10
Here, ωi,j (ith row and jth column in the 10 × 10 pixel array) is the area covered by the original image, and ω0 is the area of each pixel in the 10 × 10 pixel array. (4) Select the pixels with the value “1” to form the pixelized image. (5) Remove the grid from the pixelized image, and set the background to a uniform grey level.
An independent group of five volunteers participated in the behavioural experiments to address if the 18 pixelized images can be recognized. The high recognition accuracies (average recognition accuracy = 89%) of the 18 pixelized images suggested that useful visual information could be received.
MRI acquisition
All brain images were acquired on a 3.0-T Philips scanner (Philips, Andover, MA, USA) at the Dartmouth Brain Imaging Center in the United States. An echo planar imaging sequence was used to acquire functional images (repetition time = 2,000 ms, echo time = 35 ms, voxel size = 3 mm × 3 mm × 3 mm, 35 slices). Magnetization prepared rapid gradient-echo (MPRAGE) was used to acquire the anatomical T1 images at the end of the experiment for each participant (repetition time = 2,000 ms, echo time = 3.7 ms, voxel size = 1 mm × 1 mm × 1 mm, 156 slices).
Experimental design
There were seven scanning runs for each participant. Each run included eighteen 12-second stimulus blocks interleaved with eighteen 12-second fixation blocks. The total duration was 7 minutes 24 seconds, including a 12-second fixation block at the beginning of the run. Each of the eighteen stimulus blocks contained only one pixelized image, which was repeatedly presented for 500 ms followed by a blank screen for 500 ms. The stimuli were presented in the scanner via an LCD projector (Panasonic, Newark, NJ, USA) (Panasonic PT-D4000U, 1,024 × 768 pixels resolution) using Psychtoolbox (Brainard 1997).
MRI data pre-processing
AFNI (Analysis of Functional Neuro Images, http://afni.nimh.nih.gov/afni) was used for data pre-processing. The functional images were motion corrected to the image acquired closest to the anatomical image and spatial smoothing was applied with a 4-mm full width at half maximum filter (FWHM). The anatomical T1 images were aligned to the functional images.
The primary visual cortex in both hemispheres was localized as the region of interest (ROI). A mask of Brodmann area 17 (N27 template) was aligned to the functional images of each participant to obtain the anatomical landmark of BA17. In each anatomical landmark of BA17, the ROI was defined using Stimuli Blocks > Fixation Blocks (P < 0.0001 uncorrected). The size of the ROI was restricted to 100 voxels. Bold average signals were extracted for each participant and were then averaged.
Multi-voxel pattern analysis (MVPA)
MVPA was performed using PyMVPA (Python Multi-voxel pattern analysis, http://www.pymvpa.org). First, the pre-processed fMRI data were normalized (z-score) and block-averaged. Second, we tested the specificity of the brain activation patterns that were evoked by the different pixelized images using linear support vector machines (SVMs). Classification training and testing was performed using a leave-one-scan-out cross-validation procedure.
In this study, shown as Figure 3, MVPA was performed according to the following steps: (1) Brain responses were recorded while the participant viewed pixelized images. The 100 voxels in the ROI were included in the MVPA. (2) The fMRI time series were decomposed into discrete brain activation patterns that correspond to the pattern of activity across the selected voxels at a particular point in time. Each brain activation pattern was labeled according to the corresponding pixelized image. (3) The brain activation patterns were divided into a training set and a testing set. Brain activation patterns from the training set were used to train a classifier. According to the leave-one-scan-out cross-validation procedure, one independent part of the dataset was selected to test, while the other parts constituted the training dataset. This procedure was repeated till all parts had served as the testing dataset once. In this study, there were seven independent parts for each pixelized image. (4) The trained classifier was used to predict the pixelized image from the test set. Classification accuracies were calculated for each participant and were then averaged.
Figure 3.
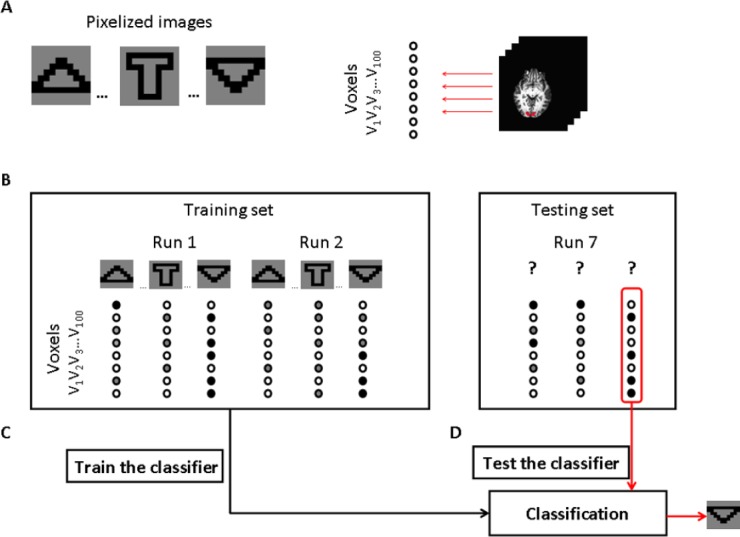
Illustration of how the functional magnetic resonance imaging (fMRI) data could be analyzed using multi-voxel pattern analysis (MVPA) in this study.
(A) Brain responses were recorded while participants viewed pixelized images. The 100 selected voxels in the region of interest were included in the classification analysis. (B) The fMRI time series were decomposed into discrete brain activation patterns that correspond to the pattern of activity across the selected voxels at a particular point in time. Each brain activation pattern was labeled according to the corresponding pixelized image. The brain activation patterns were divided into a training set and a testing set. (C) Brain activation patterns from the training set were used to train a classifier function that could map between brain activation patterns and pixelized images. (D) The trained classifier was used to predict the pixelized image from the test set.
Results
Brain responses to pixelized images
There were stronger responses to pixelized images than fixation images in the primary visual cortex, and there were no significant differences between the average brain activities to different pixelized images. Figure 4 shows the brain activation pattern to two different pixelized images from one participant. These average brain activation patterns to 18 different pixelized images across all participants will be sent to the classifier. MVPA was used to test if these brain activation patterns (100 voxels) to different pixelized images were specific.
Figure 4.
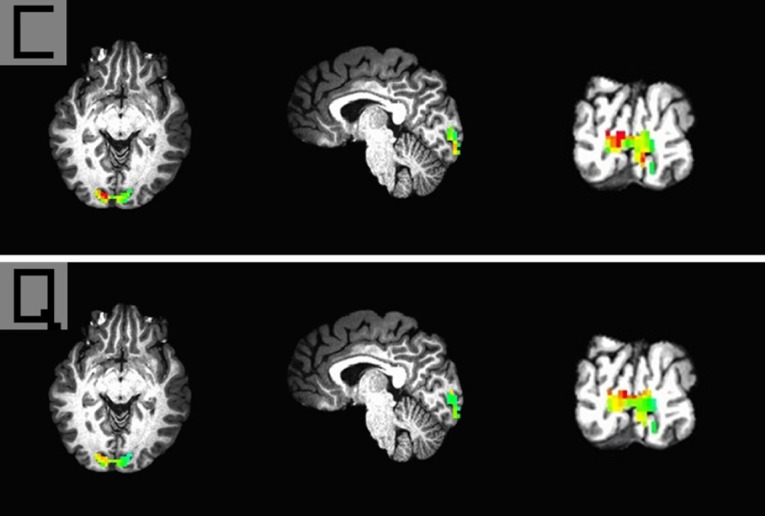
The brain activation patterns to pixelized images of “C” and “Q” from one 27-year-old male participant.
The brain activation pattern was obtained using a 4 mm × 4 mm × 4 mm voxel size and a 100-voxel pattern.
Classification accuracies to brain activation patterns
The classifier was trained and tested with 6 pixelized images (classes) in each category. We calculated the average classification accuracies for the three categories: it was 0.37 for English letter, 0.35 for visual acuity charts and 0.36 for simple shapes. To address if there were specific brain activation patterns to different pixelized images, we tested if the classification accuracy was above chance level. Chance level is what would be obtained if the classifier performed at random. In our study, we trained and tested the classifier with 6 pixelized images, so it was a 6-classes classification. The chance level for an N-classes classification is 1/N, so in our study, the chance level was 1/6, 0.167. Using a t-test analysis, we found that the classification accuracies were significantly above chance level (English letters: t(5) = 2.562, P < 0.05; visual acuity charts: t(5) = 3.527, P < 0.05; simple shapes: t(5) = 2.610, P < 0.05), which means that specific brain activation patterns to different pixelized images in each category can be obtained in the primary visual cortex.
Classification accuracies of three categories
Moreover, the classification accuracy for all the 18 pixelized images was calculated. We trained and tested the classifier with 18 pixelized images, so it was an 18-classes classification, and the chance level was 1/18, 0.05. The results from MVPA showing classification accuracy was 0.25, which was significantly above chance level (t(5) = 2.736, P < 0.05), meaning that specific brain activation patterns to different pixelized images across three categories can be obtained in the primary visual cortex (Figure 5).
Figure 5.
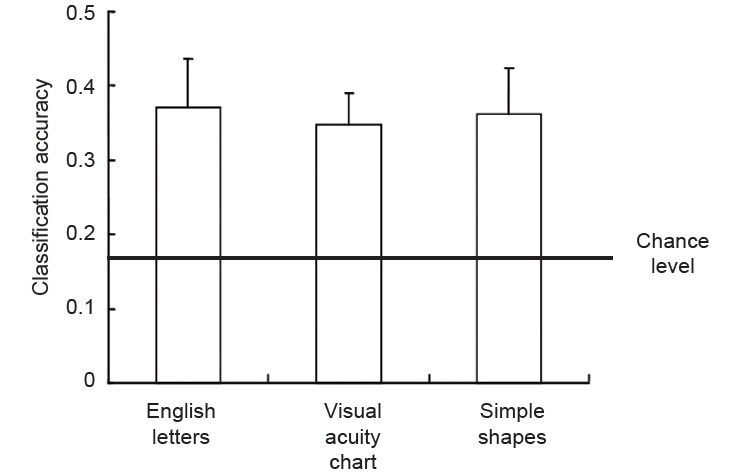
Classification accuracy for pixelized images from three categories.
The average classification accuracy was 0.37 for English letters ( ), 0.35 for visual acuity charts (
 ) and 0.36 for simple shapes (
 ). The chance level was 0.167 (black line). The classification accuracies were significantly above chance level.
Discussion
In this study, we conducted an fMRI experiment to investigate the brain activation patterns to 18 different pixelized images. There were 100 voxels in the brain activation pattern which were selected from the primary visual cortex. Using MVPA, the results suggested that the 18 brain activation patterns evoked by the 18 different pixelized images were specific. Previous studies have suggested that a similar retina encoder can improve the design of electrical stimulation patterns in retina prostheses (Zrenner, 2002; Eckmiller et al., 2005). A recent study of motor cortical prostheses has shown that it is possible to control a prosthetic device using brain activation patterns in the motor cortex (Velliste et al., 2008). It is hoped that the specific brain activation patterns evoked by the different pixelized images can improve the design of electrical stimulation for visual cortical prostheses.
First, the specific brain activation patterns can be used as the “aim” of the electrical stimulation. For visual cortical prostheses, if the brain activation pattern evoked by the electrical stimulation approaches the brain activity pattern evoked by the “specific target”, then the pixelized images elicited by the electrical stimulation may be similar to the “specific target”. By adjusting the parameters of the electrical stimulation to make the brain activation patterns evoked by the electrical stimulation more similar to the “aim”, we hope to improve the design of electrical stimulation. Moreover, combined with the correlation coefficient between the electrical stimulation and the brain responses, the specific brain activation patterns can also be used as the parameters of the electrical stimulation. Furthermore, previous studies on retinal prostheses have shown that decoding specific visual targets from local field potentials in the brain can evaluate the efficiency of electrical stimulation (Cottaris and Elfar, 2009). In such an approach, we plan to decode brain activation patterns at a later visual processing stage, such as extrastriate visual cortical area V2, to evaluate the efficiency of electrical stimulation for visual cortical prostheses.
For visual cortical prostheses, a previous study suggested a retina-like encoder to aid in electrical stimulation design (Martínez et al., 2005). This encoder takes a previous localization of every phosphene in the visual field, and then computes the list of electrodes to be activated according the “desired pixelized images” (Morillas et al., 2007). However, the relationship between visual space and cortical space is non-linear and non-conformal (Warren et al., 2001), so it is hard to accurately remap visual space onto cortical space. Even if the list of electrodes can be obtained, it is still hard to design the stimulus levels that will be delivered to each implanted cortical electrode, because there are overlapping localizations of phosphenes in the visual field (Normann et al., 2001). The relationship between “the whole and the parts” in the primary visual cortex is still unclear, so the “desired pixelized images” are not linear additives of the phosphenes. Therefore, in our study, we hope that the brain responses evoked by the “desired pixelized images” will improve the design of electrical stimulation. This method does not need to suffer the non-linear and non-conformal problem; the brain activation patterns are directly used. The brain activation patterns contain the activation value of each voxel that can be used as the parameters of stimulus levels. Furthermore, a previous fMRI study suggested that there is a common model of brain activation patterns between participants (Haxby et al., 2011), so the common brain activation patterns between normal participants are hoped to be directly used to design the electrical stimulation, which would reduce the training time of the implant wearers.
In this study, there were 100 voxels in the brain activation pattern which were selected from the primary visual cortex. The location of each voxel would be the implant area for each electrode. A previous fMRI study of the orientation and color suggested that 4 mm kernel smoothing systematically provided a significant increase in classification accuracy compared to no smoothing (3 mm), and over-fit smoothing (6 mm) (Ruiz et al., 2012). This result suggests that if we want to obtain two different brain responses in the primary visual cortex, it is better to smooth at the size of each voxel in the brain activation patterns. Thus, the size of each voxel was smoothed to 4 mm × 4 mm × 4 mm in this study. Our results showed that there were stronger responses to pixelized images than fixation images in the primary visual cortex, and that there were no significant differences between the average brain activities to different pixelized images. These results suggested that the pixelized images of different object categories might follow the same early visual processing path, which is consistent with previous studies (Guo et al., 2010, 2013). Their results showed that both pixelized images of faces and non-faces evoked similar N170 components in the early visual area, which suggests that pixelized images of different object categories might trigger the same visual cognitive processes.
A previous study suggested that the first step in developing a visual prosthetic for blind humans is to develop an animal model, and that humans should be used in entirely noninvasive procedures to test some of the basic assumptions (Schiller and Tehovnik, 2008). Since our results suggested that specific brain activation patterns to different pixelized images can be obtained in humans, we will carry out this fMRI experiment in animals in the future.
In this article, we conducted an fMRI experiment on pixelized images. MVPA was used to test if the brain activation patterns to different pixelized images were specific. The results showed that the classification accuracies of brain activation patterns to different pixelized images were significantly above chance level. Our results suggest that specific brain activation patterns to different pixelized images can be obtained in the primary visual cortex. The specific brain responses evoked by the different pixelized images are hoped to be used in the design of electrical stimulation patterns.
Footnotes
Funding: This study was supported by the National Natural Science Foundation of China, No. 31070758, 31271060 and the Natural Science Foundation of Chongqing in China, No. cstc2013jcyjA10085.
Conflicts of interest: None declared.
Copyedited by Jackson C, Robens J, Wang J, Li CH, Song LP, Zhao M
References
- 1.Brindley GS, Lewin WS. The sensations produced by electrical stimulation of the visual cortex. J Physiol. 1968;196:479–493. doi: 10.1113/jphysiol.1968.sp008519. [DOI] [PMC free article] [PubMed] [Google Scholar]
- 2.Chai X, Yu W, Wang J, Zhao Y, Cai C, Ren Q. Recognition of pixelized Chinese characters using simulated prosthetic vision. Artif Organs. 2007;31:175–182. doi: 10.1111/j.1525-1594.2007.00362.x. [DOI] [PubMed] [Google Scholar]
- 3.Chang MH, Kim HS, Shin JH, Park KS. Facial identification in very low-resolution images simulating prosthetic vision. J Neural Eng. 2012;9:046012. doi: 10.1088/1741-2560/9/4/046012. [DOI] [PubMed] [Google Scholar]
- 4.Chen LF, Hu N, Liu N, Guo B, Yao J, Xia L, Zheng X, Hou W, Yin ZQ. The design and preparation of a flexible bio-chip for use as a visual prosthesis and evaluation of its biological features. Cell Tissue Res. 2010;340:421–426. doi: 10.1007/s00441-010-0973-9. [DOI] [PubMed] [Google Scholar]
- 5.Chen SC, Hallum LE, Lovell NH, Suaning GJ. Visual acuity measurement of prosthetic vision: a virtual-reality simulation study. J Neural Eng. 2005;2:S135–145. doi: 10.1088/1741-2560/2/1/015. [DOI] [PubMed] [Google Scholar]
- 6.Cottaris NP, Elfar SD. Assessing the efficacy of visual prostheses by decoding ms-LFPs: application to retinal implants. J Neural Eng. 2009;6:026007. doi: 10.1088/1741-2560/6/2/026007. [DOI] [PubMed] [Google Scholar]
- 7.Dobelle WH. Artificial vision for the blind by connecting a television camera to the visual cortex. ASAIO J. 2000;46:3–9. doi: 10.1097/00002480-200001000-00002. [DOI] [PubMed] [Google Scholar]
- 8.Dobelle WH, Mladejovsky MG, Girvin JP. Artifical vision for the blind: electrical stimulation of visual cortex offers hope for a functional prosthesis. Science. 1974;183:440–444. doi: 10.1126/science.183.4123.440. [DOI] [PubMed] [Google Scholar]
- 9.Dobelle WH, Mladejovsky MG, Evans JR, Roberts TS, Girvin JP. “Braille” reading by a blind volunteer by visual cortex stimulation. Nature. 1976;259:111–112. doi: 10.1038/259111a0. [DOI] [PubMed] [Google Scholar]
- 10.Eckmiller R, Neumann D, Baruth O. Tunable retina encoders for retina implants: why and how. J Neural Eng. 2005;2:S91–104. doi: 10.1088/1741-2560/2/1/011. [DOI] [PubMed] [Google Scholar]
- 11.Fernandez E, Pelayo F, Romero S, Bongard M, Marin C, Alfaro A, Merabet L. Development of a cortical visual neuroprosthesis for the blind: the relevance of neuroplasticity. J Neural Eng. 2005;2:r1–12. doi: 10.1088/1741-2560/2/4/R01. [DOI] [PubMed] [Google Scholar]
- 12.Guo H, Qin R, Qiu Y, Zhu Y, Tong S. Configuration-based processing of phosphene pattern recognition for simulated prosthetic vision. Artif Organs. 2010;34:324–330. doi: 10.1111/j.1525-1594.2009.00863.x. [DOI] [PubMed] [Google Scholar]
- 13.Guo H, Yang Y, Gu G, Zhu Y, Qiu Y. Phosphene object perception employs holistic processing during early visual processing stage. Artif Organs. 2013;37:401–408. doi: 10.1111/aor.12005. [DOI] [PubMed] [Google Scholar]
- 14.Haxby JV, Guntupalli JS, Connolly AC, Halchenko YO, Conroy BR, Gobbini MI, Hanke M, Ramadge PJ. A common, high-dimensional model of the representational space in human ventral temporal cortex. Neuron. 2011;72:404–416. doi: 10.1016/j.neuron.2011.08.026. [DOI] [PMC free article] [PubMed] [Google Scholar]
- 15.Haynes JD, Rees G. Decoding mental states from brain activity in humans. Nat Rev Neurosci. 2006;7:523–534. doi: 10.1038/nrn1931. [DOI] [PubMed] [Google Scholar]
- 16.Kay KN, Gallant JL. I can see what you see. Nat Neurosci. 2009;12:245. doi: 10.1038/nn0309-245. [DOI] [PubMed] [Google Scholar]
- 17.Li S, Hu J, Chai X, Peng Y. Image recognition with a limited number of pixels for visual prostheses design. Artif Organs. 2012;36:266–274. doi: 10.1111/j.1525-1594.2011.01347.x. [DOI] [PubMed] [Google Scholar]
- 18.Martínez A, Reyneri LM, Pelayo FJ, Romero SF, Morillas CA, Pino B. In computational intelligence and bioinspired systems. Springer: Berlin Heidelberg, Germany; 2005. Automatic generation of bio-inspired retina-like processing hardware. [Google Scholar]
- 19.Morillas C, Romero S, Martínez A, Pelayo F, Reyneri L, Bongard M, Fernández E. A neuroengineering suite of computational tools for visual prostheses. Neurocomputing. 2007;70:2817–2827. [Google Scholar]
- 20.Norman KA, Polyn SM, Detre GJ, Haxby JV. Beyond mind-reading: multi-voxel pattern analysis of fMRI data. Trends Cogn Sci. 2006;10:424–430. doi: 10.1016/j.tics.2006.07.005. [DOI] [PubMed] [Google Scholar]
- 21.Normann RA, Maynard EM, Rousche PJ, Warren DJ. A neural interface for a cortical vision prosthesis. Vision Res. 1999;39:2577–2587. doi: 10.1016/s0042-6989(99)00040-1. [DOI] [PubMed] [Google Scholar]
- 22.Normann RA, Warren DJ, Ammermuller J, Fernandez E, Guillory S. High-resolution spatio-temporal mapping of visual pathways using multi-electrode arrays. Vision Res. 2001;41:1261–1275. doi: 10.1016/s0042-6989(00)00273-x. [DOI] [PubMed] [Google Scholar]
- 23.Normann RA, Greger B, House P, Romero SF, Pelayo F, Fernandez E. Toward the development of a cortically based visual neuroprosthesis. J Neural Eng. 2009;6:035001. doi: 10.1088/1741-2560/6/3/035001. [DOI] [PMC free article] [PubMed] [Google Scholar]
- 24.Ruiz MJ, Hupé JM, Dojat M. In machine learning in medical imaging. Springer: Berlin Heidelberg, Germany; 2012. Use of pattern-information analysis in vision science: a pragmatic examination. [Google Scholar]
- 25.Schiller PH, Tehovnik EJ. Visual prosthesis. Perception. 2008;37:1529–1559. doi: 10.1068/p6100. [DOI] [PMC free article] [PubMed] [Google Scholar]
- 26.Schmidt EM, Bak MJ, Hambrecht FT, Kufta CV, O’Rourke DK, Vallabhanath P. Feasibility of a visual prosthesis for the blind based on intracortical microstimulation of the visual cortex. Brain. 1996;119(Pt 2):507–522. doi: 10.1093/brain/119.2.507. [DOI] [PubMed] [Google Scholar]
- 27.Smith E, Kellis S, House P, Greger B. Decoding stimulus identity from multi-unit activity and local field potentials along the ventral auditory stream in the awake primate: implications for cortical neural prostheses. J Neural Eng. 2013;10:016010. doi: 10.1088/1741-2560/10/1/016010. [DOI] [PMC free article] [PubMed] [Google Scholar]
- 28.Thompson RW, Jr, Barnett GD, Humayun MS, Dagnelie G. Facial recognition using simulated prosthetic pixelized vision. Invest Ophthalmol Vis Sci. 2003;44:5035–5042. doi: 10.1167/iovs.03-0341. [DOI] [PubMed] [Google Scholar]
- 29.Velliste M, Perel S, Spalding MC, Whitford AS, Schwartz AB. Cortical control of a prosthetic arm for self-feeding. Nature. 2008;453:1098–1101. doi: 10.1038/nature06996. [DOI] [PubMed] [Google Scholar]
- 30.Wang J, Wu X, Lu Y, Wu H, Kan H, Chai X. Face recognition in simulated prosthetic vision: face detection-based image processing strategies. J Neural Eng. 2014;11:046009. doi: 10.1088/1741-2560/11/4/046009. [DOI] [PubMed] [Google Scholar]
- 31.Warren DJ, Fernandez E, Normann RA. High-resolution two-dimensional spatial mapping of cat striate cortex using a 100-microelectrode array. Neuroscience. 2001;105:19–31. doi: 10.1016/s0306-4522(01)00174-9. [DOI] [PubMed] [Google Scholar]
- 32.Zhao Y, Lu Y, Zhou C, Chen Y, Ren Q, Chai X. Chinese character recognition using simulated phosphene maps. Invest Ophthalmol Vis Sci. 2011;52:3404–3412. doi: 10.1167/iovs.09-4234. [DOI] [PubMed] [Google Scholar]
- 33.Zrenner E. Will retinal implants restore vision? Science. 2002;295:1022–1025. doi: 10.1126/science.1067996. [DOI] [PubMed] [Google Scholar]


