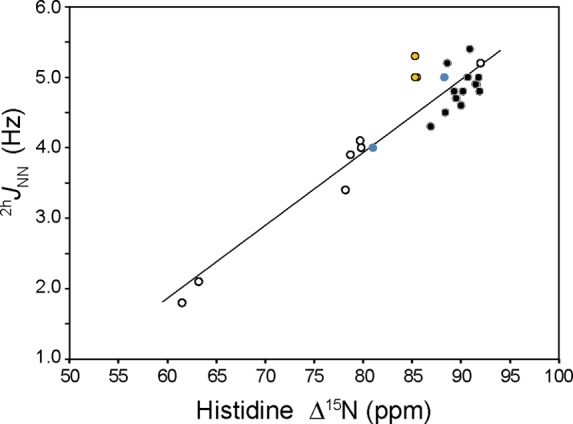
Figure 8.

Plot of 2hJNN vs histidine Δ15N for globins (black fill), cytochrome b5 (orange fill), and AR proteins (○). Data for WT CtrHb-CN (for the major isomer, 2hJNN = 5.0 Hz and Δ15N = 88.3 ppm) and L75H CtrHb-B-CN (2hJNN = 4.0 Hz, and Δ15N = 81 ppm) are colored blue. Linear regression of the full data set returns a slope of 0.10 Hz/ppm and an x-intercept (Δ15N for 2hJNN = 0 Hz) of 43.3 ppm (r2 = 0.88). Linear regression of the AR protein data alone yields a slope of 0.11 Hz/ppm and an x-intercept of 45.4 ppm (r2 = 0.98), whereas the heme protein data alone (omitting apo cytochrome b5) return a slope of 0.06 Hz/ppm and an x-intercept of 10.5 ppm (r2 = 0.29).
