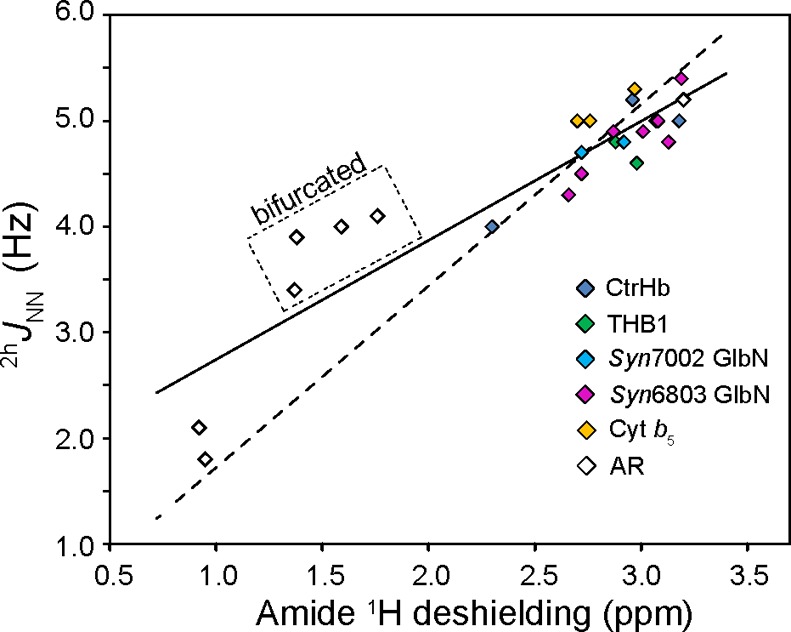
Figure 9.

Plot of 2hJNN vs the amide 1H-corrected chemical shift in heme proteins (fill colors correspond to Figure S5) and AR proteins (◇).18 Linear regression of the entire data set gives a slope of 1.13 Hz/ppm and a y-intercept of 1.62 Hz [r2 = 0.84 (—)]. The non-zero y-intercept is attributed to the lack of data at low J values. Fixing the y-intercept to zero yields a best fit slope of 1.72 Hz/ppm [r2 = 0.59 (−–−)]. Linear regression of the heme protein data alone returns a slope of 1.13 Hz/ppm and a y-intercept of 1.56 Hz [r2 = 0.55 (not shown)].
