Abstract
Introduction
Reports of muscle testing are frequently limited to maximal force alone. The experiments reported here show that the force generation and relaxation rates can be obtained from the same experiments and provide a more complete functional characterization.
Methods
Partial in situ testing was performed on the tibialis anterior of young wild type (WT) mice, young mdx mice, and old mdx mice. Force, force generation rate, and relaxation rates were measured during a fatigue test, 2 frequency-force tests, and a passive tension test.
Results
We measured increased force but decreased force generation rate in WT compared to mdx muscles and increased force but decreased relaxation rate of old compared to young mdx muscles. Young mdx muscles were the most sensitive to increases in passive tension.
Conclusions
These measurements offer an improved understanding of muscle capability and are readily acquired by further analysis of the same tests used to obtain force measurements.
Keywords: Muscle testing, muscular dystrophy, fatigue, frequency-force, passive tension tolerance
INTRODUCTION
Disease progression and the effect of different therapeutic interventions are often examined by evaluating the mechanical function of skeletal muscle in animal models of muscular dystrophy1. A prevalent animal model is the mdx mouse, which has many of the characteristics of patients with Duchenne muscular dystrophy (DMD). DMD is the most common form of dystrophy and arises from a mutation in the dystrophin gene2. Although the absence of dystrophin is functionally compensated to a certain extent by overexpression of utrophin3, 4, 5, the ultimate effect of the lack of dystrophin is necrosis, loss of skeletal muscle, and decreased force production. Reports from in vivo or in situ skeletal muscle tests are limited to maximal force generation elicited by a single contraction (twitch), an ongoing series of mini-tetani (fatigue), or well-spaced tetani at increasing stimulation frequencies (frequency-force). Interestingly, treatment may not result in an increase of muscle contractile force, but it may modify the kinetics of the mechanical activity. Rates of contraction and relaxation are altered even when the muscle exerts the same maximal force, and they may be altered by aging, disease progression, or treatment6. These measurements offer an improved understanding of the capability of the muscle, and they are readily acquired by further analysis of results from the same test used to obtain force measurements. Analysis of these parameters will provide a better understanding of the effects of preclinical treatments and the progression of disease in more mechanistic terms.
Several tests have been developed, and each has advantages and disadvantages. For example, non-invasive in vivo tests such as rotator rod, running wheel, and treadmill running tests provide valuable information about the overall performance of the animal, but they do not account for central fatigue or learning6. While ex vivo tests examine muscle contraction, they do not investigate the muscle capability under neural control7. Here, we provide a detailed experimental protocol for an in situ muscle test that challenges many aspects of muscle function. We elicited contraction by stimulating the nerve in its entirety, allowing us to bypass central fatigue and gradation of motor pool recruitment. We tested the tibialis anterior (TA) of young wild type (WT) and mdx mice (6–8 week old), and compared them with older mdx mice (43 weeks). We measured contractile force, force generation rate, and relaxation rate throughout a series of challenges in a 90-minute protocol. The protocol included classic fatigue, repeated twitch, 2 frequency-force sequences, and a novel test that challenges the ability of the muscle to tolerate increasing amounts of passive tension. The young WT and the older mdx (43 weeks) groups were compared to the 6–8 week old mdx mice since most of the studies with mdx mice are performed at 6–8 weeks of age.
METHODS
Experimental Animals
mdx (C57BL/10ScSn-Dmdmdx/J) and WT (C57BL/10J) mice were obtained from the Jackson laboratory. The experiments were approved by the Animal Care and Use Committee of the University of Illinois at Chicago and followed the principles set forth in the “Guide for the Care and Use of Laboratory Animals” (NIH). Mice were maintained in a 14/10 light-dark cycle and allowed to feed and drink ad libitum. WT mice were age- and sex-matched to the 6–8 week old mdx mice. The 43 week-old mice were from the same colony as the 6–8 week old mdx mice and are representative of the aging process of mdx mice. Mice were anesthetized with intraperitoneal ketamine (100 mg/Kg) and xylazine (5 mg/Kg) and were re-dosed as needed throughout the procedure. Appropriate anesthetic plane was determined by toe pinch.
Muscle Preparation
The TA tendon was severed distal to the ankle as it passes medial to the inferior surfaces of the cuneiform and metatarsal bones. Great care was taken not to include the tendon of the extensor digitorum longus muscle in the surgical isolation of the TA. The TA tendon was tied with silk suture, wrapped back over the knot, and tied again to prevent slipping. The leg was immobilized at the knee to the testing stage by needles, with the length of the limb parallel to the direction of force but without impeding contraction. A heating pad and heat lamp were adjusted to keep the temperature at the level of the animal at 37°C. The TA muscle was stimulated via the deep fibular nerve, as it arises from the sciatic nerve. The sciatic nerve was freed from fascia, tied with silk suture just distal to the spine and severed between the suture and spine. The nerve was stimulated with a bipolar wire electrode.
During the procedure, the muscle was kept moist by continuous drip of Kreb Henseleit solution (in mM: 130 NaCl, 5 KCl, 1 CaCl2, 1.1 KH2PO4, 0.85 MgSO4, 0.6 MgCl2, 25 HEPES, 25 NaCO3, 11 glucose bubbled with 95%O2 and 5%CO2). The impact of the drip did not introduce mechanical artifacts. A peristaltic pump was used to drip the solution over the muscle at a flow rate of 2.0–2.5 mL per minute.
Optimization of passive tension and voltage
Optimal passive tension was determined by stimulating the sciatic nerve for 100 ms at 50 Hz every 6 seconds. The passive tension was increased every 3 twitches until the maximum force was recorded. Optimal voltage was re-determined after each test. When the optimal voltage changed, the data from the previous test were discarded, and the test was repeated. To ensure proper voltage, a set of twitches was elicited beginning at 1.0 volt with a 1 ms pulse every 3 seconds with gradual increases in voltage until maximum force was obtained. The voltage used for the experiments was 1.2 times the optimal voltage determined and was usually 2.0 volts.
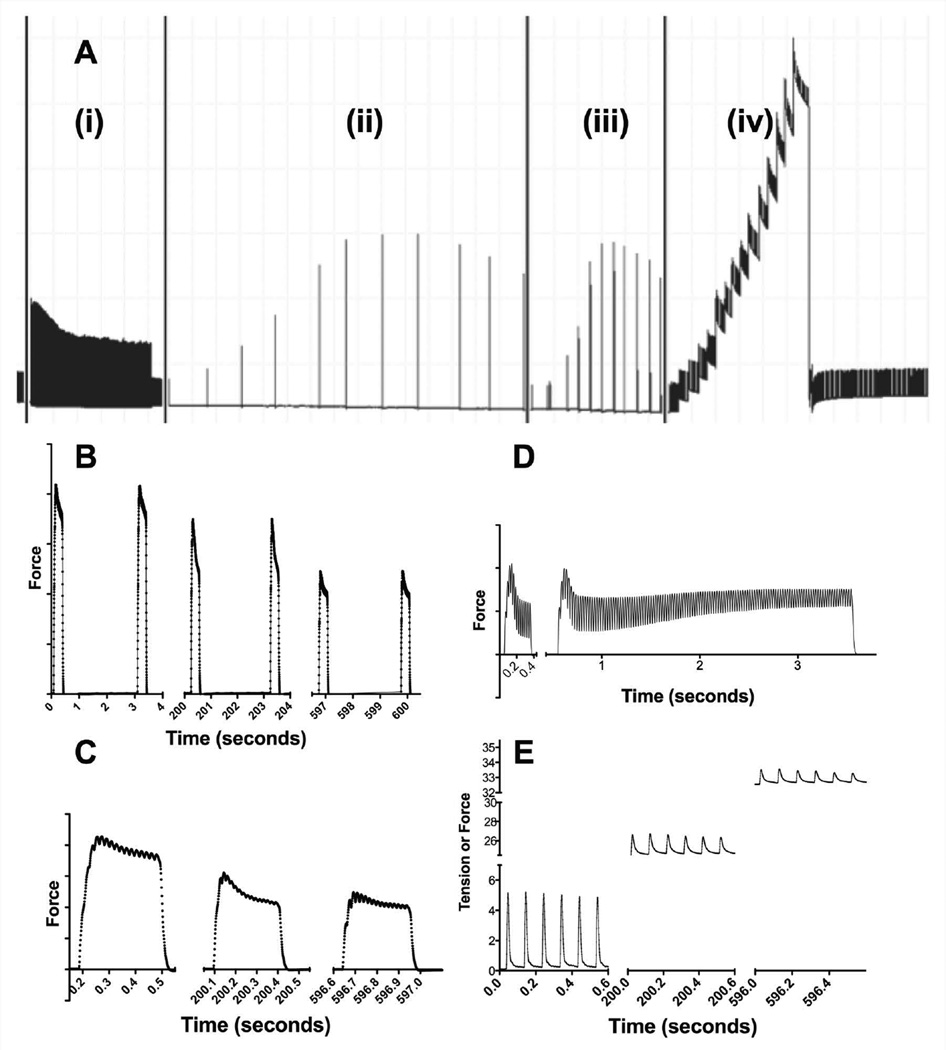
The order of the stimulation tests remained consistent for every muscle tested and is shown in Figure 1A. These were arranged from least to most energetically demanding to minimize the long-term effects of intense muscle activity.
Figure 1. Myomechanical testing protocol.
This figure shows all 5 tests performed. The first test (Ai) is a 10-minute fatigue test in which a 300 ms sub-maximal tetanus is evoked at a stimulation rate of 50 Hz. Fatigue is followed by a second bout of twitches. FF1 (Aii) shows 11 300ms contractions elicited by 10, 30, 40, 50, 80, 100, 120, 150, 180, 200, and 250 Hz, with 3 minutes of rest time between each contraction. FF2 (Aiii) challenges the muscle further with 3-second stimulations at the same frequencies as FF1 separated by only 1 minute. Passive tension tolerance and recovery (Aiv), tests the ability of the muscle to maintain contraction despite increased length and the ability of the muscle to recover from any stretch-induced decrement. Panels B and C show close ups of the individual sub-maximal tetanic contractions elicited during the fatigue test. Summation and the unfused peaks of contraction are observable in C. Panel D compares contractions elicited at 40 Hz during FF1 and FF2. The individual bouts of contractions from the passive tension tolerance test are shown in panel E.
Twitch
After optimal voltage and length were determined, the nerve was stimulated every 3 seconds with 1 ms pulses for 10 repetitions. The amplitude of the twitches and the rates of force generation and relaxation were measured. Twitches were repeated throughout the test to verify that the optimal voltage and passive tension were maintained.
Fatigue
A 300 ms, 50 Hz burst of stimulation was applied to the nerve every 3 seconds for 10 minutes (Fig 1Ai). Fatigue is reported as the minimum force, usually at 10 minutes, as a fraction of the reference force. The reference force was recorded from the second contraction. In these measurements, a smaller number means greater fatigue. Potentiation was reported as the maximal force, usually within the first 40 seconds of the test, as a percent of reference force. Figures 1B and 1C show progressive individual contractions of the fatigue test in an expanded time scale. Summation and the individual peaks of the unfused tetanus are observed in Figure 1C.
Frequency-force
Two frequency-force tests (Figure 1Aii and 1Aiii) were used to examine muscle function. In the first frequency-force test (FF1), bursts of 300 ms stimuli were delivered at increasing frequencies every 3 minutes. The testing frequencies ranged from 10 to 250 Hz. A second frequency-force (FF2) test was performed with 3-second bursts every minute at the same frequencies. As the stimulations were 10 times longer and the resting time in between was shorter, the FF2 test was more demanding. Figure 1D shows a 40 Hz contraction from the same muscle during FF1 and FF2.
Passive Tension Tolerance
The ability of the muscle to maintain constant active contractile force with increasing passive tension was measured by eliciting 0.5 second bouts of twitches every 5.7 seconds for 100 seconds, as shown in Figure 1Aiv. Under constant passive tension at this rate of stimulation, no fatigue was observed in any of the muscles. The passive tension was increased, and more bouts of twitches were provoked for another 100 seconds. At this time, the passive tension was increased again for another increment. This continued until a passive tension of 50 g was reached. After the last set of active twitches was stimulated at the greatest passive tension, the passive tension was set to the original optimal passive tension. Stimulation of twitches continued while the muscle recovered for at least 8 minutes.
Statistics
Data are expressed as means ± SEM. To determine statistical significance, we used 1-way ANOVA followed by a Tukey multiple comparison test or 2-way ANOVA followed by a Dunn multiple comparison test where appropriate.
RESULTS
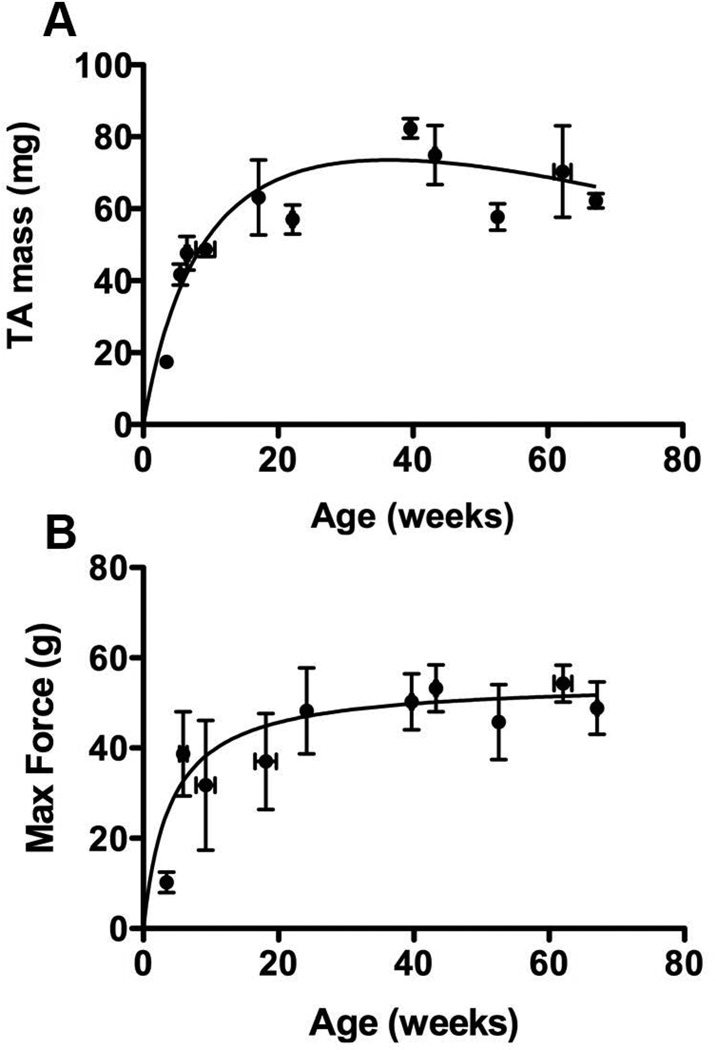
Data from the mdx colony are shown in figure 2. The mass of the tibialis anterior (TA) increased with age to a mean of 77.70 ± 7.55 mg at 40 weeks and declined thereafter (figure 2A). The mean TA mass of the oldest mice tested, 67 weeks, was 62.23 ± 2.00 mg. The isometric force of the TA also reached a maximum at 40 weeks, but declined only slightly after that (figure 2B). The mean force reached a maximum of 53.25 ± 5.20 g at 43 weeks. At 67 weeks, the mean force declined to 48.81 ± 5.80 g.
Figure 2. TA wet mass and maximal force by age.
(A) The wet mass of tibialis anterior by age from mdx mice from 4 to 67 weeks. (B) Maximum force of TA by age. Isometric force of mdx untreated mice aged from 4 to 67 weeks. This maximum represents the point at which regeneration cannot keep up with necrosis in the colony of mdx being studied presently.
Fatigue
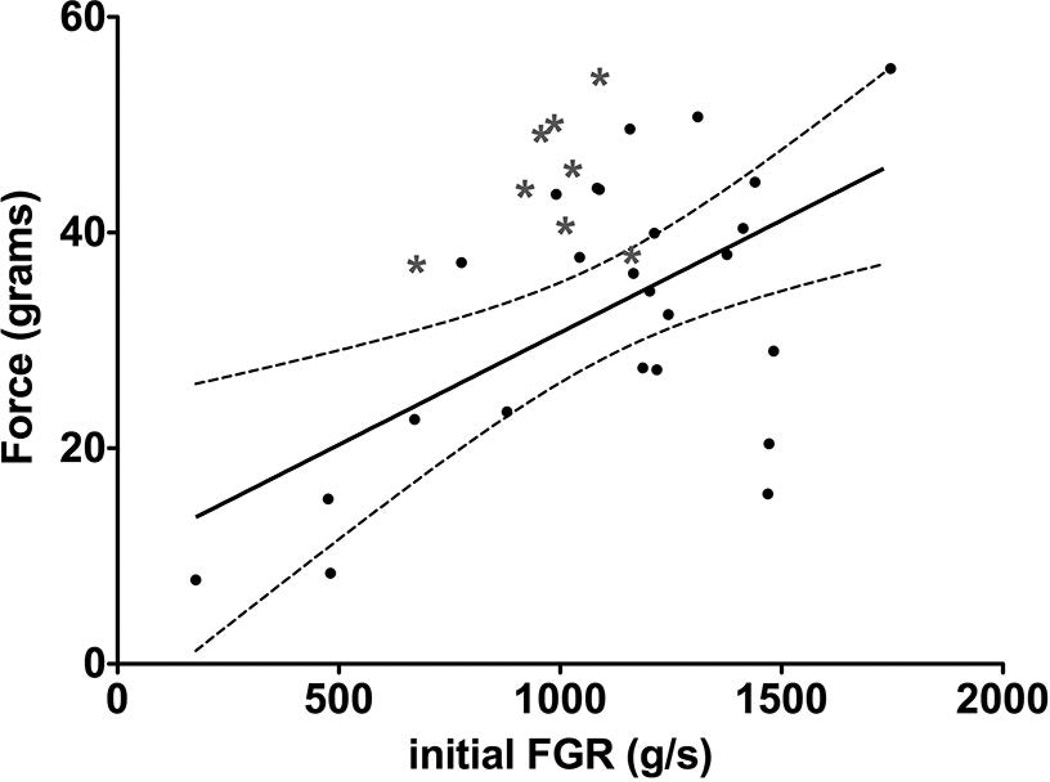
Data in figures 3–6 were obtained from the fatigue test. Figure 3 shows the initial force plotted against the initial force generation rate for each muscle used in this study, ages 6–67 weeks. Among age groups, there was no correlation in the relationship between force generation rate and force. We found that, while there was an overall positive correlation with force generation rate, this parameter is not predictive of force, as 14 of the 25 data points were outside of the 95% confidence interval with an R2 value of only 0.3451. Furthermore, we found that data from WT muscles were clustered outside the 95% confidence interval representative of mdx muscles. The WT muscles had lower force generation rate but greater force. The values of the slopes of the best fit linear regression were 0.04408 ± 0.007491 and 0.02081 ± 0.005979 for WT and mdx mice, respectively.
Figure 3. Force generation rate is not predictive of force.
The initial force is plotted over force generation rate for each muscle tested. The trend shows that the force increases with increasing force generation rate. Data from WT muscles are grouped outside of the 95% area and have a higher force and lower force generation rate than the data from mdx muscles. The solid black line is the best linear fit. The 95% confidence interval is shown by the dotted lines above and below the solid line. The black dots represent data from dystrophic muscles.
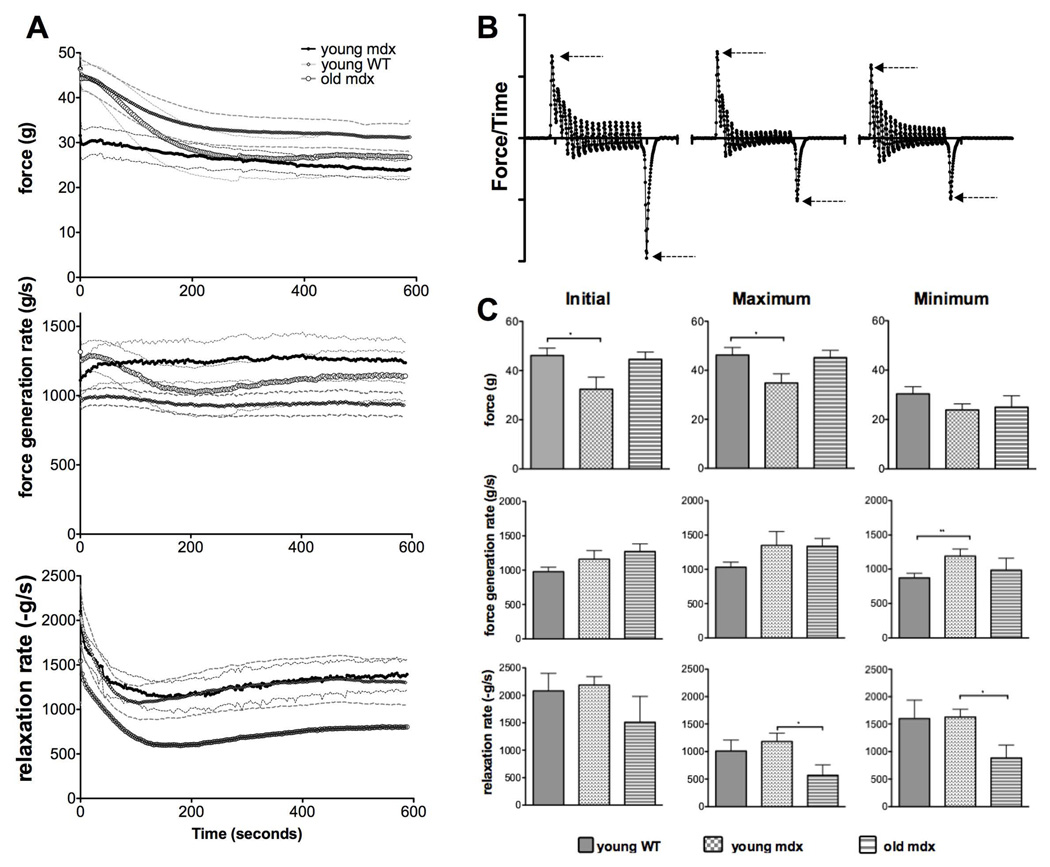
Figure 6. Initial, maximal and minimal values of force, force generation rate, and relaxation rate during fatigue.
(A) The time course of force (top) force generation rate (middle) and relaxation rate (lowest) of TA muscles from young WT (n=5), young mdx (n=5) and old mdx (n=6) mice during a fatigue test. (B) The derivative of force from the contractions shown in Figure 1C. Arrows indicate where the reported values were obtained. (C) The initial, maximum, and minimum values of force, force generation rate, and relaxation rate.
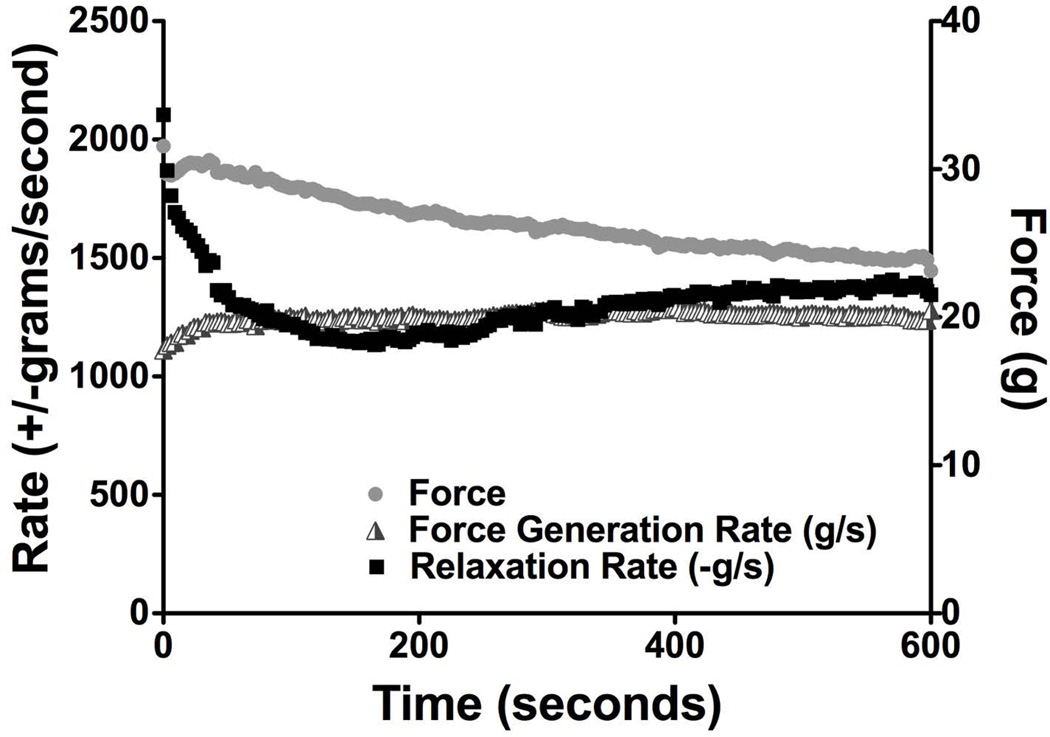
The time course of force, force generation rate, and relaxation rate, of 6–8 week old mdx muscles are displayed together in Figure 4 to emphasize the divergent patterns of fatigue and potentiation, indicating distinct mechanisms of adaptation. This pattern was consistent in muscles of all 3 groups of mice tested. Measurement of force showed potentiation in the first few seconds of the test, reaching a maximum at 26 seconds and a minimum at the completion of the test. The total decrease of force was 24% of the initial value. The force generation rate quickly increased to 11% over its initial value by 36 seconds and maintained the same magnitude until the end of the test. Initially, the magnitude of the relaxation rate was 90% larger than the magnitude of the force generation rate. The relaxation rate was more dynamic than either force or force generate rate, as it declined to 54% of its initial value by 168 seconds and then steadily increased for the remainder of the test to end at 65% lower than the initial level. The difference in the timing of potentiation and fatigue of these measurements suggests that these properties are regulated by different mechanisms.
Figure 4. The mean force, force generation rate, and relaxation rate of 6–8 week old mdx muscles.
Force, force generation rate, and fatigue during 10 minutes of fatigue show distinct patterns, as described in the text.
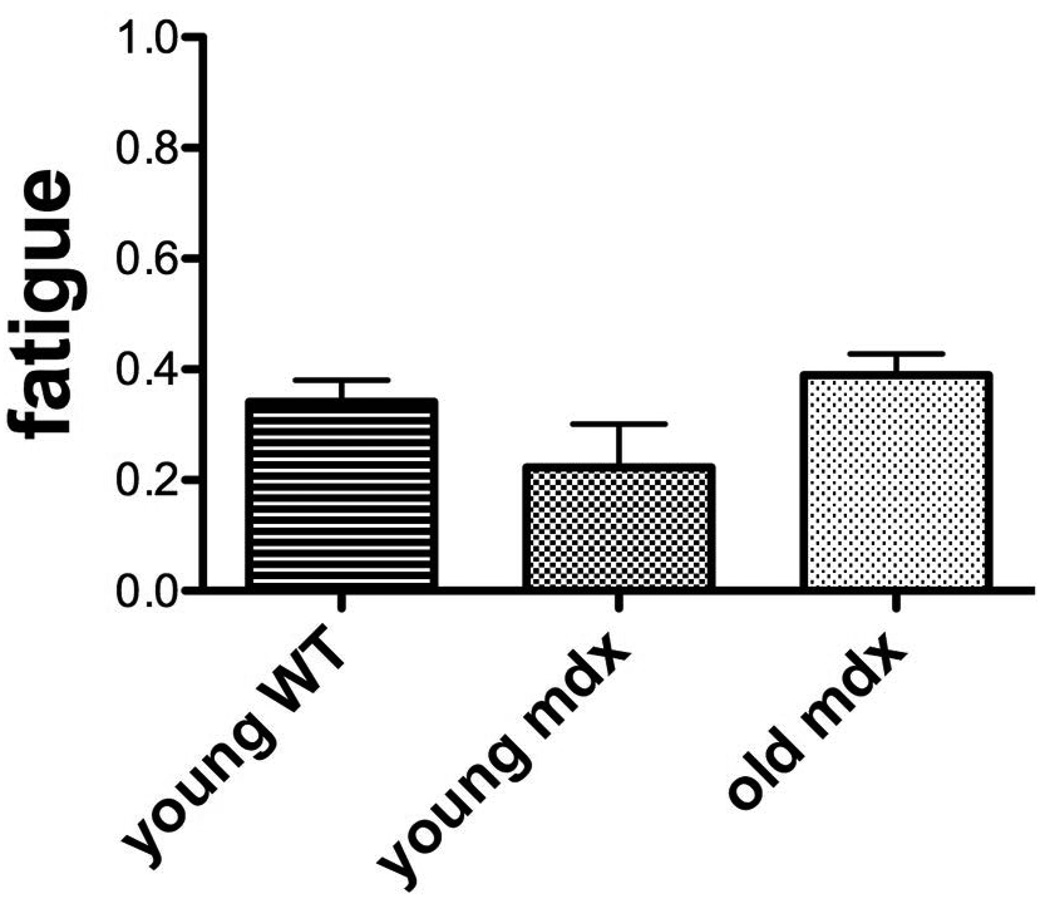
Measurements of force, force generation rate, and relaxation rate obtained from fatigue tests on TA muscles from young WT, young mdx, and old mdx mice revealed additional information about the relationships of these measurements and comparisons among the 3 groups of muscles. First, we calculated fatigue in the traditional way as the ratio of minimal force, usually observed at 10 minutes, to the maximal force, usually in the first few seconds of the test. As shown in Figure 5, although there was a tendency of the young mdx group to experience more fatigue than the WT group, the difference in this measurement was not significant among the 3 groups. However, there were significant differences in other measurements of fatigue. The initial, maximal, and minimal values of force, force generation rate, and relaxation rates were recorded. Figure 6A shows the time course of pattern of force, force generation rate, and relaxation rate. During this fatigue test, mean force changed a total of 33% for WT, 21% for young mdx, and 40% for old mdx muscles. Of the 3 groups, only the young mdx showed potentiation, which was an increase of 3% in the first 39 seconds of the test. There was a change in mean force generation rate of 5% for young WT, 13% for young mdx, and 20% for old mdx muscles. The relaxation rate declined initially in all groups, reaching 52% of initial value at 108 seconds for young WT muscles, 55% of initial value at 140 seconds for young mdx muscles, and 39% of initial value for old mdx muscle at 165 seconds. At the conclusion of the test, the mean relaxation rate of these groups increased from the minimum by 21%, 20%, and 34% respectively.
Figure 5. Fatigue of force among groups.
Fatigue is measured as the force at the end of the 10 minute fatigue test. It represents a fraction of the maximal force early in the test and as such, a smaller number represents greater fatigue. There was no significant difference in the fatigue in any of the groups.
Figure 6C shows significant differences in the initial force during fatigue between young WT and mdx mice. Force was also greater in old mdx mice than in young mice, although not statistically different.
Figure 6B shows the force derivative of the contractions shown in figure 1C during the fatigue test. The derivative traces correspond to the progressions of fatigue in the sample measurement shown in Figure 1C. The arrows show the maximal force generation rate and relaxation rates, where the values for these measurements were obtained. Surprisingly, the initial and the maximum force generation rates were 15%-25% smaller in the WT mice when compared to mdx mice of the same age. This was observed throughout the test, but only the minimum force generation rate was statistically significant. There was no significant difference in force generation rates between old mdx mice and young mdx mice (Figure 6C, middle row).
Measurement of relaxation rates showed that the young WT and mdx mice are not different, while the relaxation rate of old mdx mice was over 50% reduced (Figure 6C, lower row) compared to their younger counterparts.
Frequency-force
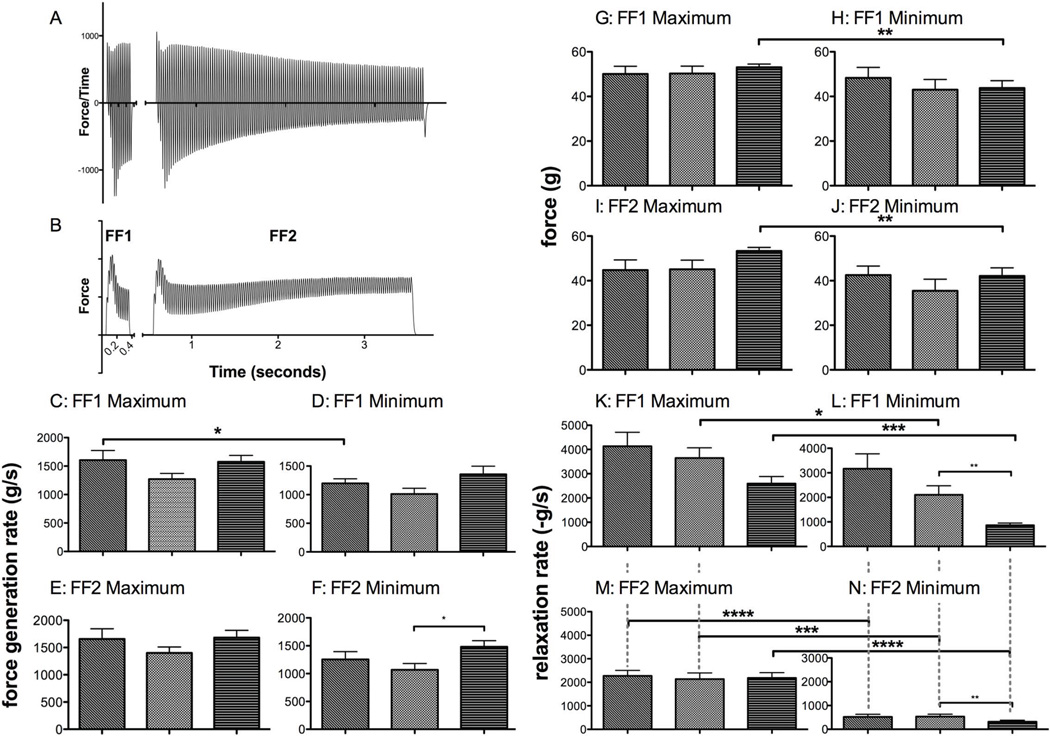
Figure 7 represents the force generation rate and relaxation rate during the frequency-force tests, FF1 and FF2. Upon increasing stimulation frequency, force, relaxation rate, and force generation rate increased, reaching a maximum at a frequency of 120–180 Hz and then a decline. Here, we report maximal and minimal values for each force generation rate and relaxation rate at the less demanding (FF1) and the more demanding (FF2) tests. The minimal value reported here was provoked by a frequency of 250 Hz, the highest frequency of the test, and is a measurement of the decline after a peak.
Figure 7. Maximal and minimal force generation rate and relaxation rate in frequency-force tests.
(A) Force measurement during FF1 and FF2, and the derivative (B). The maximal (C and E) and minimal (D and F) force generation rates obtained from FF1 (C and D) and FF2 (E and F) tests. (G–J) Measurements of force at maximum values (G and I) and minimal values (H and J) for FF1 (G and H) and FF2 (I and J). Maximum (K and M) and minimum (L and N) relaxation rates for FF1 (K and L) and FF2 (M and N). The force generation rate does not change with an increase in the energetic demands of the muscle, but the relaxation rate decreases significantly. The increased demand also elicits a greater decrease in relaxation rate (N).
Several comparisons were made from the data in figure 7. First, comparisons of the subgroups in figure 7 show that the relaxation rate was lower and the force generation rate was higher in old mdx versus young mdx. Next we compared the extent of the change of force generation rate and relaxation rate in each group, and the difference between minimum and maximum for each test. The force generation rates for young WT, young mdx and old mdx decreased only 25%, 20%, and 7%, respectively, for FF1, and 24%, 23%, and 12% respectively for FF2. The relaxation rate was far more dynamic, with an increase from initial value of 23%, 42%, and 66% for young WT, young mdx, and old mdx, respectively, for FF1, and 77%, 75%, and 85% for FF2.
Comparison of the muscle performance provoked from the less demanding test (FF1) and the more demanding test (FF2) revealed another distinct difference between measurements of force generation rate and relaxation rate. Force generation rates were slightly higher for the more demanding test. For young WT, young mdx and old mdx, the maximum force generation rate increased by 3%, 9%, and 6% respectively, for the maximum values, and the minimum values were 4%, 5%, and 9% higher than the minimum values elicited by the less demanding test, FF1. The relaxation rate of muscles of young WT, young mdx, and old mdx was decreased by 45%, 41%, and 16% in the more demanding tests, and the minimum was decreased by 83%, 75%, and 63% when compared to the minimum values elicited by the less demanding test.
Passive Tension Tolerance
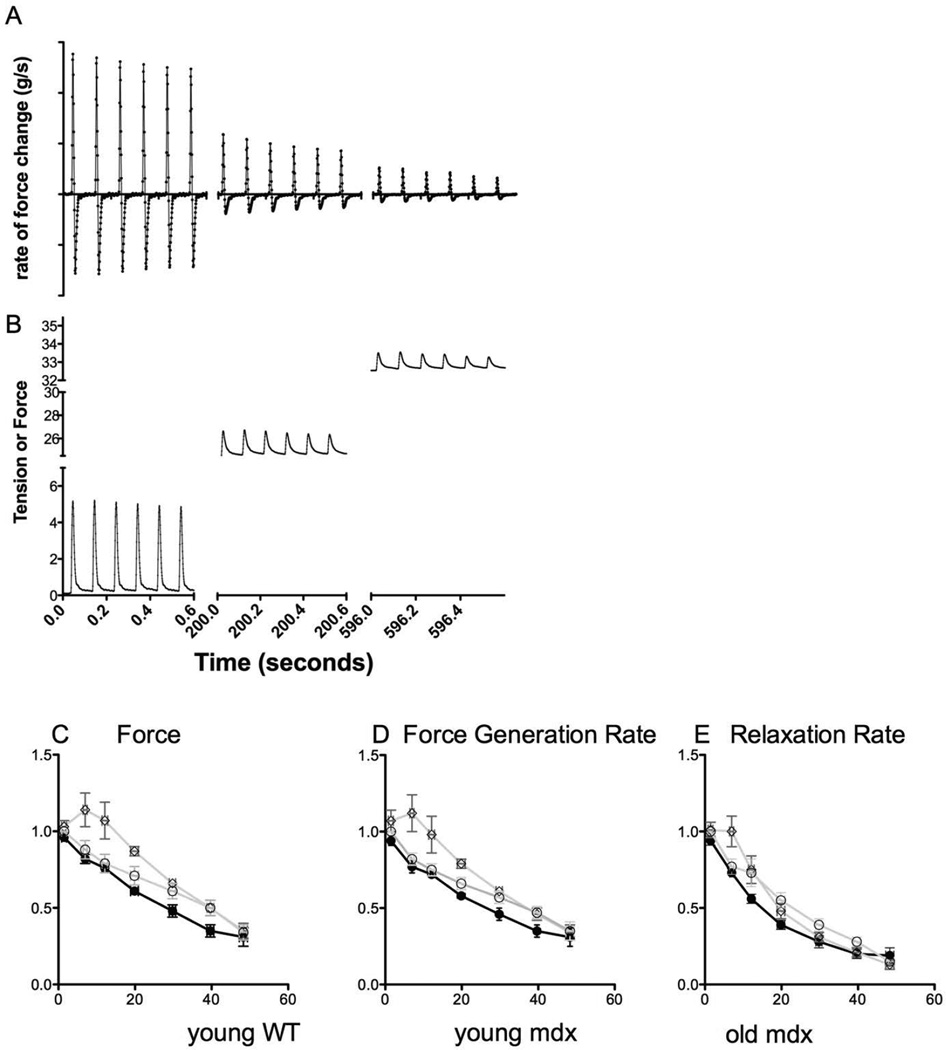
Figure 8A shows the rate of force change from the contractions shown in 8B. Figures 8C, D, and E show the force, force generation rate, and relaxation rate, respectively, as passive tension was incrementally increased. The force and force generation rates of young mdx muscles were reduced to 50% of the initial value at 28 g and 26 g of passive tension, respectively, while the old mdx muscles were less sensitive and required 39 and 36 grams of passive tension before reaching 50% of the initial value. Muscles from young WT mice tolerated small increases in passive tension, as both force and force generation rate remained constant for passive tensions up to 10 g before steeply declining and becoming statistically the same as muscles from both young and old mdx mice.
Figure 8. Passive Tension Tolerance of Force, Force Generation Rate, and Relaxation Rate.
(A) The rate of force generation from the contractions shown in (B) for the same muscle. (C, D, E) muscles from young WT (WT) mice (n=5), young mdx mice (n=5), and old mdx mice, respectively. Muscles from young mdx mice tolerate less passive tension before the force and force generation rate reach 50% of initial values (C and D).
DISCUSSION
To fully understand the functional properties of skeletal muscle, it is necessary to determine the kinetics of whole muscle contraction in addition to force capability. For example, the force generation rate declines with age9, and a reduced force generation rate correlates with lateral stability10, a risk factor for falls in the elderly11. In these individuals, the rate of force is critical, since movements during gait take place in less time than the maximal force can be generated. The relaxation rate is important for efficiency of energy usage. The ability of muscle force to sum (and produce more force) depends on the fine-tuning of the rates of contraction and relaxation. Finally, the measurements of force generation rate and relaxation rate provide additional methods of monitoring disease progression or effectiveness of treatment in the muscular dystrophies.
We set out to study the biophysical properties of skeletal muscle with a protocol that measures multiple features of muscle, with 2 objectives. First, the protocol should challenge the muscle in ways that are clinically relevant. Second, the protocol should offer more strategies for researchers to link muscle function to biochemical and histological measurements. This protocol allowed us to measure the sensitivity of muscle performance to repeated stimulation, the sensitivity to increased stimulation frequency, and to increased passive tension. We observed differences in the sensitivity of relaxation rate, force generation rate, and force to these challenges of muscle function. By challenging the muscles in multiple ways and recording several measurements instead of just one, we believe that the protocol made significant advancements toward these objectives.
Throughout the myomechanical test, the relaxation rate was the most sensitive to activity-induced changes. While in most tests, there was a tendency for relaxation rate to decline, the fatigue test showed that the relaxation rate was also subject to increase. In the fatigue test, the magnitude of the force generation rate and relaxation rate were similar (within 30%). In the FF1 and FF2 the max relaxation rate was larger than the force generation rate and fell to only a fifth of the magnitude of the force generation rate. This reinforced the idea that relaxation rate was more dynamic than either force or force generation rate.
The force generation rate in WT mice is slower than age-matched mdx muscles in the fatigue test but is faster in the frequency-force tests. The fatigue test examines the ability of the muscle to adapt to persistent submaximal stimulation. The force, force generation rate, and relaxation rate provoked by the frequency-force tests were representative of the maximum capability of that nerve/muscle at a specific stimulation. Since the relaxation rate of the muscles in frequency-force tests changes significantly for the same muscle, it can be said that the relaxation rate is a measurement of the status of the muscle, which may be related to intracellular calcium depletion, modification of calcium sensitivity of sarcomeric proteins, or both. Timing of the return to full capacity may be indicative of recovery of intracellular calcium stores or restoration of native calcium sensitivity. This can be clarified by performing similar experiments on muscles with genetically altered contractile proteins or calcium handling proteins. Alteration of contractile proteins would change the sensitivity to calcium.
The increase in force generation rate in young mdx muscles has been attributed to an increase in myosin light chain kinase phosphorylation due to an increase in intracellular calcium12, a common defect in mdx muscle13, 14, 15. In addition, persistent rounds of regeneration in mdx muscle favor emergence of slow-twitch fiber type, which has low myosin light chain kinase activity. This would explain why the force generation rate decreases with age.
Levels of ATP change very little during a fatigue test, leading some to believe that ATP depletion is not the major cause of fatigue16. However, a small reduction in ATP will trigger a stress mechanism, activating chloride and ATP-sensitive potassium channels that reduce the amplitude of action potentials and calcium influx17, 16. In our fatigue protocol, we found that the force generation rate increased and stayed elevated (Figure 6), suggesting that these mechanisms do not seem to prevail in setting this rate. In contrast, they may be more important for the relaxation rate, especially at the beginning of the test when the relaxation rate initially decreased.
In these results, mechanisms of fatigue and potentiation are likely simultaneous. Since potentiation is elicited at low frequencies while fatigue is elicited at high frequencies, it would be possible to design a test that preferentially provoked 1 or the other. This would aid the interpretation of the cellular events that contribute to functional properties of the muscles18.
The dystrophin-glycoprotein complex is believed to be important in synaptic development and maintenance as well as myofiber stability19–21. The decline of force with increased stimulation frequency observed in old mdx (figure 7G–J) muscle is consistent with failure at the neuromuscular junction22. The neuromuscular junction in mdx muscles is known to be altered, particularly after degeneration and regeneration23, which is supported clearly by our results showing significant decline in old, but not young, dystrophic muscles. While the force generated by young mdx muscle tended to decrease with increased stimulation frequency, it was not significant (P=0.07). There was clearly no diminished force with increasing frequency observed for the muscles of the young WT mice.
These data not only quantify the pathology of mdx mice at 2 ages, but also identify novel, much required muscle pathology assessment techniques. We have demonstrated that force and the rates of relaxation and force generation are distinct properties of skeletal muscle. We have introduced a protocol that uses accessible equipment but that tests the effect of repeated stimulation (fatigue), the intensity of stimulation (FF1 and FF2), and the effect of passive stretch on 3 measurements of muscle contraction. Additional advantages of our protocol are that the muscle is intact, with intact vasculature and innervation that make it possible to test larger muscles. We believe that our results validate this protocol as an invaluable tool for demonstrating the capabilities of muscle and its interaction with the motor neuron, and it maximizes the potential to support histological and biochemical findings. The new methods illuminate the different, parallel pathologies that are occurring in mdx mice. In the future this will significantly aid preclinical trials in mouse models of muscular dystrophy in which some pathologic mechanisms are reduced and others are not. For example, reduction in fibrosis would elicit a distinct response in the new assessment techniques, while rescuing the calcium handling would elicit an alternative response. Importantly, the techniques are performed in conjunction with common muscle assessment methods, therefore only requiring a small amount of additional time and no additional equipment.
Acknowledgments
This work was supported by the Muscular Dystrophy Association, USA (JG) and NIH HL102322 (AH).
ABBREVIATIONS
- DMD
Duchenne muscular dystrophy
- FF1
Frequency-force 1 test
- FF2
Frequency-force 2 test
- TA
Tibialis anterior
- WT
Wild type
Footnotes
There are no financial interests or conflict of interest to disclose by any of the authors
REFERENCES
- 1.Allamand V, Campbell KP. Animal models for muscular dystrophy: valuable tools for the development of therapies. Hum Mol Genet. 2000;9(16):2459–2467. doi: 10.1093/hmg/9.16.2459. [DOI] [PubMed] [Google Scholar]
- 2.Manzur AY, Muntoni F. Diagnosis and new treatments in muscular dystrophies. Postgrad Med J. 2009;85(1009):622–630. doi: 10.1136/jnnp.2008.158329. [DOI] [PubMed] [Google Scholar]
- 3.Banks GB, Chamberlain JS. The value of mammalian models for duchenne muscular dystrophy in developing therapeutic strategies. Curr Top Dev Biol. 2008;84:431–453. doi: 10.1016/S0070-2153(08)00609-1. [DOI] [PubMed] [Google Scholar]
- 4.Karpati G, Carpenter S, Morris GE, Davies KE, Guerin C, Holland P. Localization and quantitation of the chromosome 6-encoded dystrophin-related protein in normal and pathological human muscle. J Neuropathol Exp Neurol. 1993;52(2):119–128. doi: 10.1097/00005072-199303000-00004. [DOI] [PubMed] [Google Scholar]
- 5.Kleopa KA, Drousiotou A, Mavrikiou E, Ormiston A, Kyriakides T. Naturally occurring utrophin correlates with disease severity in Duchenne muscular dystrophy. Hum Mol Genet. 2006;15(10):1623–1628. doi: 10.1093/hmg/ddl083. [DOI] [PubMed] [Google Scholar]
- 6.Westerblad H, Allen DG. Recent advances in the understanding of skeletal muscle fatigue. Curr Opin Rheumatol. 2002;14(6):648–652. doi: 10.1097/00002281-200211000-00003. [DOI] [PubMed] [Google Scholar]
- 7.Park KH, Brotto L, Lehoang O, Brotto M, Ma J, Zhao X. Ex vivo assessment of contractility, fatigability and alternans in isolated skeletal muscles. J Vis Exp. (69):e4198. doi: 10.3791/4198. [DOI] [PMC free article] [PubMed] [Google Scholar]
- 8.MacIntosh BR, Gardiner PF, McComas AJ. viii. Champaign, IL: Human Kinetics; 2006. Skeletal muscle : form and function; p. 423. [Google Scholar]
- 9.Izquierdo M, Aguado X, Gonzalez R, Lopez JL, Hakkinen K. Maximal and explosive force production capacity and balance performance in men of different ages. Eur J Appl Physiol Occup Physiol. 1999;79(3):260–267. doi: 10.1007/s004210050504. [DOI] [PubMed] [Google Scholar]
- 10.Chang SH, Mercer VS, Giuliani CA, Sloane PD. Relationship between hip abductor rate of force development and mediolateral stability in older adults. Arch Phys Med Rehabil. 2005;86(9):1843–1850. doi: 10.1016/j.apmr.2005.03.006. [DOI] [PubMed] [Google Scholar]
- 11.Rogers MW, Mille ML. Lateral stability and falls in older people. Exerc Sport Sci Rev. 2003;31(4):182–187. doi: 10.1097/00003677-200310000-00005. [DOI] [PubMed] [Google Scholar]
- 12.Smith IC, Huang J, Quadrilatero J, Tupling AR, Vandenboom R. Posttetanic potentiation in mdx muscle. J Muscle Res Cell Motil. 2010;31(4):267–277. doi: 10.1007/s10974-010-9229-2. [DOI] [PubMed] [Google Scholar]
- 13.McCarter GC, Steinhardt RA. Increased activity of calcium leak channels caused by proteolysis near sarcolemmal ruptures. J Membr Biol. 2000;176(2):169–174. doi: 10.1007/s00232001086. [DOI] [PubMed] [Google Scholar]
- 14.Yeung EW, Whitehead NP, Suchyna TM, Gottlieb PA, Sachs F, Allen DG. Effects of stretch-activated channel blockers on [Ca2+]i and muscle damage in the mdx mouse. J Physiol. 2005;562(Pt 2):367–380. doi: 10.1113/jphysiol.2004.075275. [DOI] [PMC free article] [PubMed] [Google Scholar]
- 15.Burr AR, Millay DP, Goonasekera SA, Park KH, Sargent MA, Collins J, Altamirano F, Philipson KD, Allen PD, Ma J, Lopez JR, Molkentin JD. Na+ dysregulation coupled with Ca2+ entry through NCX1 promotes muscular dystrophy in mice. Mol Cell Biol. 2014;34(11):1991–2002. doi: 10.1128/MCB.00339-14. [DOI] [PMC free article] [PubMed] [Google Scholar]
- 16.Allen DG, Lamb GD, Westerblad H. Skeletal muscle fatigue: cellular mechanisms. Physiol Rev. 2008;88(1):287–332. doi: 10.1152/physrev.00015.2007. [DOI] [PubMed] [Google Scholar]
- 17.MacIntosh BR, Holash RJ, Renaud JM. Skeletal muscle fatigue--regulation of excitation-contraction coupling to avoid metabolic catastrophe. J Cell Sci. 2012;125(Pt 9):2105–2114. doi: 10.1242/jcs.093674. [DOI] [PubMed] [Google Scholar]
- 18.Rassier DE, Macintosh BR. Coexistence of potentiation and fatigue in skeletal muscle. Braz J Med Biol Res. 2000;33(5):499–508. doi: 10.1590/s0100-879x2000000500003. [DOI] [PubMed] [Google Scholar]
- 19.Grady RM, Zhou H, Cunningham JM, Henry MD, Campbell KP, Sanes JR. Maturation and maintenance of the neuromuscular synapse: genetic evidence for roles of the dystrophin--glycoprotein complex. Neuron. 2000;25(2):279–293. doi: 10.1016/s0896-6273(00)80894-6. [DOI] [PubMed] [Google Scholar]
- 20.Ohlendieck K, Ervasti JM, Matsumura K, Kahl SD, Leveille CJ, Campbell KP. Dystrophin-related protein is localized to neuromuscular junctions of adult skeletal muscle. Neuron. 1991;7(3):499–508. doi: 10.1016/0896-6273(91)90301-f. [DOI] [PubMed] [Google Scholar]
- 21.Patton BL, Miner JH, Chiu AY, Sanes JR. Distribution and function of laminins in the neuromuscular system of developing, adult, and mutant mice. J Cell Biol. 1997;139(6):1507–1521. doi: 10.1083/jcb.139.6.1507. [DOI] [PMC free article] [PubMed] [Google Scholar]
- 22.Bigland-Ritchie B, Jones DA, Woods JJ. Excitation frequency and muscle fatigue: electrical responses during human voluntary and stimulated contractions. Exp Neurol. 1979;64(2):414–427. doi: 10.1016/0014-4886(79)90280-2. [DOI] [PubMed] [Google Scholar]
- 23.Lyons PR, Slater CR. Structure and function of the neuromuscular junction in young adult mdx mice. J Neurocytol. 1991;20(12):969–981. doi: 10.1007/BF01187915. [DOI] [PubMed] [Google Scholar]


