

Background: Mitochondria can sequester calcium and regulate signaling processes in epithelia.
Results: Intracellular calcium regulates the renal epithelial sodium channel in a polarized fashion, and this polarity is dependent on mitochondrial calcium uptake.
Conclusion: Mitochondria maintain calcium polarity in renal epithelia.
Significance: Identifying subcellular calcium signaling domains in renal epithelia is essential to understanding ion channel regulation.
Keywords: calcium intracellular release, calcium transport, cell polarity, epithelial sodium channel (ENaC), kidney, cortical collecting duct, mitochondrial barrier, polarization
Abstract
The renal epithelial sodium channel (ENaC) provides regulated sodium transport in the distal nephron. The effects of intracellular calcium ([Ca2+]i) on this channel are only beginning to be elucidated. It appears from previous studies that the [Ca2+]i increases downstream of ATP administration may have a polarized effect on ENaC, where apical application of ATP and the subsequent [Ca2+]i increase have an inhibitory effect on the channel, whereas basolateral ATP and [Ca2+]i have a stimulatory effect. We asked whether this polarized effect of ATP is, in fact, reflective of a polarized effect of increased [Ca2+]i on ENaC and what underlying mechanism is responsible. We began by performing patch clamp experiments in which ENaC activity was measured during apical or basolateral application of ionomycin to increase [Ca2+]i near the apical or basolateral membrane, respectively. We found that ENaC does indeed respond to increased [Ca2+]i in a polarized fashion, with apical increases being inhibitory and basolateral increases stimulating channel activity. In other epithelial cell types, mitochondria sequester [Ca2+]i, creating [Ca2+]i signaling microdomains within the cell that are dependent on mitochondrial localization. We found that mitochondria localize in bands just beneath the apical and basolateral membranes in two different cortical collecting duct principal cell lines and in cortical collecting duct principal cells in mouse kidney tissue. We found that inhibiting mitochondrial [Ca2+]i uptake destroyed the polarized response of ENaC to [Ca2+]i. Overall, our data suggest that ENaC is regulated by [Ca2+]i in a polarized fashion and that this polarization is maintained by mitochondrial [Ca2+]i sequestration.
Introduction
The renal epithelial sodium channel (ENaC)2 is a known contributor to the development of salt-sensitive hypertension, particularly in African Americans (1–3). Its regulation, therefore, has been the subject of much research over recent years. The distal portion of the renal tubule functions to fine-tune sodium reabsorption to regulate plasma sodium concentration. This is done transcellularly by movement of sodium through ENaC channels on the apical surface of the cell, followed by basolateral movement through the Na+/K+-ATPase. The epithelial cells in this segment must express different proteins on the apical versus basolateral surface of the cell to allow for regulated transcellular ion movement. Polarization of the single layer of epithelial cells lining the tubule is essential for the nephron to sense changes in plasma and tubular fluid composition and regulate ENaC and other membrane proteins appropriately (4–6). ENaC must, therefore, be regulated differently by hormones present in the blood versus the tubular fluid.
The role of intracellular calcium ([Ca2+]i) in ENaC regulation is beginning to emerge. P2Y2 receptors are G protein-coupled receptors located on the apical membrane in principal cells, where they function to inhibit ENaC by a Ca2+-dependent mechanism (7, 8). [Ca2+]i inhibition of ENaC is, in fact, a well known phenomenon, and several publications by different investigators have proposed the following model. Gq-coupled receptors activate phospholipase C, which causes release of Ca2+ through IP3 receptors on the endoplasmic reticulum near the apical plasma membrane, where ENaC is expressed (7). Following an increase in [Ca2+]i, PKC is activated (9), and, via a separate pathway, Ca2+ binds to calmodulin. ENaC is usually held in the membrane by phosphatidylinositol phosphates, particularly PIP2 and phosphatidylinositol 1,4,5-trisphosphate (10, 11). A protein, myristoylated alanine-rich C kinase substrate (MARCKS), normally stabilizes PIP2 to create an anchoring domain for ENaC (12). When MARCKS is bound by calmodulin or phosphorylated by PKC, this causes loss of MARCKS from the membrane, destabilization of PIP2, and endocytosis of ENaC. [Ca2+]i can also activate the ubiquitin ligase Nedd4-2, causing ubiquitination and proteasomal degradation of ENaC (13).
Although increases in [Ca2+]i in the cytosol just beneath the apical plasma membrane most likely inhibit ENaC, research from our group and others suggests that increasing [Ca2+]i in the cytosol very near the basolateral membrane of the cell may stimulate ENaC (14, 15). Basal P2X4 receptors stimulate ENaC in a Xenopus distal tubule cell line (14). P2X4 channels are known Ca2+ channels, and chelating [Ca2+]i with BAPTA (1,2 bis(o-aminophenoxy)ethane,N,N,N′,N′-tetraacetic acid) decreased P2X4-induced ENaC stimulation, suggesting that increases in [Ca2+]i are stimulating ENaC when they originate from the basal pole.
[Ca2+]i spreading must somehow be prevented in epithelia of the distal nephron to observe a polarized effect of [Ca2+]i on ENaC. In pancreatic acinar and airway epithelia, mitochondria can restrict [Ca2+]i diffusion by sequestering [Ca2+]i (16, 17). We tested the hypothesis that mitochondria in cortical collecting duct (CCD) function in a similar manner to create regions of high and low [Ca2+]i within the cell (Ca2+ pools) and that these pools allow the same second messenger to affect the same protein (i.e. ENaC) in opposing ways, depending on the origin (apical versus basal) of the signal. This allows the cell to respond differently to hormone signals that signal via [Ca2+]i, depending on whether the hormone is sensed in the serosal or luminal compartment.
Materials and Methods
Cells
Experiments used either the 2F3 clone of A6 Xenopus distal tubule cells or mouse mpkCCD cells from the cortical collecting duct. The type of cell used in each experiment was decided by ease of use. 2F3 cells are suited for electrophysiology because of their ability to remain at room temperature for extended periods of time, high expression of ENaC, and low expression of other channels. mpkCCD cells were used for microscopy experiments because they are easy to transfect and easily take up mitochondrial dyes. Cells were grown on permeable supports to confluency, and then cells were polarized, and tight junctions were fully developed. For 2F3 cells, medium was supplemented with aldosterone (1.5 μm) to increase ENaC activity. Ionomycin, when used, was dissolved in <0.05% ethanol. Although ethanol can stimulate ENaC, it has no effect at this concentration (18).
Imaging
To visualize mitochondria, cells were loaded with MitoTracker Red (Life Technologies) for 30 min before visualization. To visualize the ER, cells were loaded with ERTracker Blue (Life Technologies) for 10 min prior to imaging. To label the membrane, cells were transfected with PLCδ-1 PH-GFP (1.5 μg/well, Addgene) using the Xfect system (Clontech). pN1-Lck-GCaMP tagged with enhanced GFP was used to visualize changes in [Ca2+]i near the plasma membrane of the cell (19). To detect changes in mitochondrial Ca2+, cells were cold-loaded with Rhodamine-2/AM (Life Technologies) because cold loading has been shown previously to increase the specificity of the dye for mitochondrial versus cytosolic Ca2+ (20). MpkCCD cells were incubated with Rhod2/AM for 1.5 h at 4 °C, followed by incubation in media without serum for 4 h at 37 °C. Cells were rinsed briefly prior to use. Cells were imaged using an Olympus FV-1000 confocal microscope. To resolve subcellular distribution of fluorescent markers, z-stacks were obtained using sequential optical slices starting at the basal membrane. All images were taken using the same parameter settings.
Single-channel Patch Clamp
Single-channel patch clamping was performed as described previously (14). Briefly, a microelectrode was filled with physiological buffer (96 mm NaCl, 0.8 mm CaCl, 0.8 mm MgCl, and 20 mm HEPES (pH 7.4)) and lowered to touch the apical or basolateral membrane of a single cell. Suction was applied gently so that the membrane remained intact and a >1 GΩ seal was formed. All current was recorded at a holding potential of 0 mV. ENaC was identified by its characteristic channel kinetics and current-voltage relationship. ENaC probability of opening was analyzed using ClampFit software. Empty patches (those with no apparent activity) comprised 30–50% of all patches and were excluded from the study.
Data Analysis and Statistics
To quantify the confocal microscopy experiments, ImageJ was used. The number of pixels in a given area was calculated before and after drug addition. Averages were compared using Student's t test with p < 0.05 considered significant.
Results
[Ca2+]i Influences Renal ENaC in a Polarized Fashion
We sought to test the hypothesis that ENaC is affected differently by changes in [Ca2+]i depending from which pole of the cell the signal originates. To do this, we performed single-channel patch-clamping as described previously (15), and cells were treated with either 5 μm apical ionomycin (Fig. 1A) or 15 μm basolateral ionomycin (Fig. 1B) to increase [Ca2+]i. After 1–3 min of apical application of ionomycin, we observed a significant decrease in channel activity measured as probability of opening. We saw that the decrease in ENaC activity was maintained through 4–6 min of ionomycin addition. In contrast, basolateral application of ionomycin increased ENaC activity, but only after 13–15 min. In other words, the effect of [Ca2+]i on ENaC is dependent on the side of the cell in which the increase in [Ca2+]i occurs. Note that the difference in time course and concentration here is likely due to limited diffusion of agents administered from the basal side of the cell (see “Discussion”). We hypothesize that this polarized effect is the result of two different Ca2+-mediated signaling pathways present in the same cell type. Beneath the apical surface of the cell, Ca2+ activates pathways that inhibit ENaC, but, beneath the basal surface, Ca2+ activates pathways that stimulate ENaC. Despite the relatively diffusibility of Ca2+, these two pools of Ca2+ must not interact for polarization to occur. We hypothesize that mitochondrial Ca2+ uptake prevents diffusion of [Ca2+]i within principal cells to allow for these two pathways to remain separated.
FIGURE 1.
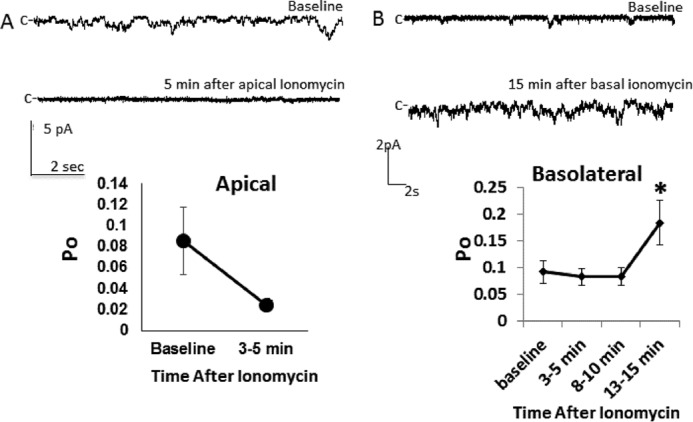
Polarized effects of ionomycin on ENaC activity. A and B, Xenopus cortical collecting duct (A6) cells were subjected to single-channel patch clamping and treated with apical (A) or basolateral (B) ionomycin (5 or 15 μm, respectively). Po, open probability. n > 5/group; *, p < 0.05.
Preventing Mitochondrial Ca2+ Transport Destroys the Polarized Effect of [Ca2+]i on ENaC
We next tested whether the polarized effects of [Ca2+]i on ENaC function were dependent on mitochondrial Ca2+ uptake. Mitochondrial Ca2+ uptake is dependent on movement through the inner mitochondrial membrane, a process facilitated by the mitochondrial calcium uniporter (MCU) (21) Ru360 is a drug that inhibits the MCU and the voltage-dependent anion channel, a channel that may facilitate movement across the outer membrane (22, 23). We first tested the effect of apical application of Ru360 alone on ENaC function and found it to have an inhibitory effect that persisted over time (Fig. 2A). This is not surprising because inhibiting Ca2+ uptake by the mitochondria that lie just beneath the apical plasma membrane likely increases apical [Ca2+]i slightly, inhibiting the channel. We then performed experiments in which Ru360 was first added to the apical surface of the cell to inhibit mitochondrial Ca2+ uptake, followed by apical (Fig. 2B) or basolateral (Fig. 2C) addition of ionomycin, while ENaC activity was monitored by patch clamp. Although Fig. 1 shows that apical and basolateral ionomycin normally have very different effects on the ENaC probability of opening, the shape of the graphs in Fig. 2, B and C (the same experiment repeated in the absence of mitochondrial calcium uptake) are the same, suggesting that the polarized effect of [Ca2+]i on ENaC is dependent on mitochondrial calcium uptake. ATP has been shown repeatedly to inhibit ENaC when applied apically (a process that is dependent on an increase in [Ca2+]i (24)). Fig. 2D shows that, in the absence of mitochondrial calcium uptake, apical ATP has a stimulatory effect on ENaC. Notice that, in each of the panels of Fig. 2, B–D, the shape of the response is the same. Although Ru360 alone has an inhibitory effect on ENaC that persists over time, adding any agent that increases [Ca2+]i on the apical or basolateral side of the cell has a stimulatory (or null effect that is likely Ru360 inhibition opposed by stimulation) effect on ENaC in the presence of Ru360. In these experiments, we apply Ru360 to the apical surface of the cell. The inability of mitochondria to take up Ca2+ would lead to an increase in regional [Ca2+]i. We know from the data in Fig. 1 that this would inhibit ENaC.
FIGURE 2.

Effect of inhibiting mitochondrial Ca2+ uptake on ENaC activity. A6 cells were subjected to single-channel patch-clamping and then treated apically with 1 μm of the MCU inhibitor Ru360. A, the effect of Ru360 alone. In subsequent experiments, a second agent was added 5–7 min following apical Ru360. B, ionomycin was added apically. C, ionomycin was added basolaterally. D, ATP was added apically. n ≥ 6 recordings/group; *, p < 0.05 versus baseline or versus Ru360 (when shown as a bar). Po, open probability.
Mitochondria Form Bands in the Distal Nephron
Mitochondrial bands in pancreatic acinar and airway epithelia have been observed by other groups to form barriers to prevent [Ca2+]i diffusion by sequestering [Ca2+]i and slowly releasing it (17, 18). We hypothesized that mitochondria may be localized in bands in the cortical collecting duct to allow for [Ca2+]i polarization and opposing effects on ENaC. We began testing this hypothesis by using MitoTracker Red to observe mitochondrial localization in cortical collecting duct cells. We used two live cortical collecting duct cell lines: A6 cells from Xenopus CCD and mpkCCD cells from mice. The z axis view of both mpkCCD cells (Fig. 3A) and A6 cells (Fig. 3B) demonstrates that, in fact, mitochondria localize in the cytosol very close to each membrane in the cortical collecting duct. To pinpoint the location of mitochondrial bands with respect to the plasma membrane (Fig. 3C), we used the fluorescent PIP2 indicator PLCδ-1 PH-GFP to label the apical and lateral membranes. We found that the apical mitochondrial bands are located just beneath the plasma membrane. Release of ER Ca2+ through IP3 receptor channels is known to inhibit ENaC. We hypothesized that, for the Ca2+ exiting the ER through the IP3 receptors to access ENaC and not be taken up by the mitochondria, sections of the ER would have to lie between the apical mitochondrial barrier and the apical plasma membrane. To observe ER localization in relation to mitochondria, we loaded mpkCCD cells with MitoTracker Red and ERTracker Blue to label the mitochondria and ER, respectively (Fig. 3D). We found that the ER does pass the mitochondrial barrier in spots in live cells. It is possible that this localization is necessary for Gq receptor inhibition of ENaC because IP3 receptor-mediated Ca2+ release would have to occur in the cytosol between the apical membrane, where ENaC is localized, and the mitochondrial band, where Ca2+ would be sequestered for the majority of the Ca2+ to access the channel. Fig. 3E shows transmission electron microscopy of a mouse cortical collecting duct principal cell. Note the localization of mitochondria, as indicated by black lines highlighting the bands. Location of ∼900 mitochondria in more than 10 different cells is quantified in Fig. 3F.
FIGURE 3.
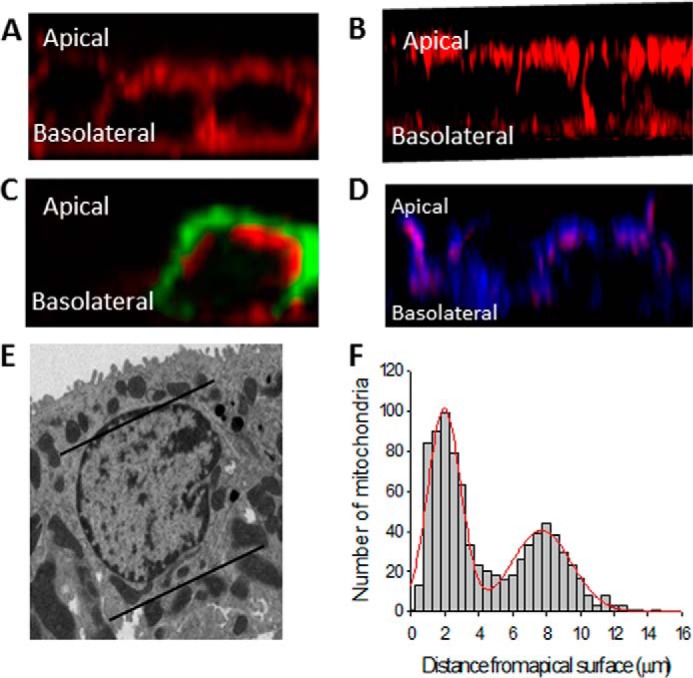
Location of mitochondrial bands in CCD cells. A, mpkCCD cells stained with MitoTracker Red. B, A6 cells stained with MitoTracker Red. C, localization of mitochondria (red) in relation to the plasma membrane (green) in mpkCCD cells. D, localization of mitochondria (red) in relation to the ER (blue) in mpkCCD cells. E, transmission electron microscopy (TEM) of a principal cell from a mouse kidney. F, distance of 900 mitochondria from the apical membrane in mouse principal cells. The red line is the best least-squares fit of the distances to two Gaussian distributions.
[Ca2+]i Does Not Spread in the Cortical Collecting Duct
In Fig. 3, we show that mitochondria in the CCD form bands underneath the apical and basal membranes. This morphology is similar to other epithelia, such as airway epithelia, in which mitochondrial bands slow Ca2+ movement across the cell. Because morphology does not necessarily imply function, we tested whether Ca2+ can move across live CCD cells from one membrane to the other (Fig. 4). To be able to clearly observe Ca2+ beneath the cell membrane at the apical and basal poles, we transfected cells with a membrane-tethered Ca2+ sensor, pN1-Lck-CaMP2 (19). This protein contains a membrane-tethering domain from Src and a GFP molecule that is fused to calmodulin so that an increase in [Ca2+]i beneath the membrane enhances the fluorescence of the GFP molecule. In Fig. 4A, we applied ionomycin to the apical surface of the cell and found that [Ca2+]i increased in the apical but not basal region of the cytosol. Conversely, Fig. 4 B shows that basal ionomycin increases [Ca2+]i in the basal but not apical portion of the cytosol, suggesting that [Ca2+]i is compartmentalized in mpkCCD cells. Fig. 4C shows that, in the absence of mitochondrial Ca2+ uptake, [Ca2+]i compartmentalization is lost and that apical application of ionomycin results in an increase in [Ca2+]i in both the apical and basal portions of the cytosol.
FIGURE 4.

Calcium localization following ionomycin treatment in mpkCCD cells. Cells were transfected with Lck-CaMP to visualize Ca2+ at the plasma membrane. All images are z stacks, with the apical surface at the top of the image. A, ionomycin was added apically, and the image was taken about 1 min later. B, ionomycin was added basally, pixels were quantified at 5 and 10 min, and the image shown is at 10 min following addition. C, Ru360 was added apically followed by apical ionomycin. n ≥ 3/group; *, p < 0.05 compared with baseline.
Mitochondrial Bands Take Up Ca2+ following [Ca2+]i Increases in CCD
To test whether mitochondria take up Ca2+ following an increase in [Ca2+]i, we cold-loaded mpkCCD cells with the dye Rhod2/AM, which has been shown to be specific for mitochondrial Ca2+ when cells are cold-loaded (20) (Fig. 5). After apical application of ionomycin, there was an increase in mitochondrial Ca2+ in the apical but not basal mitochondrial band. These data show that mitochondria in CCD cells do take up Ca2+ rapidly following an increase in [Ca2+]i at the apical pole of the cell and also confirm that there is limited Ca2+ movement across the cell because there is no Ca2+ uptake by the basal band following an apical increase in [Ca2+]i. Fig. 5B shows localization of Rhod2/AM in mitochondria, and Fig. 5C shows that Ru360 prevents Ca2+ uptake into mitochondria.
FIGURE 5.
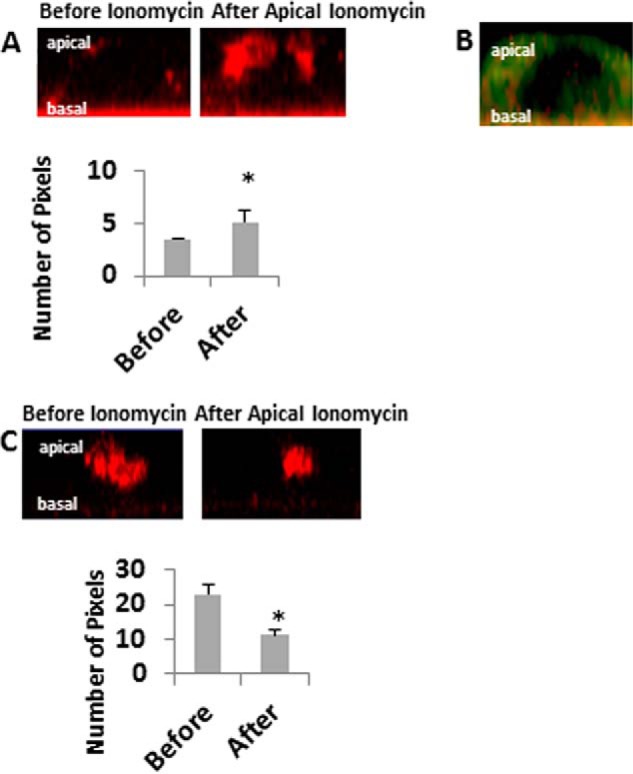
Mitochondrial calcium before and after apical application of ionomycin. mpkCCD cells were stained with Rhod2/AM to visualize mitochondrial calcium. A, z stacks were obtained before (left panel) and after (right panel) apical treatment with 5 μm ionomycin. Apical changes in calcium were quantified before and 30 s to 1 min after treatment. B, cells were co-stained with MitoTracker Green and Rhod2/AM. C, cells were stained with Rhod2/AM and treated with Ru360 for 20 min prior to apical addition of ionomycin. Apical changes in calcium were quantified before and 30 s to 1 min after ionomycin treatment. n ≥ 3/group; *, p < 0.05 versus control.
Discussion
The data shown here are the first to directly show that the effect of increasing [Ca2+]i at the apical versus basolateral membrane produces a different effect on ENaC function in the kidney. Polarization of [Ca2+]i implies that [Ca2+]i is compartmentalized in renal epithelia and does not diffuse between compartments. We show that, in a principal cell line, apical application of the Ca2+ ionophore ionomycin inhibits ENaC activity (Fig. 1). The effects of increasing apical [Ca2+]i on renal ENaC function have been well studied. The most accepted physiological mechanism by which Ca2+ inhibits ENaC occurs downstream of purinergic signaling via the P2Y2 receptor on the apical membrane (7). P2Y2 receptors signal via a Gq-coupled receptor pathway to induce Ca2+ release from ER stores. This release of Ca2+ can act via a variety of signaling pathways, including PKC activation, to inhibit ENaC (25). This is demonstrated physiologically by the fact that mice lacking PKC have overactive ENaC and salt-sensitive hypertension (9, 26). ENaC must be tethered to the apical membrane by PIP2 or phosphatidylinositol 1,4,5-trisphosphate. Although both PIPs and ENaC are rare, they are recruited together by MARCKS. Binding of calmodulin to MARCKS or phosphorylation by PKC leads to removal of MARCKS and, therefore, ENaC from the membrane. Ca2+ may also inhibit ENaC directly or activate the ubiquitin ligase Nedd4-2 to tag ENaC for proteasomal degradation (13, 27).
Interestingly, our data also show, for the first time, that ENaC is stimulated by basolaterally applied ionomycin (Fig. 1B). It is of note that stimulating ENaC requires a very high dose of ionomycin and takes much longer than apical ionomycin to cause an effect. This could imply that effects of basal [Ca2+]i on ENaC are not physiologically relevant. It is likely that the delay in response and high dose of ionomycin are due to the larger volume of media on the basolateral side of the cells, small size of the pores in the polyester membranes used as a surface in our experiments, and invagination of the basal membrane which limit the diffusion of ionomycin so that a larger dose and more time are needed. Unfortunately determining whether this is the case would be difficult to test experimentally.
What is not clear from this work (or work published previously) are the signaling mechanisms dictating how basolateral increases in [Ca2+]i work to stimulate ENaC activity. Our previous work shows that basolateral P2X4 receptor stimulation of ENaC is dependent on PI3K and Ca2+. Because Ca2+ is not known to modulate PI3K directly, there must be an intermediate signaling molecule mediating the process. Src is one protein that can be regulated by Ca2+ and can modulate PI3K and has been shown to regulate ENaC (28). It is possible, therefore, that src is an intermediate in P2X4 signaling or that P2X4 signaling cannot occur without cross-talk from receptor tyrosine kinases upstream of src. Future investigation of these signaling pathways will provide valuable insights into ENaC regulation.
Using two cell culture lines derived from this kidney segment, we observe that, in a polarized, live cell culture system, mitochondria form distinct bands at the apical and basal poles of the cells (Fig. 3). Bands such as these have been identified previously in other epithelial cell types: pancreatic acinar cells and airway epithelia (16, 17). Interestingly, airway and renal epithelia are the primary sites of ENaC expression (29). Although the influence of airway mitochondrial bands on ENaC activity has not been addressed, it is interesting that all tissues in which banding has been observed rely heavily on ENaC for function. We also show that this banding occurs in vivo because transmission electron microscopy of mouse kidney shows banding in cortical collecting duct principal cells.
In this study, we observed the apical mitochondrial band to be situated just beneath the plasma membrane with portions of the ER jutting through the band. This particular localization is interesting in that it would allow the mitochondria to participate in Ca2+ regulation near lipid raft domains. Indeed, ENaC is known to localize in such domains and proteins such as Nedd4–2 and MARCKS, known to regulate ENaC in these domains are influenced by [Ca2+]i (12, 30). Future experiments should be aimed at determining whether disrupting mitochondrial Ca2+ uptake influences lipid raft Ca2+ signaling.
Using innovative Ca2+ sensors for [Ca2+]i beneath the membrane and mitochondrial Ca2+, we show that [Ca2+]i is taken up by mitochondria following apical application of ionomycin and that [Ca2+]i stimulated by ionomycin does not spread throughout the cell (Fig. 4). To visualize mitochondrial Ca2+, we used the dye Rhod2/AM (Fig. 5). This dye can sense [Ca2+]i as well but has a preference for mitochondrial Ca2+ when cold-loaded and seemed to localize in a band in our study (20). We were really only able to visualize the apical mitochondrial band using Rhod2/AM. This could be due to the low uptake of the dye and the faintness of the basal band compared with the apical one. For this reason, a limitation of our study is that we were unable to measure Ca2+ uptake by the basal mitochondrial band. We did see the Ca2+ in the apical mitochondrial band increase following apical ionomycin application, indicative of Ca2+ sequestration. To visualize [Ca2+]i, we used the membrane-tethered [Ca2+]i sensor Lck-CaMP (19). This vector consists of an enhanced GFP molecule fused to calmodulin and the membrane domain of Src. When Ca2+ increases at the membrane, the conformation of calmodulin changes so that GFP is excited. This vector helped us to see [Ca2+]i just under the membrane and determine whether [Ca2+]i spread following ionomycin application. We found that mitochondria sequester [Ca2+]i following apical increases in [Ca2+]i and that, when [Ca2+]i is increased on one side of the cell, it does not migrate to the opposing pole.
Mitochondria transport Ca2+ across the inner mitochondrial membrane via the MCU (31). Ru360, a ruthenium compound used in this study to obliterate the polarized effects of [Ca2+]i on ENaC, inhibits MCU as well as a component of outer mitochondrial membrane Ca2+ uptake (22, 32). In the absence of mitochondrial Ca2+ uptake, a similar biphasic response of ENaC to [Ca2+]i was observed regardless of which pole ionomycin was added to (Fig. 2). These data suggest that mitochondrial Ca2+ uptake is required for the polarized response of ENaC to [Ca2+]i.
It is interesting that mitochondrial Ca2+ uptake has been implicated in blood pressure regulation in a Chinese family that displays maternally inherited hypertension (33). The data presented here provide the groundwork for future investigations into the role of mitochondrial Ca2+ uptake in ENaC regulation in salt-sensitive hypertension.
Overall, we conclude that the renal epithelial sodium channel ENaC likely exists in microdomains of Ca2+ signaling and that these domains are maintained by belts of mitochondria within the renal epithelial cell. Because this is the first work suggesting the existence of mitochondrial barriers to [Ca2+]i movement in renal epithelia, much work remains to be done to determine what role these barriers play in the regulation of other proteins or systemic blood pressure.
Author Contributions
T. L. T. and D. C. E. conceived and coordinated the study and wrote the manuscript. L. G. P., L. Y., M. M. W., H. Y. C. L., H. F. B., B. J. D., O. A., and B. L. provided technical assistance and advice. H. M. helped troubleshoot experiments. L. G. P, H. C. L., and T. L. T. analyzed the data.
This work was supported by NIDDK/National Institutes of Health Grants R37-DK037963 (to D. C. E.) and R01-DK100582 (to H. M.) and American Heart Association Grant 13POST16820072 (to T. L. T.). The authors declare that they have no conflicts of interest with the contents of this article.
- ENaC
- epithelial sodium channel
- MARCKS
- myristoylated alanine-rich C kinase substrate
- MCU
- mitochondrial calcium uniporter
- PIP2
- phosphatidylinositol 4,5-bisphosphate
- IP3
- inositol 1,4,5-trisphosphate
- CCD
- cortical collecting duct.
References
- 1.Rossier B. C. (2014) Epithelial sodium channel (ENaC) and the control of blood pressure. Curr. Opin. Pharmacol. 15, 33–46 [DOI] [PubMed] [Google Scholar]
- 2.Su Y. R., and Menon A. G. (2001) Epithelial sodium channels and hypertension. Drug Metab. Dispos. 29, 553–556 [PubMed] [Google Scholar]
- 3.Laffer C. L., Elijovich F., Eckert G. J., Tu W., Pratt J. H., and Brown N. J. (2014) Genetic variation in CYP4A11 and blood pressure response to mineralocorticoid receptor antagonism or ENaC inhibition: an exploratory pilot study in African Americans. J. Am. Soc. Hypertens. 8, 475–480 [DOI] [PMC free article] [PubMed] [Google Scholar]
- 4.Kashlan O. B., and Kleyman T. R. (2012) Epithelial Na+ channel regulation by cytoplasmic and extracellular factors. Exp. Cell Res. 318, 1011–1019 [DOI] [PMC free article] [PubMed] [Google Scholar]
- 5.Büsst C. J. (2013) Blood pressure regulation via the epithelial sodium channel: from gene to kidney and beyond. Clin. Exp. Pharmacol. Physiol. 40, 495–503 [DOI] [PubMed] [Google Scholar]
- 6.Schaeffer C., Creatore A., and Rampoldi L. (2014) Protein trafficking defects in inherited kidney diseases. Nephrol. Dial. Transplant. 29, iv33–44 [DOI] [PubMed] [Google Scholar]
- 7.Toney G. M., Vallon V., and Stockand J. D. (2012) Intrinsic control of sodium excretion in the distal nephron by inhibitory purinergic regulation of the epithelial Na+ channel. Curr. Opin. Nephrol. Hypertens. 21, 52–60 [DOI] [PMC free article] [PubMed] [Google Scholar]
- 8.Vallon V., and Rieg T. (2011) Regulation of renal NaCl and water transport by the ATP/UTP/P2Y2 receptor system. Am. J. Physiol. Renal Physiol. 301, F463–475 [DOI] [PMC free article] [PubMed] [Google Scholar]
- 9.Bao H. F., Thai T. L., Yue Q., Ma H. P., Eaton A. F., Cai H., Klein J. D., Sands J. M., and Eaton D. C. (2014) ENaC activity is increased in isolated, split-open cortical collecting ducts from protein kinase Cα knockout mice. Am. J. Physiol. Renal Physiol. 306, F309–320 [DOI] [PMC free article] [PubMed] [Google Scholar]
- 10.Pochynyuk O., Bugaj V., Vandewalle A., and Stockand J. D. (2008) Purinergic control of apical plasma membrane PI(4,5)P2 levels sets ENaC activity in principal cells. Am. J. Physiol. Renal Physiol. 294, F38–46 [DOI] [PubMed] [Google Scholar]
- 11.Yue G., Malik B., Yue G., and Eaton D. C. (2002) Phosphatidylinositol 4,5-bisphosphate (PIP2) stimulates epithelial sodium channel activity in A6 cells. J. Biol. Chem. 277, 11965–11969 [DOI] [PubMed] [Google Scholar]
- 12.Alli A. A., Bao H. F., Alli A. A., Aldrugh Y., Song J. Z., Ma H. P., Yu L., Al-Khalili O., and Eaton D. C. (2012) Phosphatidylinositol phosphate-dependent regulation of Xenopus ENaC by MARCKS protein. Am. J. Physiol. Renal Physiol. 303, F800–811 [DOI] [PMC free article] [PubMed] [Google Scholar]
- 13.Henry P. C., Kanelis V., O'Brien M. C., Kim B., Gautschi I., Forman-Kay J., Schild L., and Rotin D. (2003) Affinity and specificity of interactions between Nedd4 isoforms and the epithelial Na+ channel. J. Biol. Chem. 278, 20019–20028 [DOI] [PubMed] [Google Scholar]
- 14.Thai T. L., Yu L., Eaton D. C., Duke B. J., Al-Khalili O., Lam H. Y., Ma H., and Bao H. F. (2014) Basolateral P2X(4)channels stimulate ENaC activity in Xenopus cortical collecting duct A6 cells. Am. J. Physiol. Renal Physiol. 307, F806–813 [DOI] [PMC free article] [PubMed] [Google Scholar]
- 15.Zhang Y., Sanchez D., Gorelik J., Klenerman D., Lab M., Edwards C., and Korchev Y. (2007) Basolateral P2X4-like receptors regulate the extracellular ATP-stimulated epithelial Na+ channel activity in renal epithelia. Am. J. Physiol. Renal Physiol. 292, F1734–1740 [DOI] [PubMed] [Google Scholar]
- 16.Ribeiro C. M., Paradiso A. M., Livraghi A., and Boucher R. C. (2003) The mitochondrial barriers segregate agonist-induced calcium-dependent functions in human airway epithelia. J. Gen. Physiol. 122, 377–387 [DOI] [PMC free article] [PubMed] [Google Scholar]
- 17.Tinel H., Cancela J. M., Mogami H., Gerasimenko J. V., Gerasimenko O. V., Tepikin A. V., and Petersen O. H. (1999) Active mitochondria surrounding the pancreatic acinar granule region prevent spreading of inositol trisphosphate-evoked local cytosolic Ca2+ signals. EMBO J. 18, 4999–5008 [DOI] [PMC free article] [PubMed] [Google Scholar]
- 18.Bao H. F., Song J. Z., Duke B. J., Ma H. P., Denson D. D., and Eaton D. C. (2012) Ethanol stimulates epithelial sodium channels by elevating reactive oxygen species. Am. J. Physiol. Cell Physiol. 303, C1129–1138 [DOI] [PMC free article] [PubMed] [Google Scholar]
- 19.Shigetomi E., Kracun S., Sofroniew M. V., and Khakh B. S. (2010) A genetically targeted optical sensor to monitor calcium signals in astrocyte processes. Nat. Neurosci. 13, 759–766 [DOI] [PMC free article] [PubMed] [Google Scholar]
- 20.Trollinger D. R., Cascio W. E., and Lemasters J. J. (1997) Selective loading of Rhod 2 into mitochondria shows mitochondrial Ca2+ transients during the contractile cycle in adult rabbit cardiac myocytes. Biochem. Biophys. Res. Commun. 236, 738–742 [DOI] [PubMed] [Google Scholar]
- 21.Finkel T., Menazza S., Holmström K. M., Parks R. J., Liu J., Sun J., Liu J., Pan X., and Murphy E. (2015) The ins and outs of mitochondrial calcium. Circ. Res. 116, 1810–1819 [DOI] [PMC free article] [PubMed] [Google Scholar]
- 22.Gincel D., Vardi N., and Shoshan-Barmatz V. (2002) Retinal voltage-dependent anion channel: characterization and cellular localization. Invest. Ophthalmol. Vis. Sci. 43, 2097–2104 [PubMed] [Google Scholar]
- 23.Kirichok Y., Krapivinsky G., and Clapham D. E. (2004) The mitochondrial calcium uniporter is a highly selective ion channel. Nature 427, 360–364 [DOI] [PubMed] [Google Scholar]
- 24.Wildman S. S., Kang E. S., and King B. F. (2009) ENaC, renal sodium excretion and extracellular ATP. Purinergic Signal. 5, 481–489 [DOI] [PMC free article] [PubMed] [Google Scholar]
- 25.Farah C. A., and Sossin W. S. (2012) The role of C2 domains in PKC signaling. Adv. Exp. Med. Biol. 740, 663–683 [DOI] [PubMed] [Google Scholar]
- 26.Bao H. F., Zhang Z. R., Liang Y. Y., Ma J. J., Eaton D. C., and Ma H. P. (2007) Ceramide mediates inhibition of the renal epithelial sodium channel by tumor necrosis factor-α through protein kinase C. Am. J. Physiol. Renal Physiol. 293, F1178–1186 [DOI] [PubMed] [Google Scholar]
- 27.Wang J., Peng Q., Lin Q., Childress C., Carey D., and Yang W. (2010) Calcium activates Nedd4 E3 ubiquitin ligases by releasing the C2 domain-mediated auto-inhibition. J. Biol. Chem. 285, 12279–12288 [DOI] [PMC free article] [PubMed] [Google Scholar]
- 28.Gilmore E. S., Stutts M. J., and Milgram S. L. (2001) SRC family kinases mediate epithelial Na+ channel inhibition by endothelin. J. Biol. Chem. 276, 42610–42617 [DOI] [PubMed] [Google Scholar]
- 29.Snyder P. M. (2002) The epithelial Na+ channel: cell surface insertion and retrieval in Na+ homeostasis and hypertension. Endocrine Rev. 23, 258–275 [DOI] [PubMed] [Google Scholar]
- 30.Hill W. G., Butterworth M. B., Wang H., Edinger R. S., Lebowitz J., Peters K. W., Frizzell R. A., and Johnson J. P. (2007) The epithelial sodium channel (ENaC) traffics to apical membrane in lipid rafts in mouse cortical collecting duct cells. J. Biol. Chem. 282, 37402–37411 [DOI] [PubMed] [Google Scholar]
- 31.Williams G. S., Boyman L., Chikando A. C., Khairallah R. J., and Lederer W. J. (2013) Mitochondrial calcium uptake. Proc. Natl. Acad. Sci. U.S.A. 110, 10479–10486 [DOI] [PMC free article] [PubMed] [Google Scholar]
- 32.Brustovetsky N., Brustovetsky T., Jemmerson R., and Dubinsky J. M. (2002) Calcium-induced cytochrome c release from CNS mitochondria is associated with the permeability transition and rupture of the outer membrane. J. Neurochem. 80, 207–218 [DOI] [PubMed] [Google Scholar]
- 33.Liu Y., Gao L., Xue Q., Li Z., Wang L., Chen R., Liu M., Wen Y., Guan M., Li Y., and Wang S. (2011) Voltage-dependent anion channel involved in the mitochondrial calcium cycle of cell lines carrying the mitochondrial DNA A4263G mutation. Biochem. Biophys. Res. Commun. 404, 364–369 [DOI] [PubMed] [Google Scholar]