Background: Heparin prevents intracellular hyaluronan synthesis and subsequent autophagy in hyperglycemic dividing mesangial cells.
Results: The non-reducing terminal trisaccharide of heparin is sufficient for this response.
Conclusion: This heparin trisaccharide motif is exposed by the mammalian heparanase and is recognized by a receptor on dividing cells.
Significance: The trisaccharide does not have the anti-coagulant properties of heparin.
Keywords: diabetes, diabetic nephropathy, endoplasmic reticulum stress (ER stress), glucose metabolism, heparanase, heparin, hyaluronan, inflammation, monocyte adhesive hyaluronan matrix, trisaccharide
Abstract
Our previous studies showed: (i) that growth-arrested G0/G1 rat mesangial cells stimulated to divide in hyperglycemic medium initiate intracellular hyaluronan synthesis that induces autophagy and the cyclin D3-induced formation of a monocyte-adhesive extracellular hyaluronan matrix after completing cell division; and (ii) that heparin inhibits the intracellular hyaluronan and autophagy responses, but after completing division, induces hyaluronan synthesis at the plasma membrane with the formation of a larger monocyte-adhesive hyaluronan matrix. This study shows: (i) that the non-terminal trisaccharide of heparin is sufficient to initiate the same responses as intact heparin, (ii) that a fully sulfated tetrasaccharide isolated from bacterial heparin lyase 1 digests of heparin that contains a Δ-2S-iduronate on the non-reducing end does not initiate the same responses as intact heparin, and (iii) that removal of the Δ-2S-iduronate to expose the fully sulfated trisaccharide (GlcNS(6S)-IdoUA(2S)-GlcNS(6S)) does initiate the same responses as intact heparin. These results provide evidence that mammalian heparanase digestion of heparin and heparan sulfate exposes a cryptic motif on the non-reducing termini that is recognized by a receptor on dividing cells.
Introduction
Our previous studies have shown that glomerular mesangial cells that divide in medium with glucose concentrations three times higher than normal or greater activate hyaluronan synthesis in intracellular compartments (1, 2). This initiates an autophagy and subsequent extrusion of a monocyte-adhesive hyaluronan matrix after completing cell division. This mechanism also occurs in vivo in the streptozotocin type 1 diabetic rat model with extensive accumulation of hyaluronan in glomeruli and influx of macrophages, resulting in nephropathy, proteinuria, and kidney failure by 6 weeks. Previous studies demonstrated that daily intraperitoneal injection of heparin (55 mg/kg) in the diabetic rat model prevented the proteinuria and nephropathy, and sustained kidney function for 8–10 weeks (3, 4). Therefore, we determined the effects of heparin on hyperglycemic dividing rat mesangial cells (RMCs)2 in vitro and in the diabetic rat model (2). The results showed that heparin (2.0 μg/ml) prevented the intracellular hyaluronan synthesis and autophagy in vitro. However, after completing division, the cells synthesized an even larger extracellular monocyte-adhesive hyaluronan matrix. In vivo, glomerular hyaluronan in heparin-treated diabetic rats increased greatly in weeks 1–2 and declined to near control, i.e. near absence of hyaluronan, by 6 weeks, at which time the glomeruli had extensive numbers of macrophages. These previous results provide evidence that dividing cells have a receptor that binds heparin and initiates the intracellular responses that inhibit activation of hyaluronan synthesis in intracellular compartments during division and that reprogram the cells to address the sustained glucose stress after division by initiating synthesis of a large monocyte-adhesive extracellular hyaluronan matrix.
However, the molecular mechanism(s) underlying the interaction between heparin and mesangial cells is still unclear. Our previous studies (5–7) support our proposal for a receptor for heparin on the surface of quiescent, growth-arrested G0/G1 RMCs based on the observations that: (i) binding of heparin to RMCs is specific, rapid (5–10 min), saturable (within 60 min), and reversible; (ii) Scatchard analysis of heparin binding indicates a single class with ∼6.6 × 10⁶ binding sites per cell (Kd = 1.6 × 10⁻⁸ m) in quiescent cells; (iii) surface-bound heparin can be internalized and degraded; (iv) the affinity and number of heparin binding sites are affected by the stage of RMC growth; and (v) heparin acts at the RMC surface to affect both PKC-dependent and PKC-independent pathways. This study demonstrates that the motif recognized by the heparin receptor resides in the non-reducing terminal NS,6S-glucosamine trisaccharide.
Experimental Procedures
Reagents
Streptomyces hyaluronidase, Streptococcal hyaluronidase, chondroitinase ABC, and heparin lyase 1 (E.C. 4.2.2.7) were from Seikagaku America Inc. (East Falmouth, MA). FITC-heparin and DiI were purchased from Molecular Probes.
RMC Cultures
RMC cultures were established from isolated glomeruli and characterized as described previously (8, 9). RMCs were used between passages 5 and 15, when they still contract in response to angiotensin II and endothelin, which are additional characteristics of mesangial cells (6, 10), and they exhibit growth suppression in the presence of heparin (1 μg/ml) (5, 9, 11). RMCs were cultured in RPMI 1640 medium containing 10% FBS and passaged at confluence by trypsinization for 5 min with a solution of 0.025% trypsin, 0.5 mm EDTA.
To render cells quiescent (5), cultures at ∼40% confluence (−2 × 10⁴ cells/cm2) were washed with RPMI 1640 medium and placed in fresh medium containing 0.4% FBS for 48 h (yielding 70–80% confluent cultures). The cells were then washed twice with fresh RPMI 1640 and stimulated with 10% FBS in RPMI 1640 containing 25.6 mm glucose at time 0, with or without heparin, or other oligosaccharides at concentrations reported in individual experiments.
Assay for Monocyte Adhesion
RMCs in 6-well plates were treated up to 72 h with 10% FBS and concentrations of 5.6 and 25.6 mm d-glucose (12, 13). U937 cells were cultured in suspension in RPMI 1640 medium containing 5% FBS and passaged at a 1:5 ratio (2 × 10⁵ cells/ml) every 48 h (13). Assays for monocyte adhesion were done as described previously (12, 13). After washing at 4 °C, the cell cultures were imaged by microscopy with a Polaroid digital camera, and the numbers of monocytes per culture area were counted using Image-Pro software (12). Each culture was equally divided into four regions, and a culture area for imaging was randomly picked in each region.
Fluorophore-assisted Carbohydrate Electrophoresis (FACE) Analysis of Reducing Saccharides
Cell cultures were incubated with proteinase K (250 μg/ml) in 0.1 m ammonium acetate, pH 7.0, for 3 h at 60 °C (14–17). The reaction was terminated by heating the samples at 95 °C for 3–5 min. Glycosaminoglycans were recovered by precipitation in 75% ethanol at 20 °C overnight and centrifugation. The pellets were dissolved in 0.1 m ammonium acetate, pH 7.0, and incubated with streptococcal hyaluronidase (50 milliunits/ml) and chondroitinase ABC at 2 units/ml overnight at 37 °C to generate disaccharides from hyaluronan and chondroitin/dermatan sulfate. The reaction was terminated by heating the samples at 95 °C for 3–5 min. The digests were dried by centrifugal evaporation and then subjected to reductive amination with 2-aminoacridone as described previously (14, 15). At the end of the incubation, the samples were each mixed with glycerol to 20%, and 5-μl aliquots were then subjected to electrophoresis on Glyko Mono Composition gels with Mono Running buffer from ProZyme Inc. (San Leandro, CA). Running conditions were 500 V at 4 °C in a cold room for 1 h. Gels were imaged on an Ultra-Lum transilluminator (365 nm). Images were captured with a Quantix cooled charge-coupled device camera from Roper Scientific/Photometrics and analyzed with the Gel-Pro Analyzer program version 3.0 (Media Cybernetics). The hyaluronan contents were quantified according to the integrated intensities of signal bands and then normalized with chondroitin sulfate contents.
Fluorescent Derivatization of Heparin Samples with 2-Aminoacridone
Heparin was digested with the bacterial heparin lyase 1 (Seikagaku) overnight, and its endoeliminase activity was inactivated by incubation at 100 °C for 10 min (16, 17). The samples were subsequently cooled on ice for 10 min. To purify heparin trisaccharides, the digests were precipitated in 82.5% ethanol and lyophilized as described previously (16). Each sample was labeled in an 8-μl reaction volume using PCR tubes and low retention pipette tips. Briefly, 4 μl of 12.5 mm 2-aminoacridine in 85% dimethyl sulfoxide and 15% glacial acetic acid was added to each lyophilized sample, and the solution was incubated at 25 °C for 20 min. Then 4 μl of 1.25 m sodium cyanoborohydride in distilled water was added, followed by an overnight (16–18-h) incubation at 37 °C. The disaccharides and oligosaccharides were analyzed using OLIGO profiling gels and companion buffers (ProZyme) at 15 mA/gel (constant) as described previously (16, 17).
Uptake of Heparin and Hep-Tri by Mesangial Cells
To determine whether or not heparin and Hep-Tri are internalized by RMCs, growth-arrested G0/G1 cultures were stimulated to divide with 10% FBS in high glucose medium in the presence of 1 μg/ml FITC-heparin or Hep-Tri labeled by AMAC for 2 h. Cells were then lightly fixed by 4% paraformaldehyde for 10 min at room temperature and then analyzed by fluorescent microscopy. DiI (0.5 μg/ml) was added at 30 min before the end of incubation following the manufacturer's instructions.
Results
Heparin is synthesized in mast cells as a proteoglycan, serglycin, which contains 15–20 heparin chains with a molecular mass of ∼120 kDa. During or after entry into the secretory granules, the chains are hydrolyzed by heparanase to 10–15 kDa (18, 19). There is only one heparanase in the human genome, and it hydrolyzes bonds between hexuronate residues and GlcNS(6S) (20). Bacterial heparin lyase is an endoeliminase that converts heparin primarily to disaccharides containing unsaturated (Δ-hexuronate) residues at their non-reducing ends (Fig. 1A). When heparin lyase acts, it also forms a saturated trisaccharide (Hep Digest/Tri) from the non-reducing end of the heparin chain formed through the action of heparanase on serglycin (21, 22). The FACE analysis of the heparin digestion mixture showed that more than 90% of labeled saccharides are the highly sulfated ΔUA(2S)GlcNS(6S) disaccharide, consistent with the highly sulfated structure of heparin, and revealed the presence of two trisaccharide bands (Fig. 1B). Ethanol precipitation removed the Δ-disaccharides from the mixture, and the purified heparin digest (Hep Digest/Tri) contains a minor amount of a fully sulfated, faster migrating trisaccharide (Tri), GlcNS(6S)-UA(2S)-GlcNS(6S), and a major slower migrating trisaccharide (Hep Digest/Tri**) likely with one less sulfate residue. The Δ-Di band intensity was >10 times the sum of the trisaccharide bands. The purified Hep Digest/Tri sample contains only a small amount of the Δ-Di. Thus, the mass of the Hep Digest/Tri used in the following experiment was <1/10 that of the heparin, i.e. at equivalent molar concentrations.
FIGURE 1.
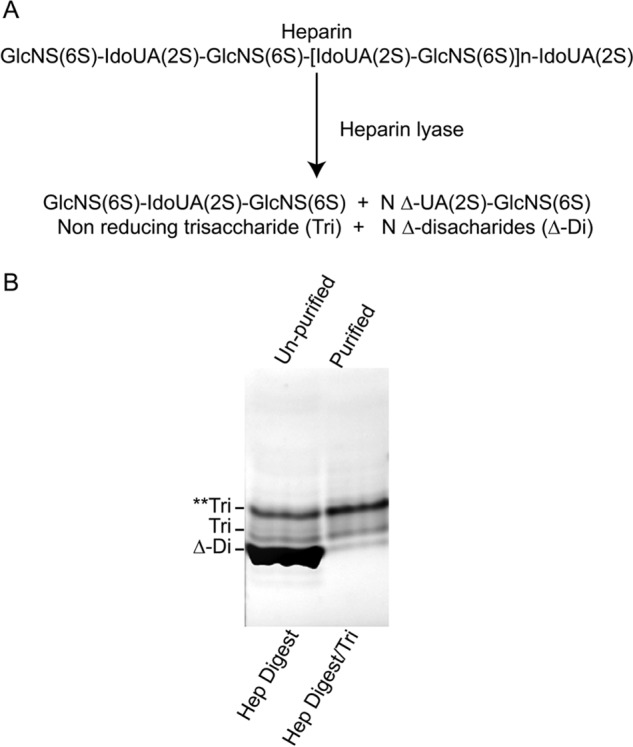
Trisaccharides generated from heparin by heparin lyase digestion. A, composition of what a fully sulfated heparin molecule would be and of the trisaccharide and Δ-disaccharides that would result from digestion with a bacterial endoeliminase heparin lyase. B, FACE gel analyses of the heparin lyase digest of heparin (Hep Digest) and of the trisaccharides (Hep Digest/Tri) after removing the Δ-disaccharides. Tri** corresponds to an undersulafted trisaccharide.
Fig. 2 compares the effects of different concentrations of the heparin and Hep Digest/Tri on hyaluronan synthesis and U937 monocyte binding. The RMC cultures were growth-arrested to G0/G1 and stimulated to divide in hyperglycemic medium without (Control) and with heparin and with Hep Digest/Tri as described under “Experimental Procedures.” Hyaluronan contents and U937 monocyte binding were determined at 72 h, ∼48 h after completing cell division. As shown in Fig. 2A, increased synthesis of hyaluronan was nearly identical for the concentrations of intact heparin (white bars) and Hep Digest/Tri (black bars). Both treatments reached a plateau level ∼2 times the hyperglycemic medium alone at a concentration of 0.3 μg/ml heparin and ∼0.03 μg/ml Hep Digest/Tri. A concentration of 0.15 μg/ml heparin (∼0.015 μg/ml Hep Digest/Tri) increased synthesis nearly midway to the plateau level. If all the Hep Digest/Tri lacked one sulfate residue and were recognized by the receptor, this would be conservatively ∼20 nmol/ml.
FIGURE 2.
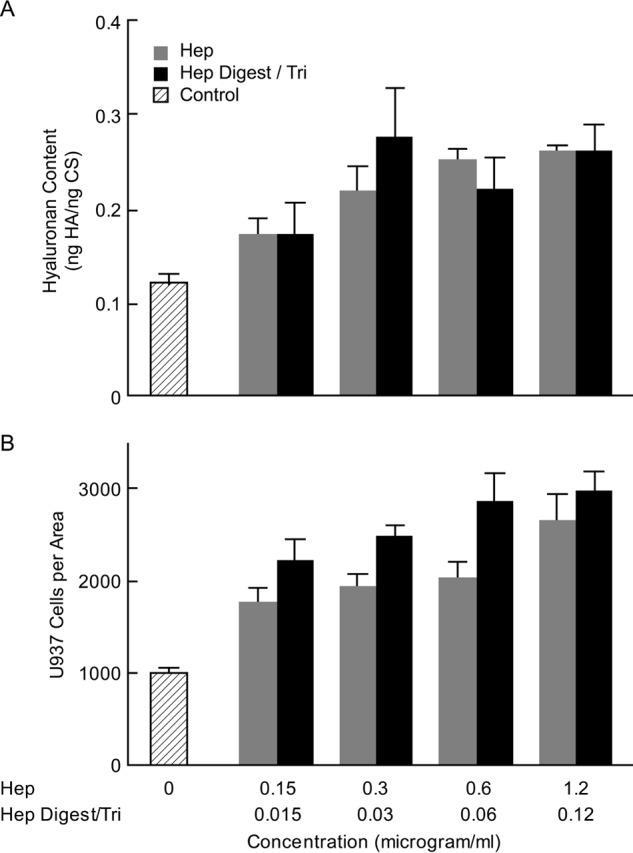
Effects of different concentrations of the heparin and Hep Digest/Tri on hyaluronan synthesis and monocyte adhesion. A, hyaluronan in cultures 72 h after stimulation to divide in high glucose (25 mm) alone (Control), with different concentrations of heparin (0. 15–1.2 μg/ml) (white bars), or with different concentrations of Hep Digest/Tri (∼0.015–0.12 μg/ml) (black bars). B, numbers of U937 monocytes bound to a selected size in random areas of the cultures treated as described in A. The S.D. values are shown for the results of 3 independent cultures for each bar.
Binding of U937 monocytes also increased to a plateau level ∼2.5 times the hyperglycemia medium alone with no significant differences between heparin and Hep Digest/Tri (Fig. 2B). Interestingly, the numbers bound at 0.15 μg/ml heparin (∼0.015 μg/ml Hep Digest/Tri) were already near the plateau level, although the increase in hyaluronan at this concentration was significantly less than the plateau level. This suggests the possibility that coalescence of hyaluronan cable structures among the cells that occurs in the monocyte-adhesive hyaluronan matrices at plateau may limit the number of monocytes that can bind, whereas the sparsity of the monocyte-adhesive structures in the pre-plateau cultures can accommodate relatively more.
Fig. 3A shows an example of the U937 monocyte adhesion results on cultures 72 h after initiating cell division from G0/G1 cells, and Fig. 3B shows the bar graphs from assays of three replicate analyses for each. Plateau concentrations of 0.3 μg/ml heparin and ∼0.03 μg/ml Hep Digest/Tri were used. The ratios of hyaluronan to the value in hyperglycemic cultures alone (Control) are also indicated in Fig. 3A. Both the heparin and the Hep Digest/Tri treatments significantly increased hyaluronan and U937 monocyte binding as compared with the high glucose control cultures. Therefore, the results in Figs. 2 and 3 provide compelling evidence that the structure determinant on heparin required for the induction to form the extensive monocyte-adhesive hyaluronan matrix resides on its non-reducing termini.
FIGURE 3.
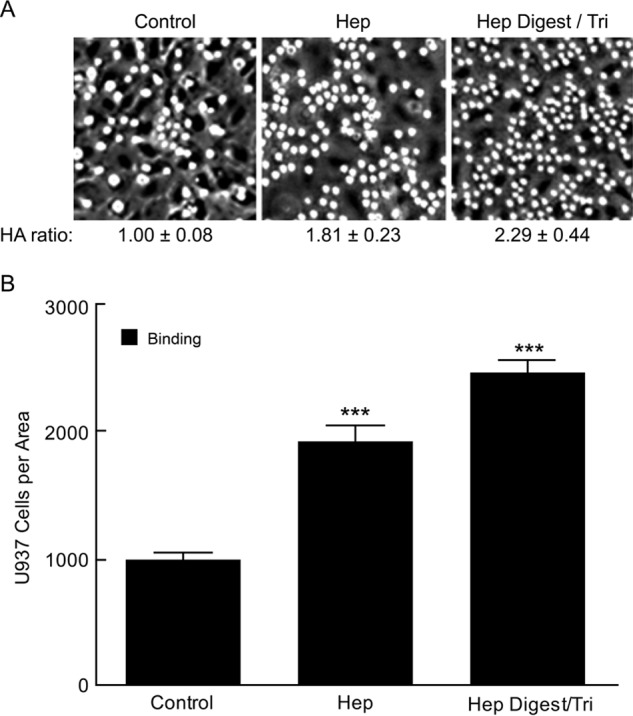
Effects of Hep Digest/Tri and heparin on hyaluronan synthesis and monocyte adhesion. A, representative micrographs showing U937 monocytes adhering to the hyaluronan (HA) matrices at 4 °C in the indicated cultures. The ratios of the hyaluronan contents for the heparin and Hep Digest/Tri cultures to the average value in the control cultures are indicated. B, the numbers of U937 monocytes bound to the cultures as described in A. The S.D. values are shown for the results of 3 independent cultures for each bar with statistical significance (***, p < 0.05) indicated for the increases in the heparin and Hep Digest/Tri-treated cultures as compared with the control cultures.
To determine whether exposing the non-reducing GlcNS(6S) is required to initiate the hyaluronan and monocyte-adhesive responses, a fully sulfated Δ-tetrasaccharide (Δ-Tetra) purified from heparin lyase-digested heparin was tested (23). FACE analysis of the Δ-Tetra showed a single band that was converted to fully sulfated Δ-UA(2S)-GlcNS(6S) disaccharides after heparin lyase digestion (Fig. 4). Mercuric ion treatment of the Δ-Tetra removed the Δ-UA(2S), as indicated by the unidentified X1 band present when the Δ-hexuronate is 2-sulfated, and as shown when the Δ-disaccharide is converted to the GlcNS(6S) monosaccharide after mercuric ion treatment. The purity of the resulting GlcNS(6S)-UA(2S)-GlcNS(6S) trisaccharide (Hep-Tri) is shown by the single band (tri-).
FIGURE 4.
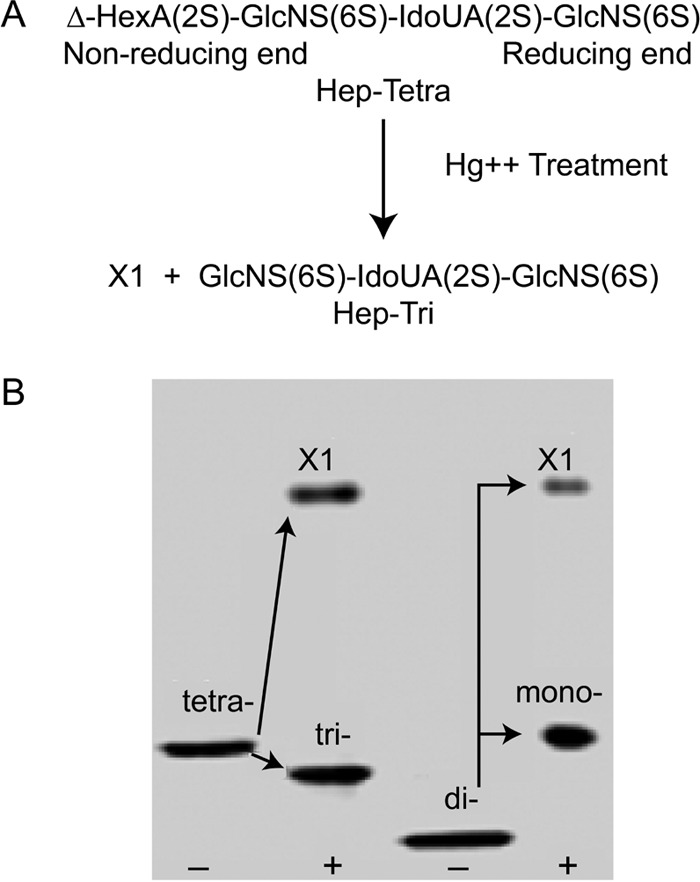
Analysis of heparin tetrasaccharide and trisaccharide. A, composition of the fully sulfated Δ-tetrasaccharide (Hep-Tetra) and the trisaccharide (Hep-Tri) after removing the Δ-hexuronate using Hg2+ treatment. Residual Hg2+ was then removed from the trisaccharide product through cation exchange. B, FACE analyses of the Δ-tetrasaccharide (tetra) and the disaccharide (di) prepared through heparin lyase digestion of heparin, after removal of the Δ-hexuronate(2S) residue, yielding the X1 fragment, and the trisaccharide (tri) and monosaccharide (mono), respectively.
The effects of the Δ-Tetra (0.022 μg/ml) and Hep-Tri (∼0.018 μg/ml) on hyaluronan synthesis and U937 monocyte adhesion in hyperglycemic dividing mesangial cells were analyzed. Fig. 5A shows an example of the U937 monocyte adhesion results on cultures 72 h after initiating cell division from G0/G1 cells, and Fig. 5B shows the bar graphs from assays of three replicate analyses for each. The ratios of hyaluronan to the value in hyperglycemic cultures alone are also indicated in Fig. 5A. The Δ-Tetra showed minimal (not statistically significant) increases in U937 monocyte adhesion and hyaluronan synthesis as compared with the hyperglycemic cultures alone. In contrast, the Hep-Tri showed similar values to those for the heparin and Hep Digest/Tri analyses in Fig. 3. These results indicate that the exposure of the non-reducing GlcNS(6S) on the trisaccharide, which would also be on the non-reducing end of heparin, is necessary to initiate the responses in hyperglycemic dividing mesangial cells that prevent the intracellular hyaluronan synthesis and autophagy and reprogram the cells to synthesize an extensive extracellular monocyte-adhesive hyaluronan matrix after completing division.
FIGURE 5.
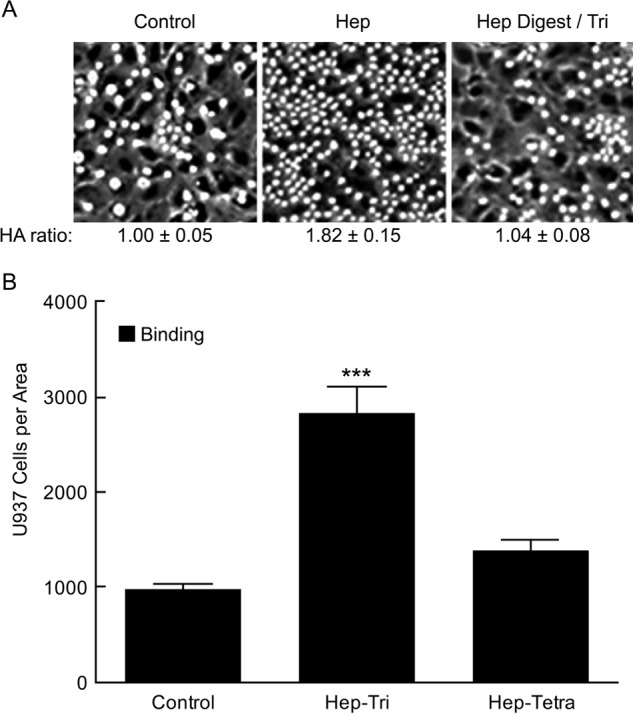
Effects of heparin tetrasaccharide and trisaccharide on hyaluronan synthesis and monocyte adhesion. A, representative micrographs showing U937 monocytes adhering to the hyaluronan (HA) matrices of cultures at 4 °C 72 h after stimulation to divide in high glucose (25 mm) alone (Control), or with 0. 018 μg/ml of the trisaccharide (Hep-Tri) or with 0.022 μg/ml of the Δ-tetrasaccharide (Hep-Tetra). The ratios of hyaluronan contents for the Hep-Tri and Hep-Tetra cultures to the average value in the control cultures are indicated. B, the numbers of U937 monocytes bound to the cultures as described in A. The S.D. values are shown for the results of 3 independent cultures for each bar with statistical significance (***, p < 0.05) indicated for the increase in the Hep-Tri-treated cultures as compared with the control cultures.
To determine whether heparin and Hep-Tri interact with RMCs and then can be internalized by the cells, FITC-labeled heparin and AMAC-labeled Hep Digest/Tri were used when the G0/G1-arrested RMCs were stimulated by serum to reenter the cell cycle in the high glucose medium. Fig. 6 shows the internalization of FITC-labeled heparin and AMAC-labeled Hep-Tri in RMCs. At 2 h after the treatments, FITC-labeled heparin and AMAC-labeled Hep Digest/Tri were internalized and found in the endoplasmic reticulum/Golgi regions of RMCs with some evidence for nuclear localization as well. These data indicate that heparin and Hep Digest/Tri act on RMCs via a similar molecular and cellular mechanism and provide compelling evidence for a putative cell surface receptor mediating their responses.
FIGURE 6.
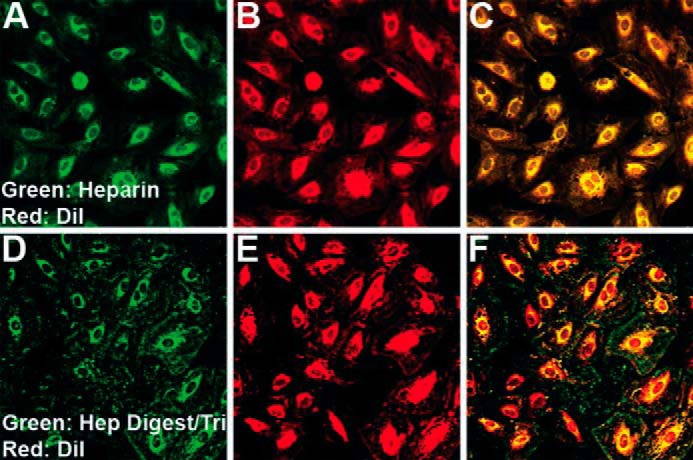
Images of G0/G1 RMC cultures stimulated to divide in high glucose (25 mm) for 2 h with green fluorescent heparin (A–C) or green fluorescent Hep-Tri (D–F) and stained with DiI (red).
Discussion
Previous studies showed that mesangial cells in normal glucose catabolize cell surface heparan sulfate proteoglycans by an endosomal pathway that contains heparanase, which hydrolyzes the heparan sulfate chains (∼50 kDa) into fragments (5–10 kDa), and that a large proportion is recycled into the medium (5, 7, 24). These fragments bound to the surface of G0/G1 growth-arrested cells in normal glucose, but not to confluent cells, and inhibited serum-stimulated mitogenesis of mesangial cells. Further, the intact heparan sulfate chains isolated from the cell surface proteoglycans showed much less activity. Neither trypsin treatment, heating to 90 °C for 20 min, nor chondroitinase digestion had an effect on the ability of the heparan sulfate fragments to suppress thymidine incorporation in the stimulated cells, whereas nitrous acid degradation did. This supports the interpretation that the activity is a property of the heparan sulfate fragments themselves.
The degradation of intact heparan sulfate chains by heparanase occurs by hydrolyzing bonds between hexuronate residues and GlcNS(6S) in the interspaced highly sulfated regions typical of heparan sulfate. Therefore, the heparan sulfate fragments contain the newly formed non-reducing ends with GlcNS(6S), which suggests that the highly sulfated non-reducing end with this motif is also critical for their binding activity to dividing mesangial cells. This is in keeping with the observation in this study that the highly sulfated trisaccharide with GlcNS(6S) at non-reducing ends of heparin is sufficient to induce the formation of the monocyte adhesive hyaluronan matrix.
Heparin is the most highly sulfated glycosaminoglycan and has the most complex structure (see reviews in Refs. 25 and 26). After assembly of the backbone polymer, (glucuronic acid-β1,4-N-acetylglucosamine-α1,4-)n, on the serglycin core protein in mast cells, almost all of the N-acetyl residues are replaced to form N-sulfated glucosamines. A large majority of the glucuronic acid residues are then epimerized at the 5-carbon to form iduronic acid. Subsequent, or concurrent addition of sulfate occurs at the 2-carbon of the hexuronic acids, predominantly on the iduronic acid residues, and on the 6-carbon of the N-sulfated glucosamines. Antithrombin III and growth factors bind to selective sites within the heparin and heparan sulfate chains that are independent from the exposed non-reducing end motif identified in this study and that have substantially lower affinities for binding. In this study, we have found that the highly sulfated trisaccharide with GlcNS(6S) at non-reducing ends of heparin is sufficient to induce the formation of the extensive monocyte adhesive hyaluronan matrix after completing cell division, indicating that the receptor on the mesangial cells recognizes a motif different from ones for growth factors and antithrombin III binding.
Author Contributions
A. W. and V. C. H. designed and coordinated the study and wrote the paper. C. P. W. designed, generated and analyzed the non-reducing terminal trisaccharide of heparin and its biological functions, and contributed to the preparation of the manuscript. F. Z. and R. J. L. designed and generated fully sulfated tetrasaccharide from heparin for the study. A. A. provided technical assistance and contributed to the preparation of the figures. All authors reviewed the results and approved the final version of the manuscript.
Acknowledgments
The Hyaluronan Matrices in Vascular Pathologies Program is funded in its entirety by the NHLBI, National Institutes of Health, Grant P01 HL107147.
This work was supported by National Institutes of Health Grants R01 DK62934 (to A. W.) and P01 HL107147 (to V. H. and A. W., Project 1), and by Mizutani Foundation Grant 140063 (to A. W. and V. H.). The authors declare that they have no conflicts of interest with the contents of this article.
- RMC
- rat mesangial cell
- DiI
- 1,1′-dioctadecyl-3,3,3′,3′-tetramethylindocarbocyanine perchlorate
- FACE
- fluorophore-assisted carbohydrate electrophoresis
- Hep
- heparin
- Hep-Tri
- heparin trisaccharide
- Tri
- trisaccharide
- Δ-Tetra
- Δ-tetrasaccharide
- ΔDi
- Δ-disaccharide
- AMAC
- aminoacridone.
References
- 1.Ren J., Hascall V. C., and Wang A. (2009) Cyclin D3 mediates synthesis of a hyaluronan matrix that is adhesive for monocytes in mesangial cells stimulated to divide in hyperglycemic medium. J. Biol. Chem. 284, 16621–16632 [DOI] [PMC free article] [PubMed] [Google Scholar]
- 2.Wang A., Ren J., Wang C. P., and Hascall V. C. (2014) Heparin prevents intracellular hyaluronan synthesis and autophagy responses in hyperglycemic dividing mesangial cells and activates synthesis of an extensive extracellular monocyte-adhesive hyaluronan matrix after completing cell division. J. Biol. Chem. 289, 9418–9429 [DOI] [PMC free article] [PubMed] [Google Scholar]
- 3.Gambaro G., Cavazzana A. O., Luzi P., Piccoli A., Borsatti A., Crepaldi G., Marchi E., Venturini A. P., and Baggio B. (1992) Glycosaminoglycans prevent morphological renal alterations and albuminuria in diabetic rats. Kidney Int. 42, 285–291 [DOI] [PubMed] [Google Scholar]
- 4.Gambaro G., Venturini A. P., Noonan D. M., Fries W., Re G., Garbisa S., Milanesi C., Pesarini A., Borsatti A., Marchi E., and Baggio B. (1994) Treatment with a glycosaminoglycan formulation ameliorates experimental diabetic nephropathy. Kidney Int. 46, 797–806 [DOI] [PubMed] [Google Scholar]
- 5.Wang A., Fan M. Y., and Templeton D. M. (1994) Growth modulation and proteoglycan turnover in cultured mesangial cells. J. Cell Physiol. 159, 295–310 [DOI] [PubMed] [Google Scholar]
- 6.Miralem T., Wang A., Whiteside C. I., and Templeton D. M. (1996) Heparin inhibits mitogen-activated protein kinase-dependent and -independent c-fos induction in mesangial cells. J. Biol. Chem. 271, 17100–17106 [DOI] [PubMed] [Google Scholar]
- 7.Wang A., and Templeton D. M. (1996) Inhibition of mitogenesis and c-fos induction in mesangial cells by heparin and heparan sulfates. Kidney Int. 49, 437–448 [DOI] [PubMed] [Google Scholar]
- 8.Templeton D. M. (1990) Cadmium uptake by cells of renal origin. J. Biol. Chem. 265, 21764–21770 [PubMed] [Google Scholar]
- 9.Hegele R. G., Behar M., Katz A., and Silverman M. (1989) Immunocytochemical characterization of cells in rat glomerular culture. Clin. Invest. Med. 12, 181–186 [PubMed] [Google Scholar]
- 10.Miralem T., Whiteside C. I., and Templeton D. M. (1996) Collagen type I enhances endothelin-mediated contraction and induces nonproliferating phenotype in mesangial cells. Am. J. Physiol. 270, F960–F970 [DOI] [PubMed] [Google Scholar]
- 11.Mené P., Simonson M. S., and Dunn M. J. (1989) Physiology of the mesangial cell. Physiol. Rev. 69, 1347–1424 [DOI] [PubMed] [Google Scholar]
- 12.Wang A., and Hascall V. C. (2004) Hyaluronan structures synthesized by rat mesangial cells in response to hyperglycemia induce monocyte adhesion. J. Biol. Chem. 279, 10279–10285 [DOI] [PubMed] [Google Scholar]
- 13.de La Motte C. A., Hascall V. C., Calabro A., Yen-Lieberman B., and Strong S. A. (1999) Mononuclear leukocytes preferentially bind via CD44 to hyaluronan on human intestinal mucosal smooth muscle cells after virus infection or treatment with poly(I·C). J. Biol. Chem. 274, 30747–30755 [DOI] [PubMed] [Google Scholar]
- 14.Calabro A., Benavides M., Tammi M., Hascall V. C., and Midura R. J. (2000) Microanalysis of enzyme digests of hyaluronan and chondroitin/dermatan sulfate by fluorophore-assisted carbohydrate electrophoresis (FACE). Glycobiology 10, 273–281 [DOI] [PubMed] [Google Scholar]
- 15.Calabro A., Hascall V. C., and Midura R. J. (2000) Adaptation of FACE methodology for microanalysis of total hyaluronan and chondroitin sulfate composition from cartilage. Glycobiology 10, 283–293 [DOI] [PubMed] [Google Scholar]
- 16.Lauer M. E., Hascall V. C., and Wang A. (2007) Heparan sulfate analysis from diabetic rat glomeruli. J. Biol. Chem. 282, 843–852 [DOI] [PubMed] [Google Scholar]
- 17.Calabro A., Midura R., Wang A., West L., Plaas A., and Hascall V. C. (2001) Fluorophore-assisted carbohydrate electrophoresis (FACE) of glycosaminoglycans. Osteoarthritis Cartilage 9, Suppl. A, S16–S22 [DOI] [PubMed] [Google Scholar]
- 18.Wight T. N., Heinegård D. K., and Hascall V. C. (1991) Proteoglycans: structure and function. in Cell Biology of the Extracellular Matrix (Hay E., and Olsen B., eds) 2nd Ed., pp. 45–78, Plenum Press, New York [Google Scholar]
- 19.Wang A., Sankaranarayanan N. V., Yanagishita M., Templeton D. M., Desai U. R., Sugahara K., Wang C. P., and Hascall V. C. (2015) Heparin interaction with a receptor on hyperglycemic dividing cells prevents intracellular hyaluronan synthesis and autophagy responses in models of type 1 diabetes. Matrix Biol., 10.1016/j.matbio.2015.04.003 [DOI] [PMC free article] [PubMed] [Google Scholar]
- 20.Okada Y., Yamada S., Toyoshima M., Dong J., Nakajima M., and Sugahara K. (2002) Structural recognition by recombinant human heparanase that plays critical roles in tumor metastasis: hierarchical sulfate groups with different effects and the essential target disulfated trisaccharide sequence. J. Biol. Chem. 277, 42488–42495 [DOI] [PubMed] [Google Scholar]
- 21.Linhardt R. J., Turnbull J. E., Wang H. M., Loganathan D., and Gallagher J. T. (1990) Examination of the substrate specificity of heparin and heparan sulfate lyases. Biochemistry 29, 2611–2617 [DOI] [PubMed] [Google Scholar]
- 22.Desai U. R., Wang H. M., and Linhardt R. J. (1993) Specificity studies on the heparin lyases from Flavobacterium heparinum. Biochemistry 32, 8140–8145 [DOI] [PubMed] [Google Scholar]
- 23.Merchant Z. M., Kim Y. S., Rice K. G., and Linhardt R. J. (1985) Structure of heparin-derived tetrasaccharides. Biochem. J. 229, 369–377 [DOI] [PMC free article] [PubMed] [Google Scholar]
- 24.Wang A., Miralem T., and Templeton D. M. (1999) Heparan sulfate chains with antimitogenic properties arise from mesangial cell-surface proteoglycans. Metabolism 48, 1220–1229 [DOI] [PubMed] [Google Scholar]
- 25.Lindahl U., and Kjellén L. (1991) Heparin or heparan sulfate–what is the difference? Thromb. Haemost. 66, 44–48 [PubMed] [Google Scholar]
- 26.Salmivirta M., Lidholt K., and Lindahl U. (1996) Heparan sulfate: a piece of information. FASEB J. 10, 1270–1279 [DOI] [PubMed] [Google Scholar]


