Abstract
We report a newly developed multifunctional 1050 nm spectral domain optical coherence tomography (SD-OCT) system working at 147 kHz A-scan rate for posterior eye imaging. It is demonstrated through in-vivo experiments that this system delivers not only superior performance of posterior eye structural imaging but also detailed visualization of microcirculation network in retina. The choroid of the eye with either myopic or normal conditions can clearly be visualized through the entire scanning volume. These results indicate great potential in applying this new system for clinical studies.
Keywords: microvasculature imaging, retinal imaging, optical microangiography, spectral domain optical coherence tomography
1. Introduction
Optical coherence tomography (OCT) has been widely used in biomedical applications [1]. Particularly in ophthalmology, OCT has become one of the most frequently used tools for the studies of several major eye related diseases such as age-related macular degeneration (AMD), glaucoma and diabetic retinopathy (DR). Compared with 2D fundus photography, OCT provides depth resolved microstructures with unprecedented details of the posterior eye. The structural pathological indicators, such as macular edema, choroid thickness etc. can be obtained and quantified using OCT [2, 3]. Besides the structural information, microcirculation of blood flow in the posterior eye on the other hand also bears important pathological information. For example, capillary dropout and neovascularization are often associated with DR, while the presence of choroidal neovascularization (CNV) can be used to indicate neovascular AMD that accounts for the majority of AMD-related vision loss. Recently developed OCT-based microangiography (OMAG) is capable of detailed visualization and quantification of retinal microcirculation at capillary level resolution [4]. Currently fluorescein angiography (FA) and indocyanine green angiography (ICGA) are still the golden standard in visualizing functional retinal blood vessels. However, both FA and ICGA require invasive intravenous dye injection procedure that risks complications. In addition, they do not provide depth-resolved information of blood flows. OCT, on the other hand, provides noninvasive label-free imaging of retinal microcirculations in 3D.
OCT systems operating in 800 nm have been demonstrated to provide detailed morphological information and microvascular mapping in retina [5, 6]. However the investigation of deep posterior eye, such as choroid, is challenging due to the strong reflection and absorption of retinal pigment epithelium (RPE) and highly pigmented choroidal melanocytes. Considering the absorption and scattering properties of the eye, OCT system operating at 1 µm wavelength is preferred in the imaging of the complete posterior eye. There are several elegant studies of spectral domain OCT (SD-OCT) or swept source OCT (SS-OCT) systems operating at 1 µm wavelength for imaging the posterior eye. In the category of SS-OCT system, Klein et al. reports a megahertz OCT for ultrawide-field retinal imaging using a 1050nm Fourier domain mode-locked laser [7]. Choi et al. reports a 400 kHz A-scan rate system using vertical cavity surface emitting laser swept light source at 1060 nm wavelength [8]. These studies demonstrate unprecedented capabilities of deep posterior imaging, largely benefiting from the high speed of the swept light sources. However since the fact that SS-OCT for clinical use has yet to be approved by the FDA, its clinical translation is uncertain. Therefore its clinical impact is currently compromised. As a result, most of the current commercial ophthalmic OCT systems are based on SD-OCT configuration. In addition, several recent clinical studies that reveal important physiological information of the posterior eye are based on SD-OCT systems operating at 60 kHz A-scan rate [3, 9]. In the category of SD-OCT operating at 1 µm wavelength, Pova�ay et al. reported a SD-OCT system for choroid imaging at 47 kHz A-scan rate in 2009 [10], which provides the visualization of the complete posterior eye. Later Wang et al. demonstrated a 92 kHz A-scan rate SD-OCT system that not only provides structural information but also microcirculatory network visualization [11]. Recently SD-OCT system with faster speed at 120 kHz A-scan rate was reported by Lin et al. [12]. However blood vessel network imaging was not reported in this work.
In this paper we demonstrate a 147 kHz A-scan rate SD-OCT imaging system operating at 1050 nm by using a prototype InGaAs line scan camera. The uniqueness of this system is its capability of providing not only structural imaging of the complete posterior eye, but also the visualization of the retinal blood vessel network (as detailed below) with larger field of view and good image quality compared with former SD-OCT system [11, 12]. Multi-functional SD-OCT system operating at 1 µm wavelength at this speed of 147 kHz has not been reported before. Multi-functionality avoids the need for patients to switch among different machines, considerably saving patients’ visit time and cost. Furthermore, by examining different aspect of the posterior eye, the specificity and sensitivity of diagnosis can be increased. Higher speed on the other hand greatly reduces the measuring time and motion artifacts, which brings comfort to the patients and improves the image quality. The next section details the system configuration. Section 3 presents the in-vivo experiments using this SD-OCT system. The measurements of both normal and myopic eyes are discussed. The choroid in both cases can be clearly delineated. Then, the results of microcirculation network imaging in retina are presented.
2. System configuration
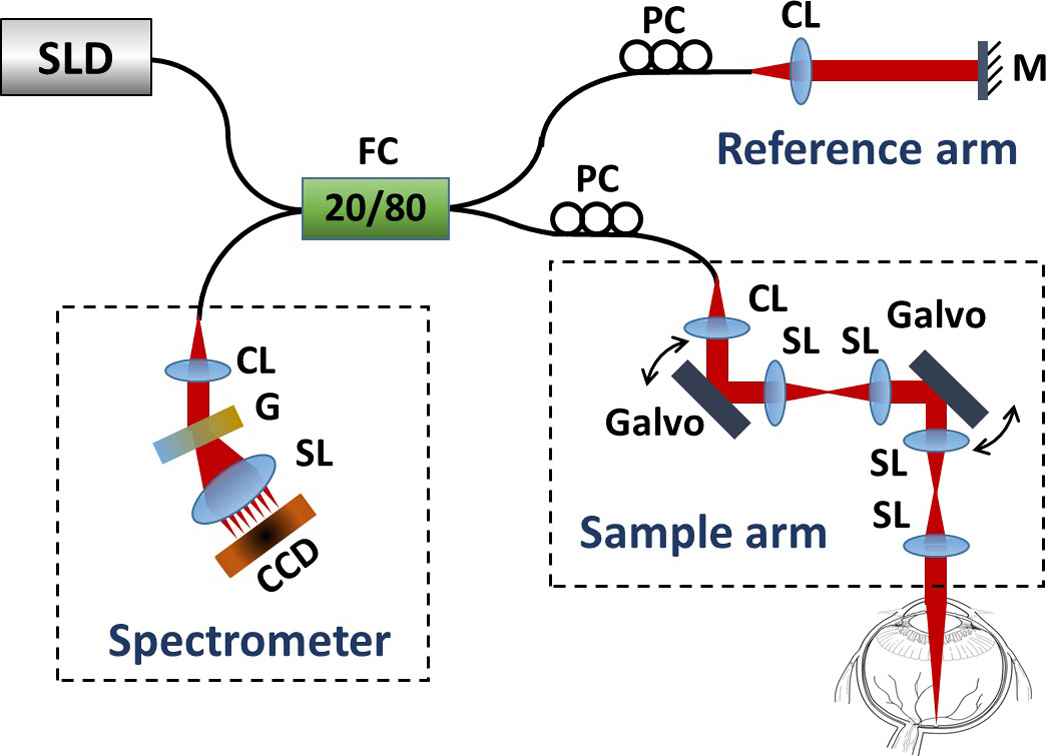
The schematic of our system is illustrated in Fig. 1, which has similar configuration to that reported in our previously work [12]. In brief, the system employed a 1050 nm ASE module (Amonics, ALS-1050 −20, China) as the light source, which has a central wavelength of 1050 nm with a spectral bandwidth of 50 nm, delivering ~20 mW output power and ~10 µm axial resolution in air. The output light from the source was coupled into a 20/80 fiber coupler and delivered into the sample arm and reference arm. In the sample arm, the light was coupled into a custom designed optical probe that consisted of a collimator, two 4f-systems and two galvanometers. Different scanning patterns were achieved by controlling the voltage forms delivered to the two galvanometers. Considering the optical system together with the crystalline lens of human eye, the estimated lateral resolution was ~15 µm at the retinal surface. In this system, different from our previous work [11, 12], the use of two 4f-systems in the sample arm greatly increases the 2D scanning range that can be achieved by x-y scanner. The interferogram formed between the lights backscattered from the human eye and the reference path was recorded via a home-built high speed spectrometer. As a major improvement in this work, a new InGaAs linescan camera (GL2048R, Sensors Unlimited Inc. (SUI), a United Technologies Aerospace Systems company, New Jersey, USA) capable of 147 kHz line-scan rate was employed in the spectrometer, which has 2048 pixels on 10 µm-pitch with an aperture height of 210 µm. Improved speed of 147 kHz as opposed to the prior 120 kHz [12] reduces subject motion artifact and enables blood flow network visualization in retina (as demonstrated in the next section). With camera working at 147 kHz, the measured system sensitivity was ~100 dB at the imaging depth of 0.6 mm below the zero delay line, with a ~7 dB falling off at the depth of 3.1 mm. The measured axial resolution was 12 µm in air at 0.6 mm imaging depth.
Figure 1.

Schematic of the 147 kHz spectral-domain OCT imaging system. CCD, line scan camera; CL, collimating lens; FC, fiber coupler; G, grating; Galvo, 1D galvanometer; M, mirror; PC, polarization controller; SL, scan lens.
3. In-vivo measurement
To better demonstrate the performance of posterior eye imaging using this newly developed system, we inspected imaging results acquired from posterior eyes pertaining to microstructures and retinal blood vessel network. For human study, the system was performed with ~1.8 mW light power at the cornea, well below the safe ocular exposure limits recommended by the American National Standards Institute (ANSI) [13]. For maximum subject’s comfort, the measurements were conducted in normal daylight condition without pupil dilation. The subject scanning using SD-OCT system was approved by the Institutional Review Board (IRB) of the University of Washington and consent form was obtained from each subject before examination.
3.1 Posterior eye structural imaging
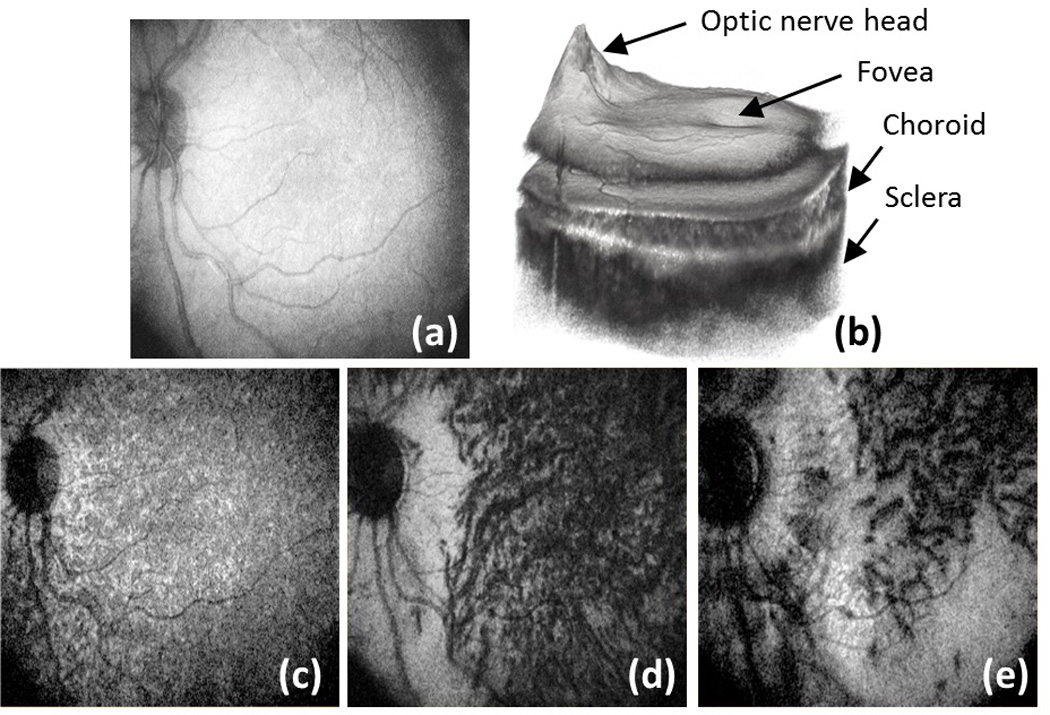
For posterior eye structural imaging, the scanning range is estimated to be 10*10mm at the retinal surface. Figures 2 (a)-(f) show the results of the posterior eye imaging of one human subject who has mild myopia (−3 diopters). Figure 2 (a) gives OCT-generated fundus image, obtained by integrating the whole 3D volumetric data along the depth direction. Compared this fundus image to the previous reported results in [11, 12], the scanning range is greatly increased. The darker areas at the four corners were caused by the imperfection of alignment during the experiment and limited pupil size. Figure 2 (b) illustrates the 3D volumetric rendering of the scanning data set. The features such as optic nerve head, fovea, choroid and sclera are clearly visible. Figures 2 (c) to (e) illustrate the en-face images at 30 µm, 100 µm and 300 µm depth below the RPE, respectively. Different sizes of blood vessels from different choroid layers (chorocapillaris layer, Sattler’s layer and Haller’s layer) can be visualized. The associated movie (Media 1) that shows en-face views flying through the posterior eye from the anterior retina to the sclera provides more detailed visualization of the microstructures at different depths. Compared with [11, 12], besides the larger field of view, this current system provides better depth penetration as more details in sclera are visualized.
Figure 2.

Posterior eye structural imaging: (a) OCT fundus image; (b) 3D volumetric rendering of whole data set; (c)–(e) depth resolved fundus images at 30, 100 and 300 µm below retinal pigment epithelium respectively. See also Media 1
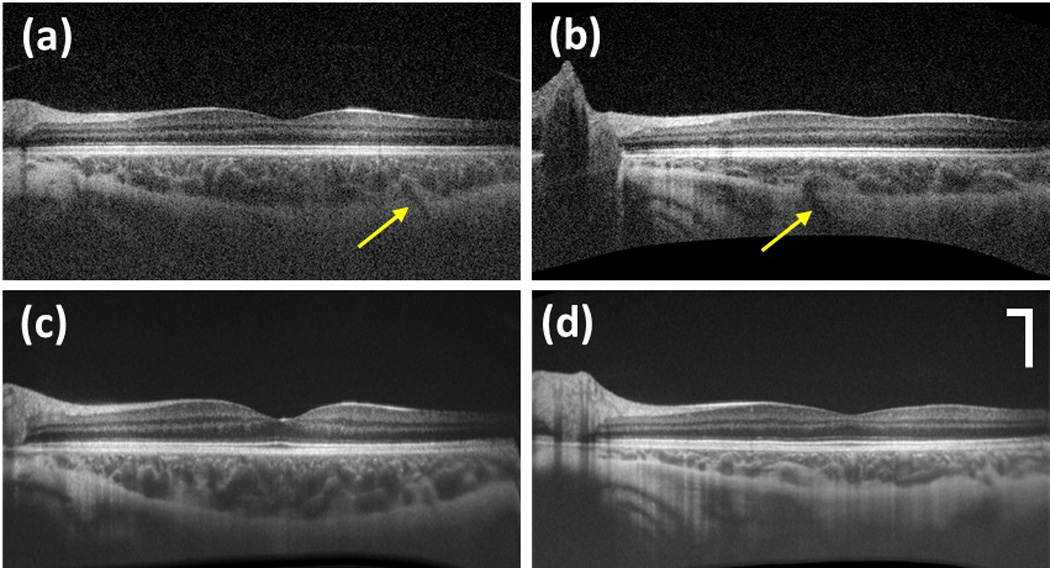
The change in choroid is an important pathological indicator. To further demonstrate the ability of this system for choroid imaging, another human subject with no identifiable myopic conditions (0 diopters) was imaged due to the fact that normal human eye tends to have thicker choroid [14]. The results are illustrated together with the case of mild myopia. Figures 3 (a) and (b) show one representative B-scan image in the 3D volumetric scanning for both cases, respectively. It is obvious that in both images, the choroidal posterior boundary can be clearly visualized. The result of the case with normal condition shows overall thicker choroid than the one in the case with mild myopia. Further indicated by the yellow arrow, the blood vessel that feeds through the sclera into the choroid can be clearly visualized in both cases. The corresponding movies (Media 2, Media 3) showing the volumetric scanning indicate that the choroidal-sclera boundary is visualized during the entire imaging volume. To check the quality of the averaged results, Figs 3 (c) and (d) illustrate the 12 times averaged B-scan images which were taken with galvo only scanning along the fast axis for both cases respectively. The difference in choroid of the two cases becomes more obvious.
Figure 3.

B-scan images during the 3D volumetric scan for eye with no myopia (a) and mild myopia (b); The 12 times averaged B-scan images at the same position of eye with no myopia (c) and mild myopia (d). The arrows in (a) and (b) indicate the blood vessels that feed the choroid through sclera. See also Media 2 for eye with no myopia and Media 3 for eye with mild myopia. Scale bar: 500 µm.
3.2 Blood vessel network in retina
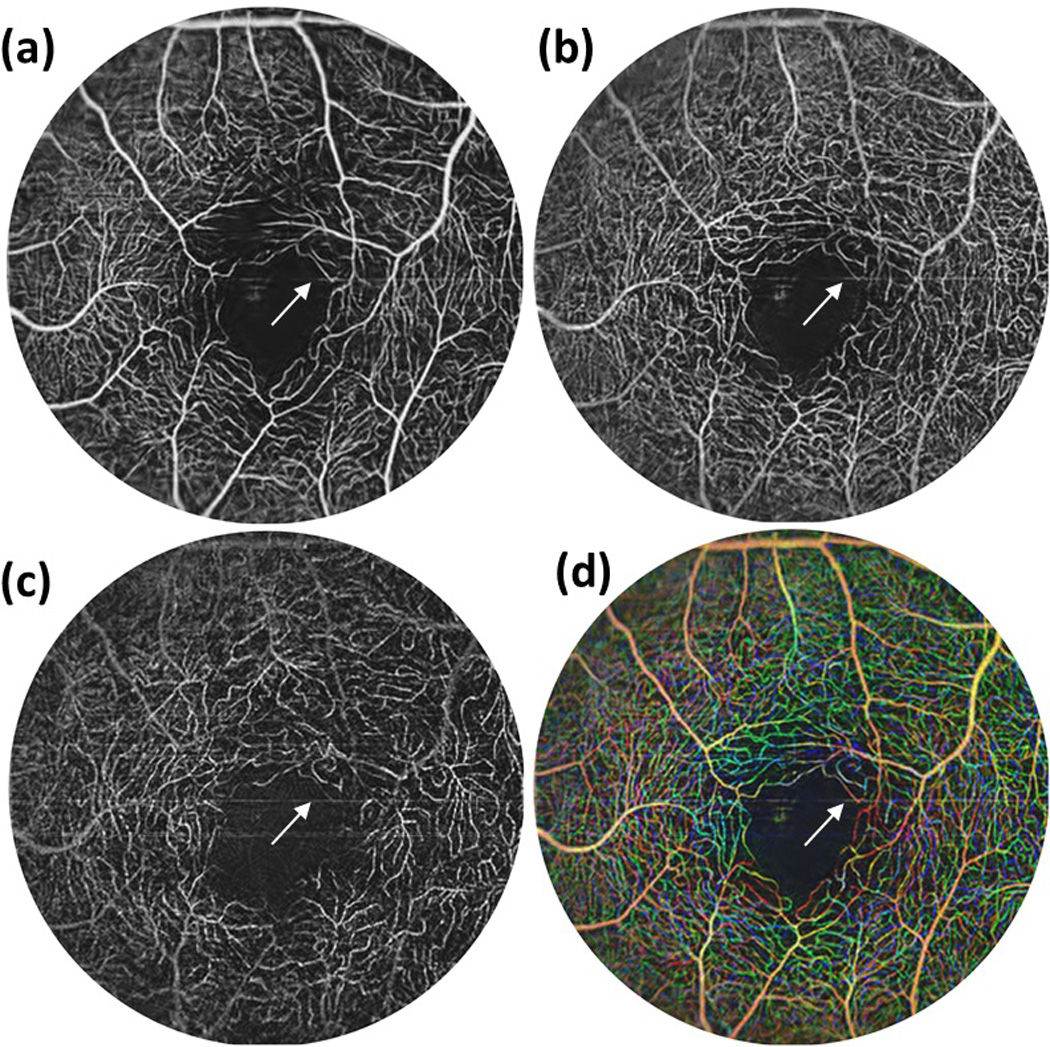
The visualization of blood vessel network is an important extension of traditional OCT imaging, providing invaluable information for disease diagnosis and prediction of disease progression. However due to the system instability and motion artifact of human subject, the blood vessel network imaging is not readily accessible. In this section, we demonstrate that this system is capable of visualizing the detailed retinal microcirculation network. In this demonstration, 400 A-scans were performed within each B-scan. By setting the duty cycle of faster axis scanning at ~80%, the system was operated at the B-scan imaging rate of 270 frames per second. For 3D data acquisition, the entire imaging volume was acquired at 400 steps (C-scan) covering ~ 4*4 mm scanning area, with four repeated B-scans in each step. It required ~6s to scan one entire 3D volume. After raw data were acquired, the blood vessel network was obtained using our ultrahigh sensitive OMAG algorithm [4]. Further we segmented the results into different retinal layers following the method proposed in [15]. Figures 4 (a)-(c) illustrate the vessel network in ganglion cell layer (GCL), inner plexiform layer (IPL) and outer plexiform layer (OPL), respectively. Figure 4 (d) shows the depth-resolved blood vessel network by overlaying the vessels in GCL (red), IPL (blue) and OPL (green). Compared with the results reported by other 1 µm system [11], these results are much clearer. Further when compared with the ones obtained by 800 nm system [16], these results show no compromised quality images by this 1 µm system which however has the advantage of better depth penetration. It should be noted that some big blood vessels have tailing effects, hence their color were the combination of red, blue and green according to its signal intensity at these layers respectively. The motion artifacts were visible as the horizontal line in these figures which were indicated by the blue arrows.
Figure 4.

Depth resolved retinal blood vessel network imaged by the 1 µm system from: (a) GCL layer; (b) IPL layer; (c) OPL layer. (d) Depth encoded visualization of the microvasculature located at different depths with red for (a), blue for (b) and green for (c). The blue arrows indicate the motion artifacts. Scale bar: 500 µm.
4. Conclusion
In this work, we have presented a multifunctional 147 kHz A-scan rate SD-OCT system operating at 1 µm wavelength range for posterior eye imaging. Demonstrated with experimental results, this current system not only provides better image quality in structural imaging when compared to other reported SD-OCT systems, but also gives depth-resolved visualization of detailed retinal microcirculation at capillary level resolution. These promising results encourage future clinical applications.
Supplementary Material
Acknowledgments
This work was supported in part by the National Eye Institute (R01EY024158), an unrestricted grant from Research to Prevent Blindness, and the Department of Bioengineering at the University of Washington.
References
- 1.Fujimoto JG, Pitris C, Boppart S, Brezinski M. Optical coherence tomography, an emerging technology for biomedical imaging and optical biopsy. Neoplasia. 2000;2:9–25. doi: 10.1038/sj.neo.7900071. [DOI] [PMC free article] [PubMed] [Google Scholar]
- 2.Hee MR, Puliafito CA, Duker JS, Reichel E, Coker JG, Wilkins JR, Schuman JS, Swanson EA, Fujimoto JG. Topography of diabetic macular edema with optical coherence tomography. Ophthalmology. 1998;105(2):360–370. doi: 10.1016/s0161-6420(98)93601-6. [DOI] [PMC free article] [PubMed] [Google Scholar]
- 3.Esmaeelpour M, Ansari-Shahrezaei S, Glittenberg C, Nemetz S, Kraus MF, Hornegger J, Fujimoto JG, Drexler W, Binder S. Choroid, Haller's, and Sattler's layer thickness in intermediate age-related macular degeneration with and without fellow neovascular eyes. Invest Ophthalmol Vis Sci. 2014;55(8):5074–5080. doi: 10.1167/iovs.14-14646. [DOI] [PMC free article] [PubMed] [Google Scholar]
- 4.An L, Qin J, Wang RK. Ultrahigh sensitive optical microangiography for in vivo imaging of microcirculations within human skin tissue beds. Opt. Express. 2010;18:8220–8228. doi: 10.1364/OE.18.008220. [DOI] [PMC free article] [PubMed] [Google Scholar]
- 5.Fernández EJ, Hermann B, Považay B, Unterhuber A, Sattmann H, Hofer B, Ahnelt PK, Drexler W. Ultrahigh resolution optical coherence tomography and pancorrection for cellular imaging of the living human retina. Opt. Express. 2008;16:11083–11094. doi: 10.1364/oe.16.011083. [DOI] [PubMed] [Google Scholar]
- 6.Flores-Moreno I, Lugo F, Duker JS, Ruiz-Moreno JM. The relationship between axial length and choroidal thickness in eyes with high myopia. Am J Ophthalmol. 2013;155(2):314–319. doi: 10.1016/j.ajo.2012.07.015. [DOI] [PubMed] [Google Scholar]
- 7.Klein T, Wieser W, Eigenwillig CM, Biedermann BR, Huber R. Megahertz OCT for ultrawide-field retinal imaging with a 1050nm Fourier domain mode-locked laser. Opt. Express. 2011;19:3044–3062. doi: 10.1364/OE.19.003044. [DOI] [PubMed] [Google Scholar]
- 8.Choi W, Mohler KJ, Potsaid B, Lu CD, Liu JJ, Jayaraman V, Cable AE, Duker JS, Huber R, Fujimoto JG. Choriocapillaris and Choroidal Microvasculature Imaging with Ultrahigh Speed OCT Angiography. PLOS ONE. 2013;8:e81499. doi: 10.1371/journal.pone.0081499. [DOI] [PMC free article] [PubMed] [Google Scholar]
- 9.Haas P, Esmaeelpour M, Ansari-Shahrezaei S, Drexler W, Binder S. Choroidal thickness in patients with reticular pseudodrusen using 3D 1060-nm OCT maps. Invest Ophthalmol Vis Sci. 2014;55(4):2674–2681. doi: 10.1167/iovs.13-13338. [DOI] [PMC free article] [PubMed] [Google Scholar]
- 10.Povazay B, Hermann B, Hofer B, Kajić V, Simpson E, Bridgford T, Drexler W. Wide-field optical coherence tomography of the choroid in vivo. Invest Ophthalmol Vis Sci. 2009;50(4):1856–1863. doi: 10.1167/iovs.08-2869. [DOI] [PubMed] [Google Scholar]
- 11.Wang RK, An L. Multifunctional imaging of human retina and choroid with 1050-nm spectral domain optical coherence tomography at 92-kHz line scan rate. J Biomed Opt. 2011;16(5):050503. doi: 10.1117/1.3582159. [DOI] [PMC free article] [PubMed] [Google Scholar]
- 12.An L, Li P, Lan G, Malchow D, Wang RK. High-resolution 1050 nm spectral domain retinal optical coherence tomography at 120 kHz A-scan rate with 6.1 mm imaging depth. Opt Express. 2013;4(2):245–259. doi: 10.1364/BOE.4.000245. [DOI] [PMC free article] [PubMed] [Google Scholar]
- 13.American National Standard Institute. Safe use of lasers and safe use of optical fiber communications. New York: ANSI; 2000. p. 168. [Google Scholar]
- 14.Flores-Moreno I, Lugo F, Duker JS, Ruiz-Moreno JM. The relationship between axial length and choroidal thickness in eyes with high myopia. Am J Ophthalmol. 2013;155(2):314–319. doi: 10.1016/j.ajo.2012.07.015. [DOI] [PubMed] [Google Scholar]
- 15.Yin X, Chao J, Wang RK. User-guided segmentation for volumetric retinal optical coherence tomography images. Journal of Biomedical Optics. 2014;19(8):086020. doi: 10.1117/1.JBO.19.8.086020. [DOI] [PMC free article] [PubMed] [Google Scholar]
- 16.An L, Shen TT, Wang RK. Using ultrahigh sensitive optical microangiography to achieve comprehensive depth resolved microvasculature mapping for human retina. J Biomed Opt. 2011;16(10):106013. doi: 10.1117/1.3642638. [DOI] [PMC free article] [PubMed] [Google Scholar]
Associated Data
This section collects any data citations, data availability statements, or supplementary materials included in this article.


