Abstract
Objective
Estimation of the glomerular filtration rate (GFR) is essential for identification, evaluation and risk prediction in patients with kidney disease. Estimated GFR (eGFR) is also needed for the correct dosing of drugs eliminated by the kidneys and to identify high-risk individuals in whom coronary angiography or other procedures may lead to kidney failure. Both cystatin C and creatinine are used for the determination of GFR, and we aimed to investigate if eGFR by the two methods differ in cardiology patients.
Methods
We compared cystatin C and creatinine (CKD-EPI) eGFR calculated from the same request from a cardiology outpatient unit (n = 2,716), a cardiology ward (n = 980), a coronary care unit (n = 1,464), and an advanced coronary care unit (n = 518) in an observational, cross-sectional study.
Results
The median creatinine eGFR results are approximately 10 ml/min/1.73 m2 higher than the median cystatin C eGFR that is up to 90 ml/min/1.73 m2, irrespective of the level of care. Creatinine eGFR resulted in a less advanced eGFR category in the majority of patients with a cystatin C eGFR <60 ml/min/1.73 m2.
Conclusions
Our study demonstrates a difference between creatinine and cystatin C eGFR in cardiology patients. It is important to be aware of which marker is used for the reported eGFR to minimize erroneous interpretations of the test results, as this could lead to under- or overmedication. Further studies are needed to determine the best method of estimating the GFR in cardiology units.
Key Words: Cystatin C, Creatinine, Glomerular filtration rate, Heart, Kidney, CKD-EPI, Sweden
Introduction
Decreased renal function often accompanies congestive heart failure, and this interdependent relationship has become known as the cardiorenal syndrome [1,2,3]. Studies have documented a strong association between chronic kidney disease (CKD) and cardiovascular disease (CVD) morbidity and mortality [4,5]. Cardiovascular mortality is 10-20 times more frequent in renal failure patients [6], and over 40% of the deaths in patients with end-stage renal disease are due to CVD [7]. A meta-analysis showed that patients with end-stage renal disease are more likely to die from CVD [8]. Even a mildly to moderately decreased renal function leads to a significantly increased CVD morbidity and mortality [9,10,11,12,13].
Estimated glomerular filtration rate (eGFR) is used for the diagnosis, staging, and prognosis of kidney disease, but is also an important part of drug dosing and risk stratification for clinical procedures and future outcomes. Assessment of kidney damage and dysfunction is thus an integral component of clinical medicine, endorsed by international guidelines [14,15]. eGFR is usually calculated from plasma creatinine values using Modification of Diet in Renal Disease [16] or CKD-EPI [17] equations. Cystatin C has been shown to be a valuable eGFR marker, and cystatin C has also been reported to be a better marker than creatinine for mortality predictions [18].
A problem with both cystatin C and creatinine equations is that they are developed based on the measurement of GFR using exogenous markers in patients with known or suspected kidney disorders. An equation based on one patient population does not necessarily have to be accurate in other populations [19]. Considering the role of creatinine and cystatin C as GFR markers, the aim was to compare eGFR based on the two markers in different patient populations with the common feature of cardiac disease. We thus compared the creatinine-based eGFR utilizing the CKD-EPI equation with the cystatin C-based eGFR using the new CAPA (Caucasian, Asian, pediatric, adult) equation in patient populations treated at an outpatient cardiology clinic, a general cardiology ward, a cardiology care unit (CCU), and an acute coronary care unit (ACCU). Only samples with simultaneous requests for both creatinine and cystatin C were included in the study. The eGFR equations were originally constructed using patients younger than many of those seeking health care. We thus also wanted to study possible differences between creatinine and cystatin C eGFR in relation to patient age in different groups of cardiology patients.
Methods
Study Population
The comparison was performed with consecutive routine requests for creatinine and cystatin C at the Department of Clinical Chemistry, Uppsala University Hospital, Uppsala, Sweden, between 2011 and 2012. Only samples with requests for both analytes were extracted from the database, and only the first result for each patient was included in the study. The comparisons were limited to samples from a general cardiology outpatient unit, a general cardiology ward with mainly arrhythmia and heart failure patients, a CCU (predominantly patients with acute coronary syndromes), and an ACCU with mainly patients requiring postoperative and intensive care.
Creatinine and Cystatin C Assays
Plasma creatinine was measured by an enzymatic method on an Architect Ci8200 analyzer (Abbott Laboratories, Abbott Park, Ill., USA) and reported using SI units (µmol/l). The method is Isotope Dilution Mass Spectrometry (IDMS) calibrated in collaboration with the Swedish external quality assurance organization (Equalis, Uppsala, Sweden). The total analytical imprecision of the creatinine method was 0.7% at 75 µmol/l and 0.9% at 346 µmol/l. eGFRCKD-EPI was calculated from creatinine using the CKD-EPI formula [17].
Serum cystatin C measurements were performed on an Architect Ci8200 with reagents from Gentian (Moss, Norway). The total analytical imprecision of the cystatin C method was 1.7% at 0.77 mg/l and 1.1% at 1.25 mg/l. The cystatin C method used was calibrated according to the new certified reference material ERM-DA471/IFCC [20].
The CAPA equation was used for calculating cystatin C eGFR: eGFRCystC = 130 × cystatin C−1.069 × age- 0.117 – 7 [21].
Statistical Calculations
Descriptive statistics, linear regression analysis, and figures were made utilizing Excel 2000 (Microsoft Corporation, Seattle, Wash., USA). The GFR partitioning was based on the cystatin C eGFR. Samples with cystatin C eGFR values >150 ml/min/1.73 m2 were excluded from the statistical analysis.
Results
The creatinine and cystatin C samples from the cardiology outpatient unit [n = 2,716; 905 females and 1,807 males; median age 67 years (range 18-95)], the cardiology ward [n = 980; 363 females and 617 males; median age 67 years (range 18-94)], the CCU [n = 1,464; 469 females and 995 males; median age 67 years (range 18-99)], and the ACCU [n = 518; 158 females and 360 males; median age 66 years (range 18-89)] were analyzed between 2011 and 2012.
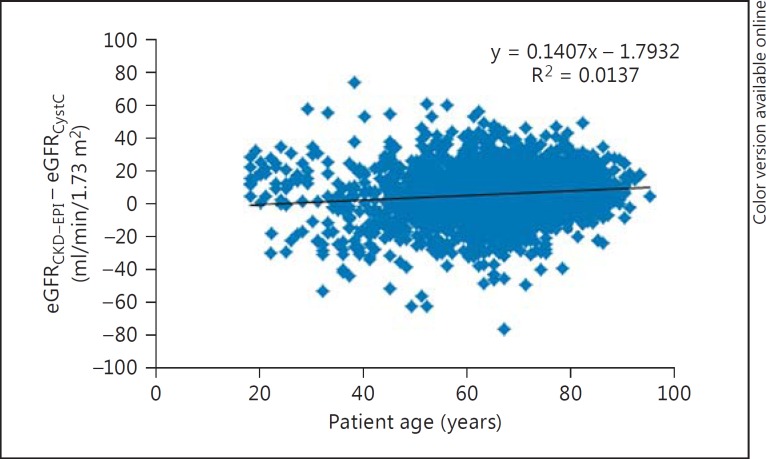
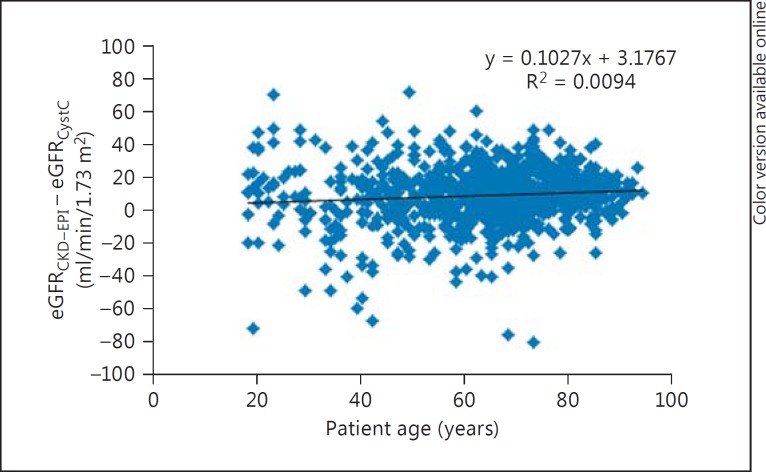
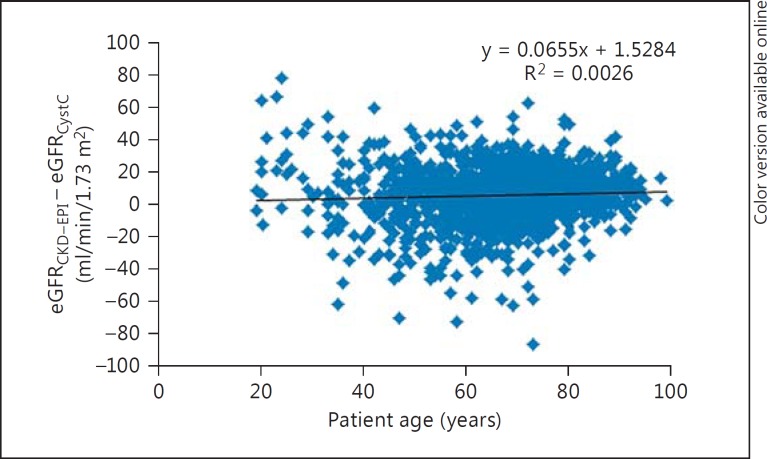
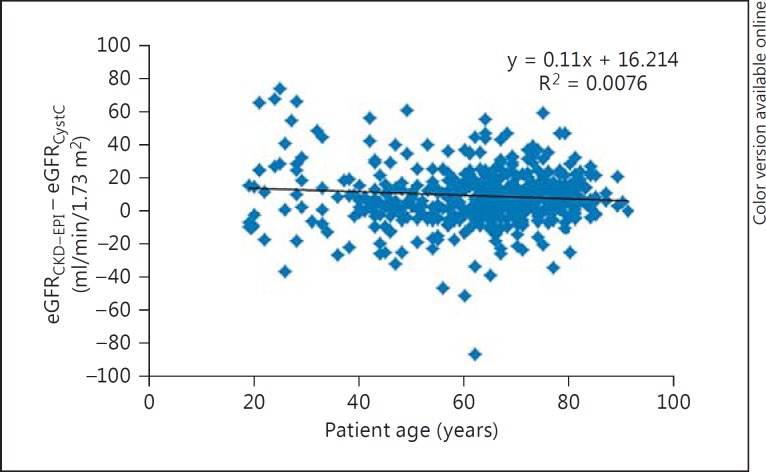
The differences between eGFR by eGFRCKD-EPI and eGFRCystC per subgroups of eGFRCystC are reported in table 1. eGFRCKD-EPI values were approximately 10 ml/min/1.73 m2 higher than eGFRCystC, which were up to 90 ml/min/1.73 m2, with small differences in the median eGFR over 90 ml/min/1.73 m2. Age variation had limited effects on the difference between eGFRCKD-EPI and eGFRCystC in the different subgroups (fig. 1, 2, 3, 4).
Table 1.
The difference between eGFRCKD-EPI and eGFRCystC in the GFR intervals <30, 30–59, 60–89, and ≥90 ml/min/1.73 m2
| <30 | 30–59 | 60–89 | ≥90 | |
|---|---|---|---|---|
| Outpatient cohort | ||||
| Median eGFRCKD-EPI | 34 | 60 | 82 | 95 |
| Median eGFRCystC | 23 | 48 | 73 | 100 |
| eGFR difference | 11 | 12 | 9 | −5 |
| n (%) | 190 (7.0) | 886 (32.7) | 1,188 (43.9) | 443 (16.4) |
| Cardiology ward | ||||
| Median eGFRCKD-EPI | 35 | 60 | 84 | 102 |
| Median eGFRCystC | 22 | 44 | 74 | 101 |
| eGFR difference | 13 | 16 | 10 | 1 |
| n (%) | 146 (15.0) | 329 (33.9) | 329 (33.9) | 167 (17.2) |
| CCU | ||||
| Median eGFRCKD-EPI | 30 | 59 | 85 | 96 |
| Median eGFRCystC | 21 | 47 | 75 | 102 |
| eGFR difference | 9 | 12 | 10 | −6 |
| n (%) | 146 (10.0) | 388 (26.7) | 565 (38.8) | 356 (24.5) |
| ACCU | ||||
| Median eGFRCKD-EPI | 26 | 52 | 84 | 103 |
| Median eGFRCystC | 21 | 41 | 72 | 103 |
| eGFR difference | 5 | 11 | 12 | 0 |
| n (%) | 146 (28.2) | 201 (38.9) | 108 (20.9) | 62 (12.0) |
The patients are divided into the eGFR groups according to cystatin C eGFR.
Fig. 1.
Plot showing patient age (x-axis) versus the difference between eGFRCKD-EPI and eGFRCystC (y-axis) in individual patient samples from the cardiology outpatient clinic.
Fig. 2.
Plot showing patient age (x-axis) versus the difference between eGFRCKD-EPI and eGFRCystC (y-axis) in individual patient samples from the cardiology ward.
Fig. 3.
Plot showing patient age (x-axis) versus the difference between eGFRCKD-EPI and eGFRCystC (y-axis) in individual patient samples from the CCU.
Fig. 4.
Plot showing patient age (x-axis) versus the difference between eGFRCKD-EPI and eGFRCystC (y-axis) in individual patient samples from the ACCU.
Comparison of CKD Staging Based on eGFRCKD-EPI and eGFRCystC
In the patient groups with aneGFRCystC <30 ml/min/1.73 m2, 69.5% (cardiology outpatient unit), 63.7% (cardiology ward), 50.0% (CCU), and 36.3% (ACCU) of the patients were reclassified to a less advanced GFR category when using eGFRCKD-EPI (table 2). Out of the patients with an eGFRCystC of 30-44 ml/min/1.73 m2, 71.3% were reclassified to a less advanced eGFR category, and 1.5% were reclassified to a lower group by eGFRCKD-EPI in the outpatient unit. The corresponding figures for the cardiology ward were 78.9 and 1.8%, for the CCU 62.1 and 1.8%, and for the ACCU 48.4 and 7.1%. The percentages of reclassified patients with eGFRCystC 45-59 ml/min/1.73 m2 were 70.1 and 3.5% in the outpatient unit, 75.3 and 1.9% in the cardiac ward, 66.2 and 5.9% in the CCU, and 60.0 and 9.3% in the ACCU.
Table 2.
Reclassification of patients when using eGFRCKD-EPI instead of eGFRCystC
| eGFRCystC | eGFRCKD-EPI, n |
|||
|---|---|---|---|---|
| <30 | 30–44 | 45–59 | >60 | |
| Outpatient unit | ||||
| <30 (190) | 58 | 93 | 34 | 5 |
| 30-<45 (341) | 5 | 93 | 165 | 78 |
| 45-<60 (545) | 0 | 19 | 144 | 382 |
| »60 (1,628) | 0 | 2 | 69 | 1,557 |
| Cardiology ward | ||||
| <30 (146) | 53 | 59 | 26 | 8 |
| 30-<45 (171) | 3 | 33 | 89 | 46 |
| 45-<60 (158) | 0 | 3 | 36 | 119 |
| »60 (496) | 0 | 0 | 18 | 478 |
| CCU | ||||
| <30 (146) | 73 | 48 | 21 | 4 |
| 30-<45 (169) | 3 | 61 | 67 | 38 |
| 45-<60 (219) | 1 | 12 | 61 | 145 |
| »60 (921) | 0 | 2 | 16 | 903 |
| ACCU | ||||
| <30 (146) | 93 | 40 | 10 | 3 |
| 30-<45 (126) | 9 | 56 | 39 | 22 |
| 45-<60 (75) | 0 | 7 | 23 | 45 |
| »60 (170) | 1 | 1 | 11 | 157 |
The number of the patients classified in GFR strata by cystatin C and the CKD-EPI classification of the same patients. eGFR values are ml/min/1.73 m2.
Discussion
CKD is a growing global health problem. The incidence of CKD is expected to continue to rise in the future, partly due to an increased number of patients with diabetic nephropathy as a consequence of increased age and obesity [22]. Improvements in the detection and risk stratification of CKD patients are crucial, and we expect the classification of CKD by eGFR to remain important. It is seldom possible to measure GFR in real-life patient settings with an exogenous GFR marker. Thus, we will continue to rely on inexpensive endogenous GFR markers such as creatinine and cystatin C. We usually classify patients according to eGFR and do not distinguish between the molecules used for the measurements. Basically, we assume all GFR markers to give the same results, and this would be highly desirable. However, as the eGFR equations are calibrated against measured GFR, they are highly influenced by the population that they are derived from. When we use the same equations in other patient groups with other features, consequently the results may differ. Ethnical differences in creatinine eGFR are often addressed, and there are several ethnicity-specific equations or factors [16,17,23,24]. In contrast, there is limited discussion on the differences between patient groups within a hospital.
Considering the importance of eGFR, we compared cystatin C and creatinine eGFR in different groups of cardiology patients. We used cystatin C eGFR to divide the patients into different GFR strata in accordance with the CKD classification [25]. There are no GFR measurements with iohexol, iothalamate or chromium-51-EDTA in this study, so we do not have the true GFR for the patients. Nevertheless, our study demonstrates a clear difference between creatinine and cystatin C eGFR in cardiology patients. The difference between the two measurements is fairly consistent in patients treated at the different cardiology units. The median creatinine eGFR results were approximately 10 ml/min/1.73 m2 higher than the median cystatin C eGFR, which was up to 90 ml/min/1.73 m2. This bias is not negligible. If we use important clinical decision limits such as 15, 30, 45, and 60 ml/min/1.73 m2, a large number of patients will be reclassified depending on which GFR marker is used.
This finding is important and needs to be stressed, as treatment strategies cannot be accepted to be dependent on the marker used for defining the eGFR of the individual patient. We thus recommend that different decision limits for the cystatin C- and creatinine-based eGFR for CVD risk estimation should be considered. The different cardiology units showed similar differences, indicating that the same decision limits could be used in the different units.
Limitations
Our results are based on a large, single-center, tertiary care hospital, and hence they may not be reproducible in other regions and countries due to biochemical or analytical differences. The new CAPA equation is based on methods calibrated with the recently developed ERM-DA471/IFCC reference material. CAPA is an assay-independent cystatin C-based estimating equation for GFR using 7 different cystatin C assays. This equation is validated in a North European/Asian community setting and may not be applicable in other regions.
The patients admitted to a cardiology outpatient clinic or cardiology ward may not always end up with a cardiology diagnosis. We did not scrutinize patient diagnoses, but rather decided to include all patients with a cardiology affiliation who had dually requested creatinine and cystatin C measurements.
Creatinine and cystatin C may differ in regard to the time of sampling. Cystatin C reacts 1-2 days earlier to acute renal failure, a condition that may occur in hospitalized patients. Thus, the difference observed in this study could partly be due to the early response of cystatin C to acute renal failure [26].
Conclusion
Our study demonstrates a difference between creatinine and cystatin C eGFR in cardiology patients. It is important to be aware of which marker is used for the reported eGFR to minimize erroneous interpretations of test results, as this could lead to under- or overmedication. Further studies are needed to determine the best method of estimating GFR in cardiology units.
Disclosure Statement
The study was investigator initiated and investigator driven. A.Å. received institutional grants from AstraZeneca. The other authors declare that they have no conflicts of interest.
Acknowledgement
This study was supported by the Uppsala University Hospital Research Fund.
References
- 1.Ronco C, Di LL. Cardiorenal syndrome. Heart Fail Clin. 2014;10:251–280. doi: 10.1016/j.hfc.2013.12.003. [DOI] [PubMed] [Google Scholar]
- 2.Virzi G, Day S, de Cal M, et al. Heart-kidney crosstalk and role of humoral signaling in critical illness. Crit Care. 2014;18:201. doi: 10.1186/cc13177. [DOI] [PMC free article] [PubMed] [Google Scholar]
- 3.Braam B, Joles JA, Danishwar AH, Gaillard CA. Cardiorenal syndrome – current understanding and future perspectives. Nat Rev Nephrol. 2014;10:48–55. doi: 10.1038/nrneph.2013.250. [DOI] [PubMed] [Google Scholar]
- 4.Weiner DE, Tighiouart H, Amin MG, et al. Chronic kidney disease as a risk factor for cardiovascular disease and all-cause mortality: a pooled analysis of community-based studies. J Am Soc Nephrol. 2004;15:1307–1315. doi: 10.1097/01.asn.0000123691.46138.e2. [DOI] [PubMed] [Google Scholar]
- 5.McCullough PA, Verrill TA. Cardiorenal interaction: appropriate treatment of cardiovascular risk factors to improve outcomes in chronic kidney disease. Postgrad Med. 2010;122:25–34. doi: 10.3810/pgm.2010.03.2119. [DOI] [PubMed] [Google Scholar]
- 6.Raine AE, Margreiter R, Brunner FP, et al. Report on management of renal failure in Europe, XXII, 1991. Nephrol Dial Transplant. 1992;7(suppl 2):7–35. [PubMed] [Google Scholar]
- 7.Moody WE, Edwards NC, Chue CD, et al. Arterial disease in chronic kidney disease. Heart. 2013;99:365–372. doi: 10.1136/heartjnl-2012-302818. [DOI] [PubMed] [Google Scholar]
- 8.Sarnak MJ, Levey AS, Schoolwerth AC, et al. Kidney disease as a risk factor for development of cardiovascular disease: a statement from the American Heart Association Councils on Kidney in Cardiovascular Disease, High Blood Pressure Research, Clinical Cardiology, and Epidemiology and Prevention. Circulation. 2003;108:2154–2169. doi: 10.1161/01.CIR.0000095676.90936.80. [DOI] [PubMed] [Google Scholar]
- 9.Jernberg T, Lindahl B, James S, et al. Cystatin C: a novel predictor of outcome in suspected or confirmed non-ST-elevation acute coronary syndrome. Circulation. 2004;110:2342–2348. doi: 10.1161/01.CIR.0000145166.44942.E0. [DOI] [PubMed] [Google Scholar]
- 10.Nerpin E, Ingelsson E, Riserus U, et al. The combined contribution of albuminuria and glomerular filtration rate to the prediction of cardiovascular mortality in elderly men. Nephrol Dial Transplant. 2011;26:2820–2827. doi: 10.1093/ndt/gfq848. [DOI] [PubMed] [Google Scholar]
- 11.Nitsch D, Grams M, Sang Y, et al. Associations of estimated glomerular filtration rate and albuminuria with mortality and renal failure by sex: a meta-analysis. BMJ. 2013;346:f324. doi: 10.1136/bmj.f324. [DOI] [PMC free article] [PubMed] [Google Scholar]
- 12.Hallan SI, Matsushita K, Sang Y, et al. Age and association of kidney measures with mortality and end-stage renal disease. JAMA. 2012;308:2349–2360. doi: 10.1001/jama.2012.16817. [DOI] [PMC free article] [PubMed] [Google Scholar]
- 13.Mahmoodi BK, Matsushita K, Woodward M, et al. Associations of kidney disease measures with mortality and end-stage renal disease in individuals with and without hypertension: a meta-analysis. Lancet. 2012;380:1649–1661. doi: 10.1016/S0140-6736(12)61272-0. [DOI] [PMC free article] [PubMed] [Google Scholar]
- 14.Fox KA, Goodman SG, Anderson FA, Jr, et al. From guidelines to clinical practice: the impact of hospital and geographical characteristics on temporal trends in the management of acute coronary syndromes. The Global Registry of Acute Coronary Events (GRACE) Eur Heart J. 2003;24:1414–1424. doi: 10.1016/s0195-668x(03)00315-4. [DOI] [PubMed] [Google Scholar]
- 15.Anderson JL, Adams CD, Antman EM, et al. 2012 ACCF/AHA focused update incorporated into the ACCF/AHA 2007 guidelines for the management of patients with unstable angina/non-ST-elevation myocardial infarction: a report of the American College of Cardiology Foundation/American Heart Association Task Force on Practice Guidelines. J Am Coll Cardiol. 2013;61:e179–e347. doi: 10.1016/j.jacc.2013.01.014. [DOI] [PubMed] [Google Scholar]
- 16.Levey AS, Coresh J, Greene T, et al. Expressing the Modification of Diet in Renal Disease Study equation for estimating glomerular filtration rate with standardized serum creatinine values. Clin Chem. 2007;53:766–772. doi: 10.1373/clinchem.2006.077180. [DOI] [PubMed] [Google Scholar]
- 17.Levey AS, Stevens LA, Schmid CH, et al. A new equation to estimate glomerular filtration rate. Ann Intern Med. 2009;150:604–612. doi: 10.7326/0003-4819-150-9-200905050-00006. [DOI] [PMC free article] [PubMed] [Google Scholar]
- 18.Shlipak MG, Matsushita K, Arnlov J, et al. Cystatin C versus creatinine in determining risk based on kidney function. N Engl J Med. 2013;369:932–943. doi: 10.1056/NEJMoa1214234. [DOI] [PMC free article] [PubMed] [Google Scholar]
- 19.Larsson A, Flodin M, Hansson LO, Carlsson L. Patient selection has a strong impact on cystatin C and Modification of Diet in Renal Disease (MDRD) estimated glomerular filtration rate. Clin Biochem. 2008;41:1355–1361. doi: 10.1016/j.clinbiochem.2008.07.003. [DOI] [PubMed] [Google Scholar]
- 20.Grubb A, Blirup-Jensen S, Lindstrom V, et al. First certified reference material for cystatin C in human serum ERM-DA471/IFCC. Clin Chem Lab Med. 2010;48:1619–1621. doi: 10.1515/CCLM.2010.318. [DOI] [PubMed] [Google Scholar]
- 21.Grubb A, Horio M, Hansson LO, Bjork J, Nyman U, Flodin M, et al. Generation of a new cystatin C-based estimating equation for glomerular filtration rate by use of 7 assays standardized to the international calibrator. Clin Chem. 2014;60:974–986. doi: 10.1373/clinchem.2013.220707. [DOI] [PubMed] [Google Scholar]
- 22.National Kidney Foundation KDOQI clinical practice guideline for diabetes and CKD: 2012 update. Am J Kidney Dis. 2012;60:850–886. doi: 10.1053/j.ajkd.2012.07.005. [DOI] [PubMed] [Google Scholar]
- 23.Matsuo S, Imai E, Horio M, et al. Revised equations for estimated GFR from serum creatinine in Japan. Am J Kidney Dis. 2009;53:982–992. doi: 10.1053/j.ajkd.2008.12.034. [DOI] [PubMed] [Google Scholar]
- 24.Björk J, Grubb A, Sterner G, Nyman U. Revised equations for estimating glomerular filtration rate based on the Lund-Malmo Study cohort. Scand J Clin Lab Invest. 2011;71:232–239. doi: 10.3109/00365513.2011.557086. [DOI] [PubMed] [Google Scholar]
- 25.National Kidney Foundation KDOQI clinical practice guidelines for chronic kidney disease: evaluation, classification, and stratification. Am J Kidney Dis. 2002;39:S1–S266. [PubMed] [Google Scholar]
- 26.Herget-Rosenthal S, Marggraf G, Hüsing J, Göring F, Pietruck F, Janssen O, et al. Early detection of acute renal failure by serum cystatin C. Kidney Int. 2004;66:1115–1122. doi: 10.1111/j.1523-1755.2004.00861.x. [DOI] [PubMed] [Google Scholar]


