

Abstract
The genes of the major histocompatibility complex (MHC) code for proteins involved in antigen recognition and activation of the adaptive immune response and are thought to be regulated by natural selection, especially due to pathogen‐driven selective pressure. In this study, we investigated the spatial distribution of MHC class II DRB exon 2 gene diversity of the lesser anteater (Tamandua tetradactyla) across five Brazilian biomes using next‐generation sequencing and compared the MHC pattern with that of neutral markers (microsatellites). We found a noticeable high level of diversity in DRB (60 amino acid alleles in 65 individuals) and clear signatures of historical positive selection acting on this gene. Higher allelic richness and proportion of private alleles were found in rain forest biomes, especially Amazon forest, a megadiverse biome, possibly harboring greater pathogen richness as well. Neutral markers, however, showed a similar pattern to DRB, demonstrating the strength of demography as an additional force to pathogen‐driven selection in shaping MHC diversity and structure. This is the first characterization and description of diversity of a MHC gene for any member of the magna‐order Xenarthra, one of the basal lineages of placental mammals.
Keywords: Brazil, DRB, major histocompatibility complex, microsatellites, next‐generation sequencing, selection, Tamandua tetradactyla
Introduction
The major histocompatibility complex (MHC) is one of the most important immunogenic systems for infectious disease resistance in vertebrates (Hedrick and Kim 2000). As these genes are highly variable and are thought to play an essential role in the adaptive immune response of vertebrates, they can be useful for investigating the role of natural selection on genetic diversity in wild populations (Bernatchez and Landry 2003).
It has been proposed that pathogen‐mediated selection (PMS) is one of the main driving forces maintaining diversity at MHC loci (Doherty and Zinkernagel 1975; Apanius et al. 1997; Jeffery and Bangham 2000; Bernatchez and Landry 2003) and several hypotheses explaining PMS have been suggested as follows: heterozygote advantage (Doherty and Zinkernagel 1975), rare allele advantage (Slade and McCallum 1992), and fluctuating selection (Hill 1991). All three mechanisms, or a combination of the three, could be the driver of MHC diversity (Hughes and Nei 1988; Takahata and Nei 1990; Apanius et al. 1997). As MHC is known to respond to PMS, the factors that drive pathogen diversity in different environments could also represent important causal predictors for MHC diversity. In fact, contrasting local immunogenetic adaptations of hosts that inhabit habitats with different parasite and pathogen pressure have been reported (e.g., Eizaguirre & Lenz 2010; Lenz et al. 2013; Froeschke and Sommer 2014; Sommer et al. 2014).
Environmental conditions play an important regulating role in the distribution, transmission, and developmental success of parasites and pathogens. Meteorological parameters can influence both the parasite species richness and the intensity of infection in the host species (Mas‐Coma 2008). While temperature is known to be able to increase parasite development rates (Kutz et al. 2005; Hudson 2006), annual precipitation, humidity, and rainfall are important factors explaining diversity of many groups of pathogens, such as bacteria, viruses, fungi, protozoa, and helminths (Appleton and Gouws 1996; Guernier et al. 2004; Froeschke et al. 2010). Climatic effects are also among the main explanation for host species richness (Mittelbach et al. 2007), and it has been observed that it increases with temperature (Austin 1987), and water availability represents a strong predictor for species richness in tropics, subtropics, and temperate zones (Hawkins et al. 2003). Furthermore, several studies demonstrated that parasites diversity is tightly correlated with that of their hosts, not only in terms of species richness, but also the presence of a tight link between their life‐history and ecological traits as well (Poulin and Morand 2000; Kamiya et al. 2014). Thus, parasite/pathogen diversity and pressure along distinct environments should be higher in moister areas harboring higher host species richness (Dunn et al. 2010).
South America is a large territory that includes a vast array of climates, closely associated with vegetation formation. It comprises a tropical region near the equatorial zone, as well as a subtropical region with temperate climates (Fittkau et al. 1969; Sylvestre 2009). The continent shows complex geomorphological patterns (large river plains, e.g., the Amazon basin, and extensive mountain chains, e.g., the Andean Cordillera) (Clapperton 1993). South America harbors the greatest biodiversity on Earth, containing five of the world's biodiversity “hot spots” (Myers et al. 2000). Moreover, South America shows a complex biogeography, composed of several biomes/ecoregions differentiated mostly by vegetation and climate conditions (Morrone 2004, 2006).
The Brazilian flora composition can be divided into six major biomes. The tropical rain forests (Amazon forest and Atlantic forest, average precipitation (AP) of 2600–3600 and 1800–4000 mm/year, respectively), the Brazilian Savanna (Cerrado, AP of 1200–1500 mm/year), the wetlands (Pantanal, AP of 1000–1400 mm/year), the southern grasslands (Campos Sulinos, AP of 1200–1600 mm/year), and the semi‐arid northeast vegetation (Caatinga, AP 300–800 mm/year) (adapted from Veloso et al. 1991; reviewed in Joly et al. 1999; AP retrieved from Instituto Brasileiro de Geografia e Estatística, IBGE). Different levels of species richness and endemism are observed between these formations. The Amazon forest is a megadiverse biome (e.g., Hoorn et al. 2010, 2011; Malhado et al. 2013), and the Atlantic forest is considered as a hot spot of biodiversity with high levels of endemism (Myers et al. 2000). Although pathogens species itself have never been fully cataloged and described in each one of the biomes (e.g., Szabó et al. 2007), it is expected that more diverse biomes will carry a more diverse array of pathogens than less diverse ones.
The lesser anteater, Tamandua tetradactyla (Linnaeus 1758), is a medium‐sized mammal of the family Myrmecophagidae, order Pilosa. It is part of one of the most ancient lineages of placental mammals, the magna‐order Xenarthra (Murphy et al. 2001), a group that evolved and diversified in South America (Webb 2006). The species has a wide geographic distribution: It occurs in South America east of the Andes, from Venezuela and Trinidad until the north of Argentina, and south of Brazil and Uruguay, in elevations up to 2000 m (Novak 1983; Wetzel 1985; Gardner 2008). Although it has a preference for forested areas, it is also largely found in open grassland savanna‐like areas such as Cerrado, in wetlands such as Pantanal, and in mountain tropical regions (Eisenberg 1989) and transitional forests (Mares et al. 1996). In fact, the species inhabits all major biomes in South America. The lesser anteater is, thus, a suitable model to study the MHC diversity along different habitats (with assumed differences in pathogen diversity) in South America.
In this study, we characterized MHC Class II DRB exon 2 diversity for the first time in a member of the magna‐order Xenarthra, in Tamandua tetradactyla, and examined the spatial distribution across Brazilian biomes. DRB exon 2 was the chosen because it encodes the functional important antigen‐binding sites mainly involved in extracellular antigen presentation to T cells, and it is, thus, usually highly polymorphic (Bodmer et al. 1990; Hughes and Nei 1990; Hughes and Yeager 1998). Furthermore, DRB exon 2 is probably the most studied MHC gene region in nonmodel organisms, which allows data comparison of genetic diversity across species (Sommer 2005).
Our overall aim was to investigate whether there are different compositions of MHC alleles specific to certain geographic regions which could be indicative of local adaptation to differential pools of pathogens in the landscape, or if MHC alleles are randomly distributed in space, meaning that they are all equally adapted. In the first scenario, we would expect higher levels of genetic diversity in rain forest biomes harboring higher pathogen pressure. Additionally, we compared this pattern of MHC spatial diversity with that of neutral markers, such as microsatellites (after C. L. Clozato, N. Moraes‐Barros, J. S. Morgante unpubl. data), to examine the impact of demographic processes on diversity pattern in the lesser anteater.
Materials and Methods
Sampling design
Genetic samples of Tamandua tetradactyla were collected across five Brazilian biomes: Atlantic forest (coastal tropical rain forest, AF, n = 29), Amazon forest (tropical rain forest, AM, n = 12), Caatinga (northeast arid grassland vegetation, CA, n = 3), Cerrado (central open grassland vegetation with gallery forests, CE, n = 16), and Pantanal (open grassland seasonal wetlands, PT, n = 11) between 2006 and 2012 through fieldwork, recovery from road kills, and collaborations with researchers and/or institutions. Additionally, two samples from Peru and one from French Guiana were obtained through donation and assigned to the Amazonian biome. A total of 71 samples were used for this study. Details on the origin of samples and a map of sampling sites are provided in the Appendix and Figure 1, respectively. The biome assignment is based on the geographic coordinates and biomes' definition from the Brazilian Institute of Geography and Statistics (IBGE, http://www.ibge.gov.br/home/) database.
Figure 1.
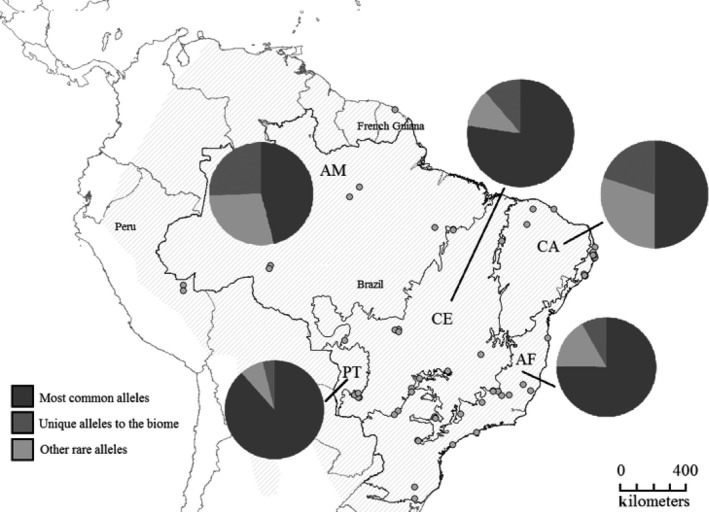
Map of sampling sites of all individuals used in this study across five biomes: Atlantic forest (AF), Amazon forest (AM), Caatinga (CA), Cerrado (CE), and Pantanal (PT). Shaded area throughout South America represents the distribution of T. tetradactyla. Solid lines inside Brazil represent biome's limits according to IBGE (http://www.ibge.gov.br/home/), and dark gray dots represent sampling localities. Pie charts indicate the proportion of five most frequent alleles (TateDRB*40, 04, 39b, 01a, and 25), private alleles, and other rare alleles (those detected in two individuals or less) in each biome (see legend).
Plucked hair was kept in a dry recipient, and blood and tissue samples were kept in 70% ethanol and kept in 4°C until processed for DNA extraction. Genomic DNA extraction was performed with proteinase K digestion enhanced with DDT 1M, followed by salt precipitation (Sambrook et al. 1989), and stored at −20°C before use. All fieldwork and sample management were performed under the SISBIO/IBAMA authorization for scientific activities number 24001‐5/53695225.
Preparatory work for the next‐generation sequencing approach: primer design and standardization of amplification efficiency by single‐strand conformation polymorphism (SSCP) and Sanger sequencing
The SSCP technique was used (1) to screen for the best suitable primer pair that catches the most diversity at the target locus, MHC Class II DRB exon 2, and minimize the occurrence of artifacts, such as null alleles, and (2) to account for possible differences in the amplification efficiency across loci in the species (Sommer et al. 2013). For this purpose, 10 random samples were used. Tested primers bind to conserved sites of DRB intron 1 or exon 2 (forward), and to DRB exon 2 or intron 3 (reverse). In total, 59 primer pairs were tested, but only eight pairs yielded satisfactory bands for sequencing. Amplification reactions (PCRs) were conducted in a 20 μL final volume, with 100 ng of template DNA, 0.375 μmol L−1 of each primer, 5x HotStar HiFidelity PCR Buffer (including MgSO4 and dNTPs mix), 5x Q‐Solution, and 0.5 U of HotStar HiFidelity DNA Polymerase (Qiagen). Thermocycling program consisted of an initial denaturation of 5′ at 94°C, 35 cycles of 1′ at 94°C, 1′ at 53–55°C and 1′ at 72°C, with a final extension of 10′ at 72°C. The chosen primer pair with best yield was JF1 eV (5′‐GAGTGTCATTTYGAGAACGGGACSGAG‐3′) and YML10 (5′‐TCGCCGCTGCACTGTGAACGTCTC‐3′) (Sommer et al. 2013) both binding in the exon 2, amplifying 242 bp. Amplicons derived from successful amplifications were genotyped by SSCP on polyacrylamide gels (Sommer and Tichy 1999). SSCP analysis was performed twice per individual on separate gels using independent PCRs to confirm the banding pattern of all detected alleles. Details about the SSCP preparation, reagents, and electrophoretic conditions are described in Appendix. Single‐strand bands were excised from gel matrix and diluted in distilled water for reamplification in a final volume of 20 μL, 0.375 μmol L−1 of each primer, 1.75 μmol L−1 dNTP mix, 2.5 of 10× buffer μL, and 0.5 U of Taq polymerase (MP Biomedicals, Santa Ana, CA, USA), using the same program as above. PCR products were purified and sequenced in both directions using BigDye Terminator Cycle Sequencing Kit (Applied Biosystems, Carlsbad, CA, USA) on an ABI PRISM 310 (Applied Biosystems).
Sequence electropherograms were visually inspected using Chromas Lite 1.02 (Technelysium Pty Ltd, Qld, Brisbane, Australia). Alignment and sequence translation were performed with ClustalW algorithm implemented in MEGA 6.0 (Tamura et al. 2013). To check for the histocompatibility nature of the sequences, homology was verified using GenBank database (https://www.ncbi.nlm.nih.gov/genbank/) with the online tool BLASTN (http://www.ncbi.nlm.nih.gov/BLAST). To define a sequence as a putative MHC DRB exon 2 allele, the criteria used were its occurrence in at least two independent reactions from the same individuals or detection in at least two distinct individuals. Putative alleles were named according to the nomenclature rules defined in Klein et al. (1990) after confirmation by subsequent pyrosequencing.
Next‐generation sequencing (NGS) approach
The library preparation for pyrosequencing on a 454 GS Junior Titanium platform (Roche) was performed using fusion primers composed of four parts: (1) adaptor lib A sequence (forward: 5′‐CGTATCGCCTCCCTCGCGCCA‐3′ or reverse: 5′‐CTATGCGCCTTGCCAGCCCGC‐3′), (2) internal library key (TCAG), (3) 10‐base pair‐long barcodes called multiplex identifiers (MIDs) for identification of each sample, and (iv) the sequence of the specific chosen primer pair (forward: JF1 eV or reverse: YML10, see above). A compilation of all fusion primers is available in the Appendix. In total, forward fusion primer was 62 bp long, and reverse was 59 bp. For individual barcoding, eleven forward and ten reverse fusion primers were used. The amount of different MIDs combinations allowed pooling a maximum of 110 tagged samples in each run. To safely assign putative alleles, every individual was separately amplified and sequenced twice using different barcodes (amplicon replicates), following Sommer et al.'s (2013) recommendations to deal with artifacts and allelic dropout. Thus, to genotype all individuals, two independent pyrosequencing runs were necessary. PCR was performed in 25 μL reaction volumes containing 100 ng of template DNA, 0.4 μmol L−1 of each fusion primer, 0.2 mmol L−1 dNTPs, 2.5 μL FastStart buffer, and 1.25 U FastStart HiFi Polymerase (Roche Diagnostics GmbH, Penzberg, Germany). Thermocycling program consisted of a denaturation step for 2′ at 94°C, followed by 30 cycles consisted of 30″ at 94°C, 30″ at 55°C, and 1′ at 72°C, and a final extension for 7′at 72°C. PCR products were purified through gel band extraction using peqGOLD Gel Extraction Kit (PeqLab, Erlangen, Germany) and quantified by the Quant‐iT PicoGreen dsDNA Assay Kit (Invitrogen Corporation). Subsequently, all amplicons were diluted to 200,000 molecules/μL and pooled. Emulsion PCR, beads recovery, and DNA library enrichment were performed according to the manufacturer's instructions. The enriched library pool was then sequenced on a PicoTiter plate in a 454 GS Junior Titanium (Roche Diagnostics GmbH).
Quality check of NGS reads and putative allele assignment
Genome Sequencer FLX System Software (Brandfort, CT, USA) was used for initial image and signal processing using the standard amplicon pipeline option. Quality check and filtering steps were performed following the approach and recommendations of Sommer et al. (2013). Briefly, all reads much shorter than expected (~310 bp, including fusion primers and target DNA fragment) were excluded. Reads with incomplete or incorrect MID sequences were removed. Reads with incomplete or incorrect primer regions or <95% bases with Phred quality score Q > 20 were also discarded.
Alignments within individual amplicons were manually performed using the software Geneious Pro v.5.6.5 (Drummond et al. 2012), as none of the alignment software tested managed to correctly place gaps on 454 artificially produced indels. Reads with changes in the reading frame and indels other than 3 bp long (or multiples of 3 bp, corresponding to codons) were excluded due to the biological incompatibility of these features with functional MHC genes. All singleton reads within an amplicon were considered to be artifacts. All remaining reads were clustered based on identity (called clusters), and these consensus sequences were considered hereafter as variants.
The subsequent pipeline used in this study to discriminate “artifacts” from “putative alleles” is illustrated and described in detail in Sommer et al. (2013). Variants within each amplicon were organized based on their frequency, which was considered a criterion for grouping likely putative alleles and probable artifacts because putative alleles were assumed to be in general more frequent than artifacts. At this stage, variants were classified in three categories when comparing them with more frequent variants within the same amplicon: “chimera” (artificial and low‐frequency combination of two parental common variants), “1 bp diff” (i.e., the closest variant among the most frequent ones was only 1 bp apart), and “>1 bp diff.” After this initial variant classification within each amplicon, a second step was performed cross‐checking for correspondence of these variants in the independent amplicon replicate. Artifacts were annotated based on the workflow from Sommer et al. (2013). Variants were classified as “putative allele” if they were present in both individual amplicon replicates and more frequent than all artifacts. A third category defined as “unclassified” was used for variants that were either less frequent than one (or more) artifact(s) or present in only one replicate from an individual, but still could not be considered as artifacts because they were present in other individuals, could not be recognized as possible chimeras, and did not present a very similar (i.e., 1 bp difference) high‐frequency variant. Finally, the remaining variants were classified as artifacts and “putative alleles” by comparing their presence and classification among individuals (Sommer et al. 2013). Whenever variants were more often classified as “unclassified” compared to “putative allele,” they were categorized as “putative alleles with low amplification efficiency.”
Characterization of MHC class II DRB exon 2 in Tamandua tetradactyla across biomes
Sequences of putative MHC alleles were edited, aligned, and translated using MEGA 6.0 (Tamura et al. 2013). This software was also applied to count the number of variable positions and the mean number of differences between alleles. Nucleotide and amino acid genetic distances were calculated using Kimura‐2‐parameters model of substitution and Poisson‐corrected distance, respectively. For the genetic distance parameter, calculations were performed for the entire data set (all sequences), as well as for each biome separately. The relative rates of nonsynonymous (dN) and synonymous (dS) base pair substitutions were calculated according to Nei and Gojobori (1986), using Jukes–Cantor correction for multiple hits. These calculations were performed for all sites, for putative antigen‐binding sites (ABS) separately, assuming correspondence to human ABS of HLA‐DR1 molecule (after Brown et al. 1993), and for all sites excluding ABS. The dN/dS ratios after 1000 bootstrap replicates were compared with an implemented two‐tailed Z‐test to test deviation from dN = dS (positive selection is indicated if dN > dS, Nei and Kumar 2000). The number of probable loci as product of gene duplications was estimated as the half of the maximum number of alleles for one individual.
The phylogenetic relationships between MHC class II DRB exon 2 alleles were investigated by a Bayesian phylogenetic tree obtained by Mr. Bayes vs. 3.2.0 (Ronquist et al. 2012). A mixed model for mixed rates for amino acid with gamma distribution was used. Values of posterior probability were obtained with 300,000 generations and 1000 burn‐in, sampled every 1000 chain to check MCMC convergence. Each terminal (allele) was labeled by its occurrence in each biome. Dasypus novemcinctus was used as an out‐group (GenBank sequence XM_004465520.1).
Allelic richness was calculated by a Python script based on the “Multiple random reductions of N” described in Leberg (2002). It performs resampling by taking the minimum number of individuals in each data set, and it extrapolates estimates obtained from small samples to a larger number of individuals. Ten thousand (10000) replicates were used.
Nucleotide diversity was calculated for the entire sequence and for ABS site only with the R package pegas (Paradis 2015), considering all MHC alleles and alleles that occur in each biome separately. To envision the sharing of MHC alleles between biomes and individuals, Circus online tool (http://circos.ca/), a method of circular visualization of tables, was used (Krzywinski et al. 2009). Similarly, the evolutionary relationship between MHC alleles, biomes, and individuals was observed through a network taking the required number of mutations between alleles into account using a median‐joining algorithm (Bandelt et al. 1999) implemented in the software Network version 4.612 (http://www.fluxus-engineering.com/sharenet.htm).
We used the ecodist package (Goslee and Urban 2007) in R to test the correlation of a matrix of raw individual genetic and geographic distance (Euclidean distances between each pair of individuals measured in log kilometers) applying Mantel tests with 1000 replications (Mantel 1967). We also performed partial Mantel tests to correct for geographic distance considering different biomes as predictor variables for genetic distance.
Microsatellite data analyses
All samples used in this study were also genotyped at eight microsatellite loci (H5, E12, G3, F1R, B2, C10, A9, and A8). Isolation and characterization of loci are described in Clozato et al. (2014). The forward sequences of microsatellite fragments are deposited in GenBank (Accession Numbers KF746177‐KF746185), and genotyping data of loci for samples used in this study were extracted from C. L. Clozato, N. Moraes‐Barros, J. S. Morgante (unpubl. data). Number of alleles, number of private alleles (averaged across loci and biomes), and observed and expected heterozygosity (H O/H E) were calculated with GenAlEx package 6.41 (Peakall and Smouse 2006). Allelic richness and Mantel tests were also performed for microsatellites as described for DRB data.
Results
MHC Class II DRB exon 2 diversity and selection pattern in Tamandua tetradactyla
A total of 65 of 71 samples presented consistent 454 pyrosequencing data for further analyses steps. Six samples did not yield enough coverage in one or both replicate amplicons, and were subsequently excluded. After applying the workflow described in the methodology section to classify variants, final data filtering yielded 6402 reads classified as “putative artifacts,” 1194 as “unclassified variants,” and 91,374 as “putative alleles.” For all remaining individuals, the number of reads per amplicon after final data filtering ranged from 110 to 5344, and the number of reads per individual varied between 232 and 10,426.
We validated 70 MHC Class II DRB exon 2 alleles in the nucleotide level and 60 alleles in the amino acid level (Table 1, Fig. 2). Average coverage per allele was 1305 reads ranging from 4 to 18,413 (Table 1). Alignment of the nucleotide sequences against GenBank database using BLASTN confirmed the MHC nature of all alleles. Tamandua tetradactyla MHC Class II DRB allele sequences were deposited in GenBank under the Accession Numbers KP780001 ‐ KP780057. One allele (TateDRB*48) presented a 3‐bp insertion at position 13–15 of the nucleotide alignment, and 13 alleles (TateDRB*06, 17, 20, 29, 43, 44a, 44b, 44c, 44d, 45, 46, 47, and 49) presented a 3‐bp deletion at position 169–171. Both indels represent one single codon (inframe alteration), so the reading frame was unaltered.
Table 1.
MHC class II DRB exon 2 alleles observed in Tamandua tetradactyla across five biomes. N is the number of individuals that contain a specific allele. Relative frequency of a specific allele in the overall data set (65 individuals). MHC alleles that are similar at the amino acid level but different at the nucleotide level are indicated with “a,” “b,” “c,” and “d.” Coverage refers to overall number of reads for each allele. The total number of validated reads was 91,374
| DRB allele | N | Frequency | Coverage | DRB allele | N | Frequency | Coverage |
|---|---|---|---|---|---|---|---|
| TateDRB*01a | 21 | 0.323 | 7289 | TateDRB*34 | 1 | 0.015 | 11 |
| TateDRB*01b | 4 | 0.061 | 9408 | TateDRB*35 | 1 | 0.015 | 6 |
| TateDRB*02 | 3 | 0.046 | 132 | TateDRB*36 | 3 | 0.046 | 115 |
| TateDRB*03 | 14 | 0.215 | 6686 | TateDRB*37a | 2 | 0.030 | 143 |
| TateDRB*04 | 32 | 0.492 | 18413 | TateDRB*37b | 5 | 0.076 | 1707 |
| TateDRB*05 | 9 | 0.138 | 1938 | TateDRB*37c | 2 | 0.030 | 43 |
| TateDRB*06 | 1 | 0.015 | 281 | TateDRB*38 | 11 | 0.169 | 140 |
| TateDRB*07 | 2 | 0.030 | 58 | TateDRB*39a | 4 | 0.061 | 29 |
| TateDRB*08 | 2 | 0.030 | 63 | TateDRB*39b | 26 | 0.400 | 10568 |
| TateDRB*09 | 5 | 0.076 | 3172 | TateDRB*39c | 1 | 0.015 | 240 |
| TateDRB*10 | 1 | 0.015 | 16 | TateDRB*39d | 4 | 0.061 | 147 |
| TateDRB*11 | 2 | 0.030 | 768 | TateDRB*40 | 37 | 0.569 | 971 |
| TateDRB*12 | 1 | 0.015 | 95 | TateDRB*41 | 1 | 0.015 | 144 |
| TateDRB*13 | 1 | 0.015 | 464 | TateDRB*42 | 4 | 0.061 | 555 |
| TateDRB*14 | 3 | 0.046 | 894 | TateDRB*43 | 7 | 0.107 | 1208 |
| TateDRB*15 | 2 | 0.030 | 160 | TateDRB*44a | 11 | 0.169 | 4314 |
| TateDRB*16 | 2 | 0.030 | 15 | TateDRB*44b | 5 | 0.076 | 636 |
| TateDRB*17 | 7 | 0.107 | 74 | TateDRB*44c | 15 | 0.230 | 4095 |
| TateDRB*18a | 1 | 0.015 | 7 | TateDRB*44d | 2 | 0.030 | 1193 |
| TateDRB*18b | 1 | 0.015 | 44 | TateDRB*45 | 3 | 0.046 | 309 |
| TateDRB*19 | 1 | 0.015 | 4 | TateDRB*46 | 1 | 0.015 | 273 |
| TateDRB*20 | 1 | 0.015 | 23 | TateDRB*47 | 2 | 0.030 | 39 |
| TateDRB*21 | 1 | 0.015 | 29 | TateDRB*48 | 4 | 0.061 | 225 |
| TateDRB*22 | 1 | 0.015 | 24 | TateDRB*49 | 8 | 0.123 | 74 |
| TateDRB*23 | 1 | 0.015 | 8 | TateDRB*50 | 1 | 0.015 | 4 |
| TateDRB*24 | 2 | 0.030 | 522 | TateDRB*51 | 2 | 0.030 | 35 |
| TateDRB*25 | 19 | 0.292 | 8168 | TateDRB*52 | 1 | 0.015 | 5 |
| TateDRB*26 | 1 | 0.015 | 6 | TateDRB*53 | 4 | 0.061 | 77 |
| TateDRB*27 | 1 | 0.015 | 66 | TateDRB*54 | 1 | 0.015 | 4 |
| TateDRB*28 | 10 | 0.153 | 2341 | TateDRB*55 | 1 | 0.015 | 4 |
| TateDRB*29 | 11 | 0.169 | 1338 | TateDRB*56 | 2 | 0.030 | 7 |
| TateDRB*30 | 7 | 0.107 | 161 | TateDRB*57 | 1 | 0.015 | 4 |
| TateDRB*31 | 2 | 0.030 | 450 | TateDRB*58 | 1 | 0.015 | 6 |
| TateDRB*32 | 1 | 0.015 | 33 | TateDRB*59 | 1 | 0.015 | 4 |
| TateDRB*33 | 2 | 0.030 | 885 | TateDRB*60 | 1 | 0.015 | 4 |
Figure 2.
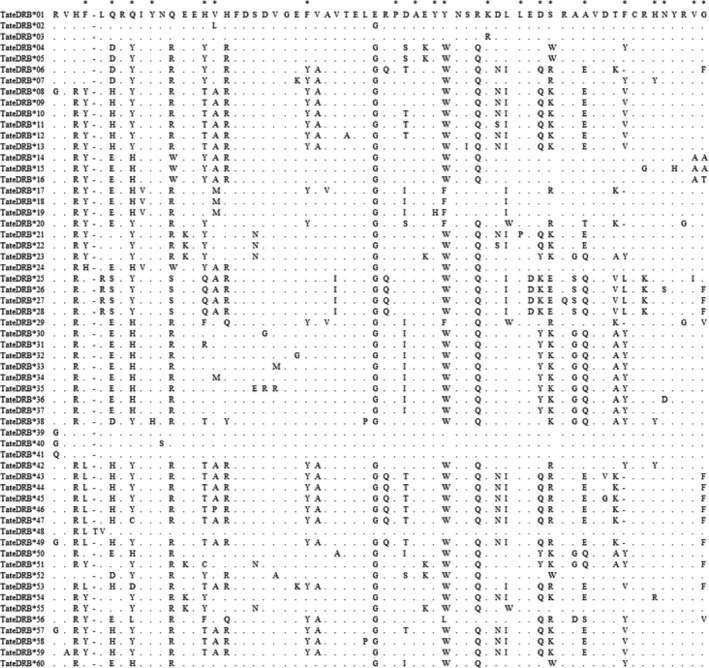
Alignment of Tamandua tetradactyla MHC DRB exon 2 alleles (amino acids). Dots represent identity to the first sequence, and asterisks represent putative ABS sites inferred after Brown et al. 1993. The first inferred ABS position in the alignment corresponds to position number 26 in β‐chain residues of DRB gene in the human sequence (Brown et al. 1993).
Sixteen of the 70 MHC alleles (22.9%) were frequent and detected in more than 10% of the individuals, whereas more than half (41, 58.5%) of alleles were rare, that is, found in two or less individuals (this definition of rare alleles is considered in all further results). Rare MHC alleles were distributed in all sampling regions (Fig. 1). All MHC alleles (frequent, rare, and private alleles) were confirmed and validated, because they occurred in both independent replicates (Table 1, Fig. 4A).
Figure 4.
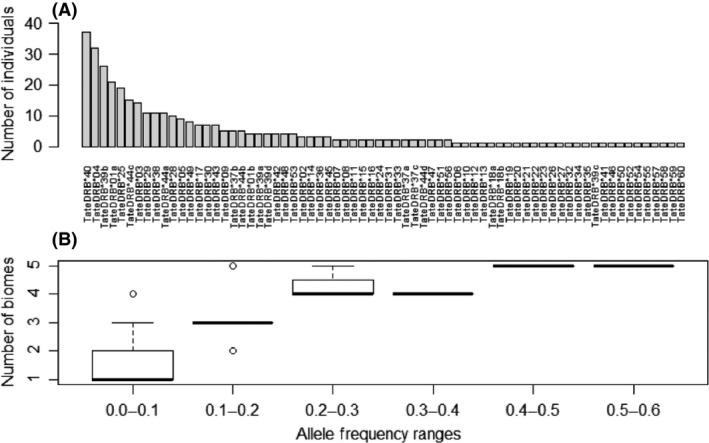
(A) Frequency of MHC class II DRB nucleotide alleles in 65 individuals. Sixteen alleles were detected in more than 10% of the individuals, whereas more than half of alleles are found in only one or two individuals, but confirmed and validated because they occur in both independent replicates. (B) Box plots of MHC class II allele frequencies divided in intervals of 0.1 and the number of biomes (1–5) in which they occur.
Number of DRB alleles across all individuals varied between two and 13, indicating that at least seven loci were amplified. The general MHC DRB diversity features are summarized in Table 2. A total of 75 nucleotide sites were invariable, and 114 were variable. Among these, 35 sites were singletons and 79 sites were parsimony informative. Overall MHC allele sequence diversity was 1.000 ± 0.003, and nucleotide diversity was 0.132 ± 0.004. When considering only nucleotide sequences, all inferred ABS sites were variable in at least one codon position. In translated amino acid sequences, all but two inferred ABS positions were variable (Fig. 2).
Table 2.
Genetic diversity in the overall Tamandua tetradactyla data set and in each biome for MHC class II DRB exon 2 and for eight microsatellite loci (N = sample size; H O /H E = observed and expected heterozygosity; mean number of alleles and private alleles are averaged across all loci)
| Data set | N | MHC | Microsatellites | ||||||
|---|---|---|---|---|---|---|---|---|---|
| DRB nucleotide alleles | DRB amino acid alleles | Nucleotide alleles per individual | Amino acid sequences | Mean H O /H E | Mean number of alleles | Mean number of private alleles | |||
| (195 bp) | (65 codons) | Variable positions (%) | Mean number of differences (±SE) | ||||||
| All samples | 65 | 70 | 60 | 1–13 | 53/65 (82) | 14.60 (±1.97) | 0.38/0.49 | 2.83 (±0.69) | 0.27 (±0.13) |
| Atlantic forest | 29 | 43 | 36 | 1–11 | 48/65 (74) | 14.31 (±1.94) | 0.40/0.52 | 6.00 (±1.55) | 0.75 (±0.25) |
| Amazon forest | 9 | 32 | 28 | 3–10 | 46/65 (71) | 14.86 (±2.11) | 0.50/0.56 | 5.13 (±1.30) | 0.75 (±0.36) |
| Cerrado | 16 | 32 | 29 | 2–9 | 45/65 (69) | 15.48 (±2.14) | 0.36/0.48 | 5.13 (±1.30) | 0.50 (±0.26) |
| Caatinga | 3 | 15 | 14 | 2–5 | 33/65 (51) | 13.12 (±1.88) | 0.33/0.47 | 2.87 (±0.47) | 0.13 (±0.25) |
| Pantanal | 8 | 21 | 15 | 4–13 | 38/65 (58) | 15.05 (±2.14) | 0.29/0.40 | 3.5 (±0.92) | 0.00 (±0.00) |
The dN/dS ratio was 2.94; that is, a higher value of dN than expected for neutral regions was observed, which is compatible with a scenario where this genomic region is under positive selection. This ratio was clearly driven by ABS positions, which held the most part of nonsynonymous substitutions. The two‐tailed Z‐test corroborated the hypothesis of positive selection acting on ABS sites (P‐value = 0.035) (Table 3). Estimates of genetic distances between alleles were more pronounced in among amino acid sequences than nucleotide sequences, which points to the functionality of these different alleles.
Table 3.
The estimated rates (±SE) of dN and dS substitutions for all sites (65 codons), ABS (21 codons) and non‐ABS (44 codons), and their ratio (dN/dS) for MHC class II DRB exon 2 sequences in Tamandua tetradactyla. The probability that dN and dS are different (null hypothesis of neutrality is dN = dS) was calculated using a two‐tailed codon based Z‐test, with 1000 bootstrap replications to obtain the P‐value. Significance at 0.05 is indicated by an asterisk
| Positions | dN | dS | dN/dS | P‐value |
|---|---|---|---|---|
| All sites | 0.306 (±0.081) | 0.104 (±0.044) | 2.94 | 0.142 |
| ABS | 0.279 (±0.070) | 0.138 (±0.058) | 2.02 | 0.035* |
| Non‐ABS | 0.099 (±0.021) | 0.143 (±0.041) | 0.69 | 0.948 |
Comparison of individual MHC genotypes obtained by the SSCP and NGS approach
A comparison of DRB putative alleles retrieved from SSCP and NGS techniques for ten individuals revealed that additional MHC alleles could be detected using NGS in all but two of the samples (Student's t‐test for paired data = 3.772, P‐value = 0.004, Table 4, Fig. 3). SSCP technique was able to detect 25 MHC Class II DRB exon 2 alleles in the nucleotide level and 20 alleles in the amino acid level among ten samples analyzed with this approach. In SSCP, the number of different MHC alleles found in one individual varied between three and eight (Table 4), which would indicate the presence of at least four DRB loci, an underestimation of the underlying loci diversity if compared to NGS.
Table 4.
Comparison of putative MHC alleles obtained for ten individuals using the SSCP gel or the 454 pyrosequencing approach (N 1 and N 2 are the total number of putative alleles found in each individual for SSCP and NGS, respectively). Additional MHC alleles detected by NGS only are marked in bold
| Samples | N 1 | N 2 | Putative alleles | ||||
|---|---|---|---|---|---|---|---|
| TMIguape | 4 | 4 | TateDRB*04 | TateDRB*40 | TateDRB*39d | TateDRB*17 | |
| 13H47 | 8 | 9 | TateDRB*04 | TateDRB*44c | TateDRB*44a | TateDRB*39b | TateDRB*38 |
| TateDRB*01a | TateDRB*43 | TateDRB*11 | TateDRB*29 | ||||
| MBML2453 | 4 | 6 | TateDRB*40 | TateDRB*39a | TateDRB*01a | TateDRB*44c | TateDRB*01a |
| TateDRB*25 | |||||||
| TMPauloA | 4 | 6 | TateDRB*37b | TateDRB*36 | TateDRB*30 | TateDRB*39b | TateDRB*25 |
| TateDRB*40 | |||||||
| T2AL | 3 | 4 | TateDRB*04 | TateDRB*05 | TateDRB*29 | TateDRB*40 | |
| T7PE | 4 | 5 | TateDRB*04 | TateDRB*05 | TateDRB*40 | TateDRB*29 | TateDRB*17 |
| T17CE | 4 | 4 | TateDRB*40 | TateDRB*04 | TateDRB*42 | TateDRB*53 | |
| TMAM | 5 | 6 | TateDRB*04 | TateDRB*01a | TateDRB*44a | TateDRB*31 | TateDRB*57 |
| TateDRB*56 | |||||||
| TTPAN1 | 4 | 8 | TateDRB*40 | TateDRB*01b | TateDRB*39c | TateDRB*39d | TateDRB*03 |
| TateDRB*25 | TateDRB*44a | TateDRB*49 | |||||
| TTPAN3 | 5 | 7 | TateDRB*40 | TateDRB*28 | TateDRB*39a | TateDRB*01a | TateDRB*45 |
| TateDRB*25 | TateDRB*39d | ||||||
Figure 3.
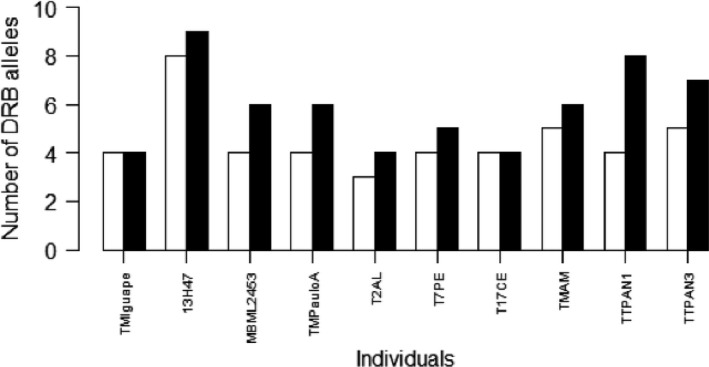
Comparison of number of MHC Class II DRB exon 2 putative alleles retrieved for ten individuals through SSCP (white bars) technique and next‐generation sequencing (NGS, black bars). Significantly more MHC alleles per individual were detected by the NGS approach (Student's t‐test for paired data = 3.772, P‐value = 0.004).
MHC diversity pattern across biomes
Some MHC alleles were more frequent and common than others (Table 1, Fig. 4). MHC alleles with high or intermediate frequency were widely distributed across the diverse habitats used by the lesser anteater. Alleles present in more than 10% of individuals (Fig. 4A) were distributed in three or more biomes. Some other MHC alleles, less frequent (<10% of individuals) but yet not rare (i.e., present in more than two individuals), were likewise distributed in different biomes (TateDRB*48, 17, 37, 42, 09, 53, 43, and 49). DRB alleles with frequencies as high as 0.5 occurred in all five biomes indicating their wide geographic range, whereas alleles with low frequencies (0.1–0.2) occurred in three or less biomes (Figs 4B and 5).
Figure 5.
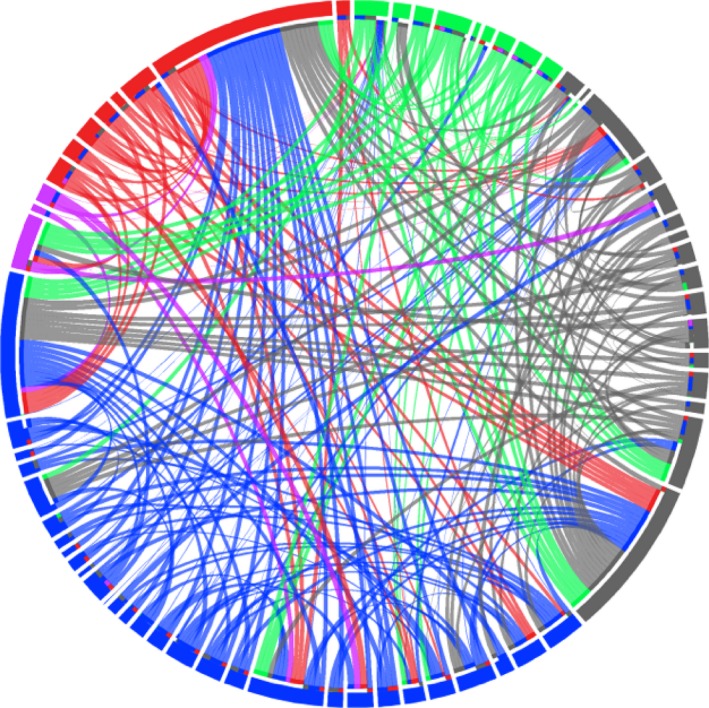
Sharing of MHC class II DRB exon 2 alleles among individuals within and between different biomes. Biomes are denoted by outer circle color: Atlantic forest (blue, n = 29), Amazon forest (green, n = 9), Cerrado (gray, n = 16), Caatinga (violet, n = 3), and Pantanal (red, n = 8). Each ribbon represents one DRB amino acid allele (N = 60). Each interruption in the outer circle represents a different individual (N = 65). Note that most private alleles (present in one biome only) where found in several individuals.
A total of 33 (50.8%) of all DRB amino acid alleles were private to single biomes, either present in one individual or shared among individuals of the same biome (Fig. 1). Atlantic forest and Amazon forest presented the highest number of private alleles: 12 and 11 of 33 alleles (36 and 33%, respectively). Cerrado, Caatinga, and Pantanal presented 5, 3, and 2 private alleles (15, 9, 6%), respectively. When considering samples partitioned by biomes, Atlantic forest presented a set of sequences with most variable positions (74%) and Caatinga with the least (51%) (but also the lowest samples size, n = 3). The highest mean number of differences between sequences was found in Cerrado (Table 2).
For the whole sequence of DRB, nucleotide diversity ranged between 0.117 (CA) and 0.142 (CE). Nucleotide diversity in ABS ranged between 0.011 (CA) and 0.013 (CE). Again Caatinga's (CA) results in genetic diversity (both nucleotide diversity and variable positions) may be influenced by the low sample size (n = 3). Overall, nucleotide diversity inside ABS was consistently higher than the entire sequence, regardless of biomes tested (Fig. 6). In all biome partitions, ABS genetic distance was constantly more divergent than non‐ABS fragments.
Figure 6.
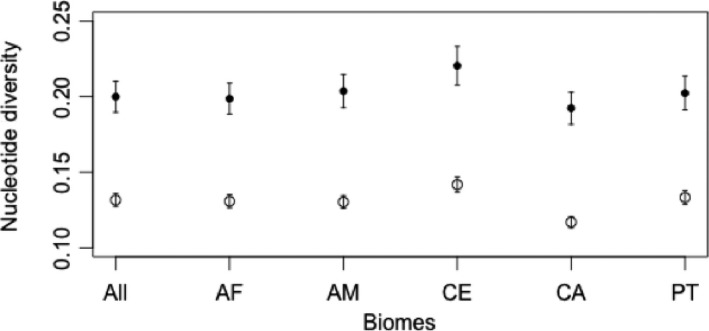
Plot of nucleotide diversity (±standard deviations) for MHC class II DRB allele sequences in the overall sample and per biome. Black dots represent antigen‐binding sites (ABS) and white dots represent all sites.
Phylogenetic tree of DRB alleles resulted in roughly nine major clades, with variable branch lengths reflecting the differences between alleles (Fig. 7). Among nine clades displayed in the phylogeny, seven contain at least one geographically disseminated allele of high or intermediate frequency. Considering that each clade could possibly represent one locus or closely related loci, these seven clades would be composed of one widespread MHC allele (or more) and a few biome‐specific alleles. Some clades are predominantly clusters of MHC alleles specific to biomes AF and AM. There is also constant grouping of alleles between these biomes along the phylogenetic tree and vast allele sharing between them (Figs 5 and 8).
Figure 7.
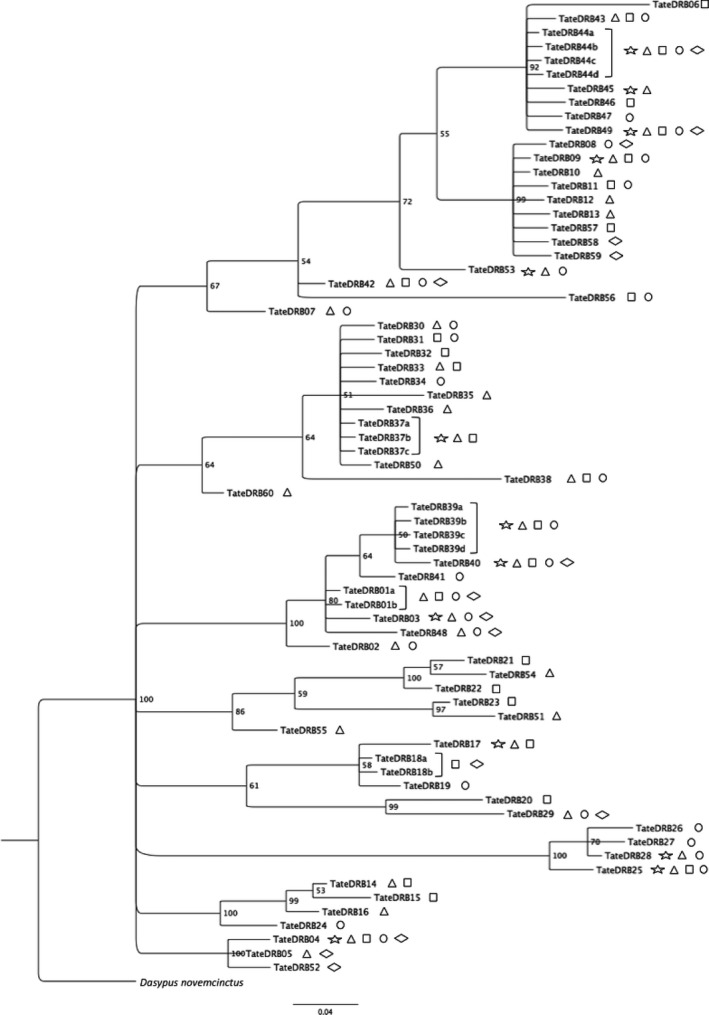
Bayesian phylogenetic tree of MHC Class II DRB alleles with values of posterior probabilities for nodes. Terminals are labeled with biomes in which alleles occur: Atlantic forest (triangle), Amazon forest (square), Cerrado (circle), Caatinga (diamond), and Pantanal (star). Dasypus novemcinctus was used as out‐group.
Figure 8.
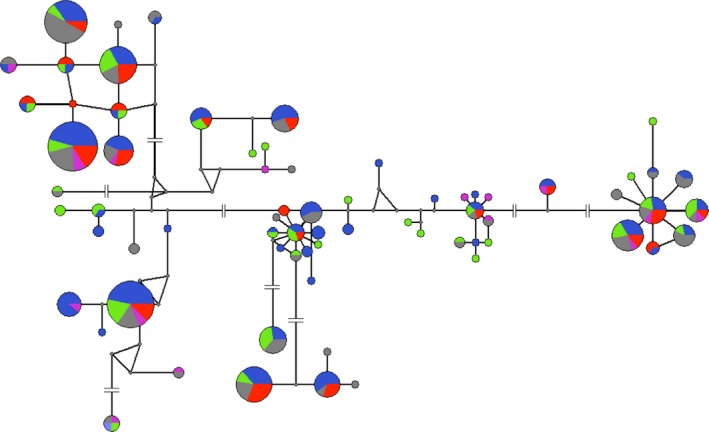
Network of MHC class II DRB exon 2 alleles (nucleotide level) with nodes proportional to frequency of individuals carrying the allele, colored by the biomes in which it occurs: Atlantic forest (blue, n = 29), Amazon forest (green, n = 9), Cerrado (gray, n = 16), Caatinga (violet, n = 3), and Pantanal (red, n = 8). Interruptions in lines represent the presence of more than ten mutations.
Comparison of DRB and microsatellite diversity and correlation with geographic distance
MHC allelic richness corrected for three individuals (all biomes) ranged between 9.0 (CA) and 16.10 (AM) (Fig. 9). For microsatellite data, AM also displayed the highest allelic richness (for a minimum of three samples, allelic richness ranged between 2.3 in PT and 3.0 in AM) (Fig. 9). In all cases, a higher value of allelic richness was found for DRB data, although not directly comparable due to different modes of evolution. Even though both data sets indicated higher allelic richness value in Amazon forest, this difference was steeper in DRB.
Figure 9.
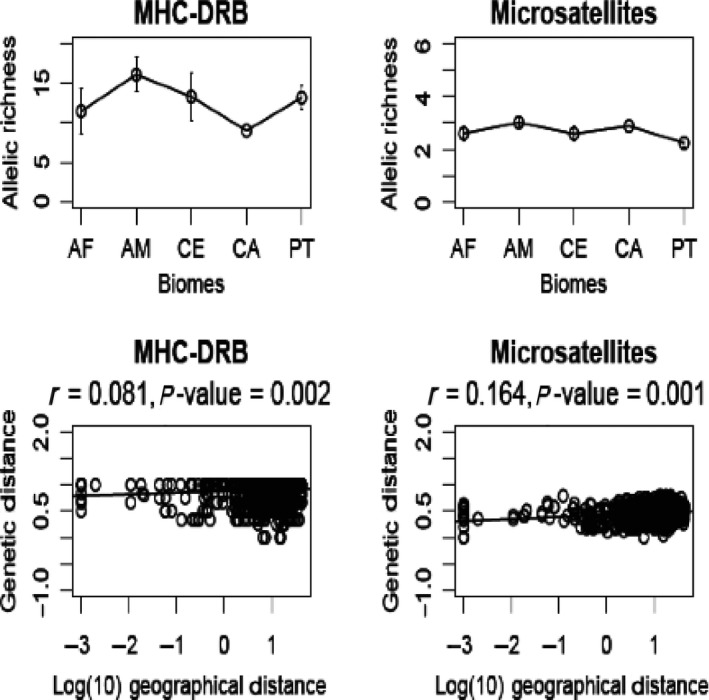
Allelic richness values (±standard deviations) across biomes for MHC class II DRB exon 2 and for microsatellite loci (above). Plots are shown after standardization for a minimum of three samples (all biomes). Mantel tests showing the relationship between individual genetic and geographic distances (Log 10) for DRB alleles and microsatellite loci, and their respective correlation values (below).
In microsatellites, the highest mean number of microsatellite alleles was observed in the Atlantic forest, while the highest number of private alleles was observed both in Atlantic forest and in Amazon forest. Also, mean H O /H E was higher in Amazon and Atlantic forests than in other biomes (Table 2).
Positive and significant correlation between genetic and geographic distances was found for both data sets (DRB and microsatellites), although the degree of this correlation was much stronger for microsatellites than for DRB (DRB: r = 0.081, P‐value = 0.002; microsatellites: r = 0.164, P‐value = 0.001) (Fig. 9). When using a partial Mantel test to correct for the effects of geographic distance (i.e., testing the response of genetic distance to different biomes, representing different environments), a similar positive correlation is observed for both DRB and microsatellites (DRB: r = 0.354 P‐value = 0.001; microsatellites: r = 0.351, P‐value = 0.001).
Discussion
In this study, we examined the MHC Class II DRB exon 2 sequence diversity of the lesser anteater for the first time. In fact, this was the first characterization and description of diversity of a MHC gene for any member of the magna‐order Xenarthra, one of the basal lineages of placental mammals, along with Afrotheria (Murphy et al. 2001). Across a wide sampling region, we aimed to investigate whether there are different compositions of MHC alleles specific to certain geographic regions which could be indicative of local adaptation, or whether alleles are randomly distributed in space.
MHC Class II DRB diversity
We were able to describe 60 DRB exon 2 alleles detected in 65 individuals of Tamandua tetradactyla on the amino acid level and 70 on the nucleotide level (Table 1). As our sampling strategy covered a broad territorial extension and many different landscapes (referred to as “biomes” in this study), we believe to have reported the major alleles of DRB exon 2 across the species distribution.
Considering the amount of samples successfully processed, this is a considerable high level of diversity, even for a locus already expected to be highly variable. This could be the result of two complementary facts. First, the individuals sampled were spread over a vast geographic area, comprising distinct environments. The sampling sites of Tamandua tetradactyla were chosen intending to represent the actual geographic distribution of the species along South America (mainly Brazil, which comprises the majority of the continent's territory) (Fig. 1). Therefore, the samples originated from a variety of distinct environments, and the high diversity of DRB exon 2 may mirror the species‐wide distribution. Secondly, NGS technique used in this study provided a wider capture of MHC DRB alleles. NGS technique has proven to be more sensitive to identify different sequence variants than the SSCP approach (Fig. 3), especially for alleles with low amplification efficiency (Sommer et al. 2013). Other studies have also reported this trend (e.g., Promerová et al. 2012; Sommer et al. 2013), and this may have contributed to the high amount of alleles found for Tamandua tetradactyla as well.
Among mammals, different levels of MHC Class II gene diversity have been reported. In nonvolant widely distributed mammals, as many as 36 alleles were described for more than one hundred samples of the European dog Canis lupus (Seddon and Ellegren 2002), and 52 alleles were described for 25 samples of the Asiatic lion Panthera leo (Sachdev et al. 2005), both using traditional methods (respectively, SSCP and cloning followed by sequencing). On the other hand, 58 DRB alleles were described based on 36 samples of Delomys sublineatus, a small mammal comprised in a restricted distribution (compared to lesser anteater), using a NGS approach (Sommer et al. 2013). Thus, the technique used to describe the diversity of MHC genes in a species sample set is relevant (along with sample size), and it may contribute to correlations of diversity with the species biology.
The high number of DRB alleles found in T. tetradactyla, however, could also be related to copy number variation in the species. In an extreme example, one individual (TTPAN7) displayed 13 alleles in the nucleotide level, which reveals the high number of loci in the species. Therefore, the diversity described in this study is also the reflection of variation in several DRB loci, probably generated by gene duplication, not distinguishable from each other.
Evidence for historical selection
A higher number of nonsynonymous (dN) versus synonymous (dS) nucleotide substitutions was found for the entire sequence of DRB exon 2 gene and in putative ABS, but not in non‐ABS, leading to elevated dN/dS ratios (Table 3). This scenario, along with the known biological significance of MHC class II genes in peptide presentation for the immune system, is compatible with the hypothesis of positive selection acting in this region. Also, nonsynonymous nucleotide substitutions were more frequently observed in the ABS than in the non‐ABS for all sequences and in each biome separately, as well as higher nucleotide diversity (Table 5, Fig. 6), an indicative of selection acting more strongly on ABS. These findings corroborate the literature on functional importance of these sites (Doherty and Zinkernagel 1975; Hughes and Nei 1988) and support evidence for the correct analogy of ABS positions inferred from humans after Brown et al. (1993) (Fig. 2).
Table 5.
Average nucleotide and amino acid divergence of individuals within a biome for MHC class II DRB exon 2 alleles
| Data set | K2P nucleotide distance | Poisson‐corrected amino acid distance | ||||
|---|---|---|---|---|---|---|
| All sites | ABS | Non‐ABS | All sites | ABS | Non‐ABS | |
| All Sequences | 0.339 (±0.219) | 0.302 (±0.071) | 0.121 (±0.021) | 0.306 (±0.059) | 0.594 (±0.260) | 0.217 (±0.048) |
| Atlantic forest | 0.105 (±0.017) | 0.242 (±0.045) | 0.109 (±0.017) | 0.270 (±0.043) | 0.468 (±0.023) | 0.193 (±0.036) |
| Amazon forest | 0.147 (±0.018) | 0.248 (±0.046) | 0.107 (±0.017) | 0.274 (±0.045) | 0.481 (±0.132) | 0.194 (±0.040) |
| Cerrado | 0.162 (±0.018) | 0.275 (±0.049) | 0.116 (±0.019) | 0.291 (±0.047) | 0.506 (±0.133) | 0.208 (±0.043) |
| Caatinga | 0.130 (±0.018) | 0.233 (±0.048) | 0.089 (±0.018) | 0.241 (±0.043) | 0.446 (±0.120) | 0.164 (±0.038) |
| Pantanal | 0.153 (±0.019) | 0.254 (±0.049) | 0.113 (±0.019) | 0.285 (±0.048) | 0.472 (±0.139) | 0.213 (±0.047) |
Distribution and diversity of DRB alleles among biomes
Our results show that common and frequent DRB alleles are geographically widespread, occurring in all biomes, while other less frequent alleles are restricted to one biome. In fact, all biomes showed some level of private alleles in combination with other rare alleles (Fig. 1). When analyzing the phylogenetic tree (Fig. 7), it is possible to observe that these common widespread alleles are present in all major clades. These alleles are most likely ancient and supposedly very important to the immune response of the species, with probably similar pathogen recognition capabilities, and possibly recognizing a vast array of common antigens. Therefore, they are spread to different lineages and are likely kept in high frequency in all of them by positive selection.
At the same time, several rare alleles were found to be scattered among biomes, and some of them were private to one biome. Nevertheless, the alleles were highly divergent, as evidenced by the phylogenetic tree (Fig. 7) and pairwise genetic distance both in nucleotides and amino acids, and especially in ABS, which showed higher nucleotide diversity and genetic distance than the whole sequence (Table 5, Fig. 6). These parameters are indicative of dissimilar functional properties of these alleles, and the fact that private alleles were found within biomes is considered as evidence that specific alleles may be important in environments which harbor specific pathogens. Curiously, despite Cerrado did not present high frequency of private alleles or allelic richness, it presented the highest genetic divergence against other biomes (both in amino acid and in nucleotide, Table 5), suggesting that specific alleles may play an important role in this different habitat.
Hence, we found different allelic compositions throughout biomes, comprising common, rare, and private alleles. Moreover, rain forest biomes displayed the highest diversity, depicted by higher number of private alleles and higher allelic richness. Between the biomes sampled in this study, the rain forests in fact display higher general diversity among all taxa. Despite the private alleles may not fully reflect biome diversity, as it is dependent on sample size, the cross results from different diversity indicators indicate that the outcome of diversity in rain forests is reliable. As already mentioned, the Amazon and the Atlantic forests are regions with high levels of biodiversity and endemism. Thus, they are also expected to harbor more pathogens than drier or less diverse biomes. This elevated exposure to pathogens is expected to be mirrored in the MHC genetic diversity of the species, as it was observed. On the other hand, our data also controlled for demographic patterns (neutral markers), and the configuration of genetic diversity seemed to be similar to MHC. Thus, the effect of demographic processes such as drift and migration is not negligible in shaping the MHC diversity throughout the species ranges. Studies in humans both on MHC (Prugnolle et al. 2005) and on several genomic SNPs with signs for positive selection (Fumagalli et al. 2011), correlating with pathogen pressure, showed a strong signature of demography despite the observed influence of pathogen‐mediated selection. In fact, Fumagalli et al. (2011) argued that the diversity of the local pathogenic environment could represent a predominant driver of local adaptation, and although background demography usually makes the strongest contribution in explaining the genetic variance among populations, specific alleles could be correlated with a certain pathogenic environment. Studies with nonmodel organisms also showed that demography is important in shaping MHC diversity, even in the presence of clear signatures of selection in this gene family (Alcaide 2010; Miller et al. 2010), with isolation by distance being a common pattern emerging from both microsatellites and MHC. In fact, demography probably does not overcome balancing selection when populations are fragmented and small (Strand et al. 2012). Thus, differences in the spatial distribution of alleles (and genetic differentiation measured by FST, when possible) indicate possible local adaptation to different environments (Ekblom et al. 2007; Miller et al. 2010).
Although our study does not have data about pathogens that interact with our T. tetradactyla's samples, it is possible that the higher MHC diversity found in the rain forest biomes could be the product of a more diverse pathogenic environment (and hence a stronger selective pressure), coupled with the effects of demography, because these biomes display a greater diversification in general than the other sampled landscapes. Larger samples sizes with finer spatial distribution coupled with information about pathogen interaction could help to clarify to what extent (and which) private MHC alleles actually represent local adaptations in the species.
Conclusions
Our results indicate that MHC variation across lesser anteater populations in different biomes show clear signs of natural selection, as well as probable local adaptation driven by different compositions of pathogens in distinct environments. Rain forest biomes (Amazon and Atlantic forests) show higher overall neutral and adaptive genetic diversity, as expected from known patterns of species diversity in South America biogeography. The higher proportion of MHC private alleles and allelic richness in these biomes points to a different composition of potentially important genetic variation that should be taken into account for future conservation plans.
Conflict of Interest
No conflict of interests to declare.
Data Accessibility
Sequences of Tamandua tetradactyla DRB Exon 2 amino acid and nucleotide alleles were deposited in GenBank under the Accession Numbers KP780001 ‐ KP780057.
Microsatellite sequences of loci were deposited in GenBank under the Accession Numbers KF746177‐KF746185.
Specific information about samples used in this study can be found in Table S1, Supporting Information.
Supporting information
Appendix S1. Details about SSCP gel preparation.
Table S1. List of Tamandua tetradactyla samples (n = 71) used in this study.
Table S2. Fusion primer name and composition (adaptor lib A sequence, internal library key, barcode for individual identification (multiplex identifiers, MIDs) and specific primer sequence (forward: JF1 eV, reverse: YML10) used for 454 pyrosequencing.
Acknowledgments
We would like to thank Fabrício R. Santos, Flávia Miranda, and José Abílio Ohana for sample donations. We would also like to thank Anke Schmidt, Saskia Wutke, and Susan Mbedi for wet laboratory assistance, and Pablo SC Santos for help with Python‐based statistical analysis. C.L. Clozato was supported by CAPES (PhD and PSDE) scholarship, and J. S. Morgante was granted with a research award from FAPESP (08/52207‐0).
Ecology and Evolution 2015; 5(21): 4932–4948
References
- Alcaide, M. 2010. On the relative roles of selection and genetic drift in shaping MHC variation. Mol. Ecol. 19:3842–3844. [DOI] [PubMed] [Google Scholar]
- Apanius, V. , Penn D., Slev P. R., Ruff L. R., and Potts W. K.. 1997. The nature of selection on the major histocompatibility complex. Crit. Rev. Immunol. 17:179–224. [DOI] [PubMed] [Google Scholar]
- Appleton, C. C. , and Gouws E.. 1996. The distribution of common intestinal nematodes along an altitudinal transect in KwaZulu‐Natal, South Africa. Ann. Trop. Med. Parasitol. 90:181–188. [DOI] [PubMed] [Google Scholar]
- Austin, M. P. 1987. Models for the analysis of species response to environmental gradients. Vegetatio 69:35–45. [Google Scholar]
- Bandelt, H. J. , Forster P., and Röhl A.. 1999. Median‐joining networks for inferring intraspecific phylogenies. Mol. Biol. Evol. 16:37–48. [DOI] [PubMed] [Google Scholar]
- Bernatchez, L. , and Landry C.. 2003. MHC studies in nonmodel vertebrates: what have we learned about natural selection in 15 years? J. Evol. Biol. 16:363–377. [DOI] [PubMed] [Google Scholar]
- Bodmer, J. G. , Marsh S. G., Parham P., Erlich H. A., Albert E., Bodmer W. F., et al. 1990. Nomenclature for factors of the HLA system, 1989. Tissue Antigens 35:1–8. [DOI] [PubMed] [Google Scholar]
- Brown, J. H. , Jardetzky T. S., Gorga J. C., Stern L. J., Urban R. G., Strominger J. L., et al. 1993. Three‐dimensional structure of the human class II histocompatibility antigen HLA‐DR1. Nature 364:33–33. [DOI] [PubMed] [Google Scholar]
- Clapperton, C. M. 1993. Quaternary geology and geomorphology of South America. Elsevier, New York, NY. [Google Scholar]
- Clozato, C. L. , Moraes‐Barros N., Santos F. R., and Morgante J. S.. 2014. Historical and non‐invasive samples: a study case of genotyping errors in newly isolated microsatellites for the lesser anteater (Tamandua tetradactyla L., Pilosa). Mol. Ecol. Resour. 14:531–540. [DOI] [PubMed] [Google Scholar]
- Doherty, P. C. , and Zinkernagel R. M.. 1975. Enhanced immunological surveillance in mice heterozygous at H‐2 gene complex. Nature 256:50–52. [DOI] [PubMed] [Google Scholar]
- Drummond, A. , Ashton B., Buxton S., Cheung M., Cooper A., Duran C., et al. 2012. Geneious v5.6.5 created by Biomatters.
- Dunn, R. R. , Davies T. J., Harris N. C., and Gavin M. C.. 2010. Global drivers of human pathogen richness and prevalence. Proc. Biol. Sci. 277:2587–2595. [DOI] [PMC free article] [PubMed] [Google Scholar]
- Eisenberg, J. F. 1989. Order Xenarthra (Edentata) Pp. 50–67 in Montgomery G., ed. Mammals of the neotropics – The northern neotropics Vol. 1. The University of Chicago Press, London. [Google Scholar]
- Eizaguirre, C. , and Lenz T. L.. 2010. Major histocompatibility complex polymorphism: dynamics and consequences of parasite‐mediated local adaptation in fishes. J. Fish Biol. 77:2023–2047. [DOI] [PubMed] [Google Scholar]
- Ekblom, R. , Saether S. A., Jacobsson P., et al. 2007. Spatial pattern of MHC class II variation in the great snipe (Gallinago media). Mol. Ecol. 16:1439–1451. [DOI] [PubMed] [Google Scholar]
- Fittkau, E. J. , Illies J., Klinge H., Schwabe G. H., and Sioli H.. 1969. Biogeography and Ecology in South‐America. Junk, The Hague, The Netherlands. [Google Scholar]
- Froeschke, G. , and Sommer S.. 2014. Role of selection versus neutral processes determining genetic variation in a small mammal along a climatic gradient in southern Africa. Evol. Ecol. 28:1169–1190. [Google Scholar]
- Froeschke, J. , Stunz G. W., and Wildhaber M. L.. 2010. Environmental influences on the occurrence of coastal sharks in estuarine waters. Mar. Ecol. Prog. Ser. 407:279–292. [Google Scholar]
- Fumagalli, M. , Sironi M., Pozzoli U., Ferrer‐Admettla A., Pattini L., and Nielsen R.. 2011. Signatures of environ‐ mental genetic adaptation pinpoint pathogens as the main selective pressure through human evolution. PLoS Genet. 7:e1002355. [DOI] [PMC free article] [PubMed] [Google Scholar]
- Gardner, A. L. 2008. Magnaorder Xenarthra Pp. 127–176 in Gardner A. L., ed. Mammals of South America, Vol 1: marsupials, xenarthrans, shrews, and bats. The University of Chicago Press, Chicago, IL. [Google Scholar]
- Goslee, S. C. , and Urban D. L.. 2007. The ecodist package for dissimilarity‐based analysis of ecological data. J. Stat. Softw. 22:1–19. [Google Scholar]
- Guernier, V. , Hochberg M. E., and Guegan J. F.. 2004. Ecology drives the worldwide distribution of human diseases. PLoS Biol. 2:740–746. [DOI] [PMC free article] [PubMed] [Google Scholar]
- Hawkins, B. A. , Field R., Cornell H. V., Currie D. J., Guégan J. F., Kaufman D. M., et al. 2003. Energy, water and broad‐scale geographic patterns of species richness. Ecology 84:3105–3117. [Google Scholar]
- Hedrick, P. W. , and Kim K. J.. 2000. Genetics of complex polymorphisms: parasites and maintenance of the major histocompatibility complex variation Pp. 204–234 in Singh R. S. and Krimbas C. B., eds. Evolutionary genetics: from molecules to morphology. Cambridge Univ. Press, Cambridge. [Google Scholar]
- Hill, A. V. 1991. HLA associations with malaria in Africa: some implications for MHC evolution. Pp. 403–420 in Klein J. and Klein D., eds. Molecular evolution of the major histocompatibility complex. Springer, Berlin, Heidelberg. [Google Scholar]
- Hoorn, C. , Wesselingh F. P., ter Steege H., Bermudez M. A., Mora A., Sevink J., et al. 2010. Amazonia through time: andean uplift, climate change, landscape evolution, and biodiversity. Science 330:927–931. [DOI] [PubMed] [Google Scholar]
- Hoorn, C. , Wesselingh F. P., Kroonenberg S. P., Antonelli A., Lundberg J. G., Vonhof H. B., et al. 2011. On the origin of Amazonian landscapes and biodiversity: a synthesis Pp. 419–431 in Hoorn C., Wesselingh F. P., eds. Amazonia: landscape and species evolution: a look into the past. John Wiley & Sons, Oxford, UK. [Google Scholar]
- Hudson, P. J. 2006. Climate disruption and parasite‐host dynamics: patterns and processes associated with warming and the frequency of extreme climatic events. J. Helminthol. 80:175–182. [DOI] [PubMed] [Google Scholar]
- Hughes, A. L. , and Nei M.. 1988. Pattern of nucleotide substitution at major histocompatibility complex class‐I loci reveals overdominant selection. Nature 335:167–170. [DOI] [PubMed] [Google Scholar]
- Hughes, A. L. , and Nei M.. 1990. Evolutionary relationships of class II major‐histocompatibility‐complex genes in mammals. Mol. Biol. Evol. 7:491–514. [DOI] [PubMed] [Google Scholar]
- Hughes, A. L. , and Yeager M.. 1998. Natural selection at major histocompatibility complex loci of vertebrates. Annu. Rev. Genet. 32:415–435. [DOI] [PubMed] [Google Scholar]
- Jeffery, K. J. M. , and Bangham C. R. M.. 2000. Do infectious diseases drive MHC diversity? Microbes Infect. 2:1335–1341. [DOI] [PubMed] [Google Scholar]
- Joly, C. A. , Aidar M. P. M., Klink C. A., McGrath D. G., Moreira A. G., Moutinho P., et al. 1999. Evolution of the Brazilian phytogeography classification systems: implications for biodiversity conservation. Ciência e Cultura 51:331–348. [Google Scholar]
- Kamiya, T. , O'Dwyer K., Nakagawa S., and Poulin R.. 2014. Host diversity drives parasite diversity: meta‐analytical insights into patterns and causal mechanisms. Ecography 37:689–697. [Google Scholar]
- Klein, J. , Bontrop R. E., Dawkins R. L., Erlich H. A., Gyllesten U. B., Heise E. R., et al. 1990. Nomenclature for the major histocompatibility complexes of different species: a proposal. Immunogenetics 31:217–219. [DOI] [PubMed] [Google Scholar]
- Krzywinski, M. , Schein J., Birol I., Connors J., Gascoyne R., Horsman D., et al. 2009. Circos: an information aesthetic for comparative genomics. Genome Res. 19:1639–1645. [DOI] [PMC free article] [PubMed] [Google Scholar]
- Kutz, S. J. , Hoberg E. P., Polley L., and Jenkins E. J.. 2005. Global warming is changing the dynamics of Arctic host–parasite systems. Proc. Biol. Sci. 272:2571–2576. [DOI] [PMC free article] [PubMed] [Google Scholar]
- Leberg, P. L. 2002. Estimating allelic richness: effects of sample size and bottlenecks. Mol. Ecol. 11:2445–2449. [DOI] [PubMed] [Google Scholar]
- Lenz, T. L. , Eizaguirre C., Rotter B., Kalbe M., and Milinski M.. 2013. Exploring local immunological adaptation of two stickleback ecotypes by experimental infection and transcriptome‐wide digital gene expression analysis. Mol. Ecol. 22:774–786. [DOI] [PMC free article] [PubMed] [Google Scholar]
- Malhado, A. , Ladle R., Whittaker R., Neto A., Malhi Y., and ter Steege H.. 2013. The ecological biogeography of Amazonia. Front. Biogeogr. 5:103–112. [Google Scholar]
- Mantel, N. 1967. The detection of disease clustering and a generalized regression approach. Cancer Res. 27:209–220. [PubMed] [Google Scholar]
- Mares, M. , Barquez R. M., Braun J. K., and Ojeda R. A.. 1996. Observations on the mammals of Tucuman Province, Argentina: systematics, distribution, and ecology of the Didelphimorphia, Xenarthra, Chiroptera, Primates, Carnivora, Perissodactyla, Artiodactyla, and Lagomorpha. Ann. Carnegie Mus. 65:89–152. [Google Scholar]
- Mas‐Coma, S. 2008. Effects of climate change on animal and zoonotic helminthiases Pp. 443–452 in Climate change: impact on the epidemiology and control of animal diseases. de La Rocque S., et al. Rev. Sci. Tech. Off. Int. Epiz. 27. [PubMed] [Google Scholar]
- Miller, H. C. , Allendorf F., and Daugherty C. H.. 2010. Genetic diversity and differentiation at MHC genes in island populations of tuatara (Sphenodon spp.). Mol. Ecol. 19:3894–3908. [DOI] [PubMed] [Google Scholar]
- Mittelbach, G. G. , Schemske D. W., Cornell H. V., et al. 2007. Evolution and the latitudinal diversity gradient: speciation, extinction and biogeography. Ecol. Lett. 10:315–331. [DOI] [PubMed] [Google Scholar]
- Morrone, J. J. 2004. Panbiogeografia, componentes bióticos y zonas de transición. Rev. Bras. Entomol. 48:149–162. [Google Scholar]
- Morrone, J. J. 2006. Biogeographic areas and transition zones of Latin America and the Caribbean islands based on panbiogeographic and cladistic analyses of the entomofauna. Annu. Rev. Entomol. 51:467–494. [DOI] [PubMed] [Google Scholar]
- Murphy, W. J. , Eizirik E., Johnson W. E., Zhang Y. P., Ryder O. A., and O'Brien S. J.. 2001. Molecular phylogenetics and the origins of placental mammals. Nature 409:614–618. [DOI] [PubMed] [Google Scholar]
- Myers, N. , Mittermeier R. A., Mittermeier C. G., Fonseca G. A. B., and Kent J.. 2000. Biodiversity hotspots for conservation priorities. Nature 403:853–858. [DOI] [PubMed] [Google Scholar]
- Nei, M. , and Gojobori T.. 1986. Simple methods for estimating the numbers of synonymous and nonsynonymous nucleotide substitutions. Mol. Biol. Evol. 3:418–426. [DOI] [PubMed] [Google Scholar]
- Nei, M. , and Kumar S.. 2000. Molecular evolution and phylogenetics. Oxford Univ. Press, New York, NY. [Google Scholar]
- Novak, R. M. 1983. Walkers mammals of the world. The Johns Hopkins Univ. Press, Baltimore and London. [Google Scholar]
- Paradis, E. , Jombart T., Schliep K., Potts A., and Winter D.. 2015. Population and evolutionary genetics analysis system. R package version 0.8.1. Available from: http://ape-package.ird.fr/pegas/.
- Peakall, R. , and Smouse P. E.. 2006. GENALEX 6: genetic analysis in Excel. Population genetic software for teaching and research. Mol. Ecol. Notes 6:288–295. [DOI] [PMC free article] [PubMed] [Google Scholar]
- Poulin, R. , and Morand S.. 2000. The diversity of parasites. Q. Rev. Biol. 75:277–293. [DOI] [PubMed] [Google Scholar]
- Promerová, M. , Babik W., Bryja J., et al. 2012. Evaluation of two approaches to genotyping major histocompatibility complex class I in a passerine‐CE‐SSCP and 454 pyrosequencing. Mol. Ecol. Resour. 12:285–292. [DOI] [PubMed] [Google Scholar]
- Prugnolle, F. , Manica A., Charpentier M., Guégan J. F., Guernier V., and Balloux F.. 2005. Pathogen‐driven selection and worldwide HLA class I diversity. Curr. Biol. 15:1022–1027. [DOI] [PubMed] [Google Scholar]
- Ronquist, F. , Teslenko M., van der Mark P., Ayres D. L., Darling A., Höhna S., et al. 2012. MrBayes 3.2: efficient Bayesian phylogenetic inference and model choice across a large model space. Syst. Biol. 61:539–542. [DOI] [PMC free article] [PubMed] [Google Scholar]
- Sachdev, M. , Sankaranarayanan R., Reddanna P., Thangaraj K., and Singh L.. 2005. Major histocompatibility complex class I polymorphism in Asiatic lions. Tissue Antigens 66:9–18. [DOI] [PubMed] [Google Scholar]
- Sambrook, J. , Fritsch E. F., and Maniatis T.. 1989. Molecular cloning: a laboratory manual. Cold Spring Harbor Laboratory Press, New York, NY. [Google Scholar]
- Seddon, J. M. , and Ellegren H.. 2002. MHC class II genes in European wolves: a comparison with dogs. Immunogenetics 54:490–500. [DOI] [PubMed] [Google Scholar]
- Slade, R. W. , and McCallum H. I.. 1992. Overdominant vs. frequency‐dependent selection at MHC loci. Genetics 132:861–862. [DOI] [PMC free article] [PubMed] [Google Scholar]
- Sommer, S. 2005. The importance of immune gene variability (MHC) in evolutionary ecology and conservation. Front. Zool. 2:16. [DOI] [PMC free article] [PubMed] [Google Scholar]
- Sommer, S. , and Tichy H.. 1999. Major histocompatibility complex (MHC) class II polymorphism and paternity in the monogamous Hypogeomys antimena, the endangered, largest endemic Malagasy rodent. Mol. Ecol. 8:1259–1272. [DOI] [PubMed] [Google Scholar]
- Sommer, S. , Courtiol A., and Mazzoni C. J.. 2013. MHC genotyping of non‐model organisms using next‐generation sequencing: a new methodology to deal with artefacts and allelic dropout. BMC Genom. 14:542–559. [DOI] [PMC free article] [PubMed] [Google Scholar]
- Sommer, S. , Rakotondranary S. J., and Ganzhorn J. U.. 2014. Maintaining microendemic primate species along an environmental gradient – parasites as drivers for species differentiation. Ecol. Evol. 4:4751–4765. [DOI] [PMC free article] [PubMed] [Google Scholar]
- Strand, T. M. , Segelbacher G., Quintela M., Xiao L., Axelsson T., and Höglund J.. 2012. Can balancing selection on MHC loci counteract genetic drift in small fragmented populations of black grouse? Ecol. Evol. 2:341–353. [DOI] [PMC free article] [PubMed] [Google Scholar]
- Sylvestre, F. 2009. Moisture pattern during the last glacial maximum in South America Pp. 3–27 in Vimeux F., Sylvestre F. and Khodri M., eds. Past climate variability in South America and surrounding regions, developments in Paleo environmental research. Springer, Netherlands. [Google Scholar]
- Szabó, M. P. J. , Castro M. B., Ramos H. G. C., Garcia M. V., Castagnolli K. C., Pinter A., et al. 2007. Species diversity and seasonality of free‐ling ticks (Acari: Ixodidae) in the natural habitat of wild Marsh deer (Blastocerus dichotomus) in Southeastern Brazil. Vet. Parasitol. 143:147–154. [DOI] [PubMed] [Google Scholar]
- Takahata, N. , and Nei M.. 1990. Allelic genealogy under overdominant and frequency‐dependent selection and polymorphism of Major Histocompatibility Complex loci. Genetics 124:967–978. [DOI] [PMC free article] [PubMed] [Google Scholar]
- Tamura, K. , Stecher G., Peterson D., Filipski A., and Kumar S.. 2013. MEGA6: molecular evolutionary genetics analysis version 6.0. Mol. Biol. Evol. 30:2725–2729. [DOI] [PMC free article] [PubMed] [Google Scholar]
- Veloso, H. P. , Rangel‐Filho A. L. R., and Lima J. C. A.. 1991. Classificação da vegetação brasileira adaptada a um sistema universal. MEFP/IBGE/DRNEA, Rio de Janeiro: 123p. [Google Scholar]
- Webb, S. D. 2006. The great American biotic interchange: patterns and processes. Ann. Mo. Bot. Gard. 93:245–257. [Google Scholar]
- Wetzel, R. M. 1985. The identification and distribution of recent Xenarthra (=Edentata) Pp. 5–21 in Montgomery G. G., ed. The evolution and ecology of armadillos, sloths and vermilinguas. Smithsonian Institution Press, Washington, DC. [Google Scholar]
Associated Data
This section collects any data citations, data availability statements, or supplementary materials included in this article.
Supplementary Materials
Appendix S1. Details about SSCP gel preparation.
Table S1. List of Tamandua tetradactyla samples (n = 71) used in this study.
Table S2. Fusion primer name and composition (adaptor lib A sequence, internal library key, barcode for individual identification (multiplex identifiers, MIDs) and specific primer sequence (forward: JF1 eV, reverse: YML10) used for 454 pyrosequencing.
Data Availability Statement
Sequences of Tamandua tetradactyla DRB Exon 2 amino acid and nucleotide alleles were deposited in GenBank under the Accession Numbers KP780001 ‐ KP780057.
Microsatellite sequences of loci were deposited in GenBank under the Accession Numbers KF746177‐KF746185.
Specific information about samples used in this study can be found in Table S1, Supporting Information.