Abstract
Real-time particle tracking is a technique that combines fluorescence microscopy with object tracking and computing and can be used to extract quantitative transport parameters for small particles inside cells. Since the success of a nanocarrier can often be determined by how effectively it delivers cargo to the target organelle, understanding the complex intracellular transport of pharmaceutical nanocarriers is critical. Real-time particle tracking provides insight into the dynamics of the intracellular behavior of nanoparticles, which may lead to significant improvements in the design and development of novel delivery systems. Unfortunately, this technique is not often fully understood, limiting its implementation by researchers in the field of nanomedicine. In this chapter, one of the most complicated aspects of particle tracking, the mean square displacement (MSD) calculation, is explained in a simple manner designed for the novice particle tracker. Pseudo code for performing the MSD calculation in MATLAB is also provided. This chapter contains clear and comprehensive instructions for a series of basic procedures in the technique of particle tracking. Instructions for performing confocal microscopy of nanoparticle samples are provided, and two methods of determining particle trajectories that do not require commercial particle-tracking software are provided. Trajectory analysis and determination of the tracking resolution are also explained. By providing comprehensive instructions needed to perform particle-tracking experiments, this chapter will enable researchers to gain new insight into the intracellular dynamics of nanocarriers, potentially leading to the development of more effective and intelligent therapeutic delivery vectors.
Keywords: Real-time, Particle tracking, Nanocarrier, Confocal microscopy, Mean square displacement, ImageJ, MATLAB
1 Introduction
1.1 Real-Time Particle Tracking
Nanocarriers for drug or gene delivery have a number of potential advantages over systemic drug delivery, including more specific targeting and higher efficiency. However, the success of these therapeutics can often be limited by how effectively they reach target organelles—a process potentially made difficult by the number of intracellular biological barriers to nanocarrier delivery. For example, nanocarriers can be hindered by the highly crowded cytoplasm, which includes a dense cytoskeletal network. Even if gene delivery vectors or other nucleus-targeted nanocarriers are able to navigate the cytoplasm and reach the perinuclear region, they still may be blocked from entering the nucleus. Understanding the dynamics and transport mechanisms of nanoparticles inside cells will allow for the design of more intelligent and efficient nanocarriers. Many fluorescence techniques, such as fluorescence recovery after photobleaching (FRAP), only reveal ensemble information about nanocarrier transport dynamics. Real-time particle tracking, in contrast, can reveal both ensemble and individual particle transport information. This technique can be used to extract detailed quantitative nanoparticle transport information, such as diffusivity, velocity, transport mode, and directionality—all of which can be used to characterize the dynamics of intracellular nanocarrier transport (1, 2). Such insight can be harnessed to improve the design and development of novel delivery systems for pharmaceuticals, such as drug and genes.
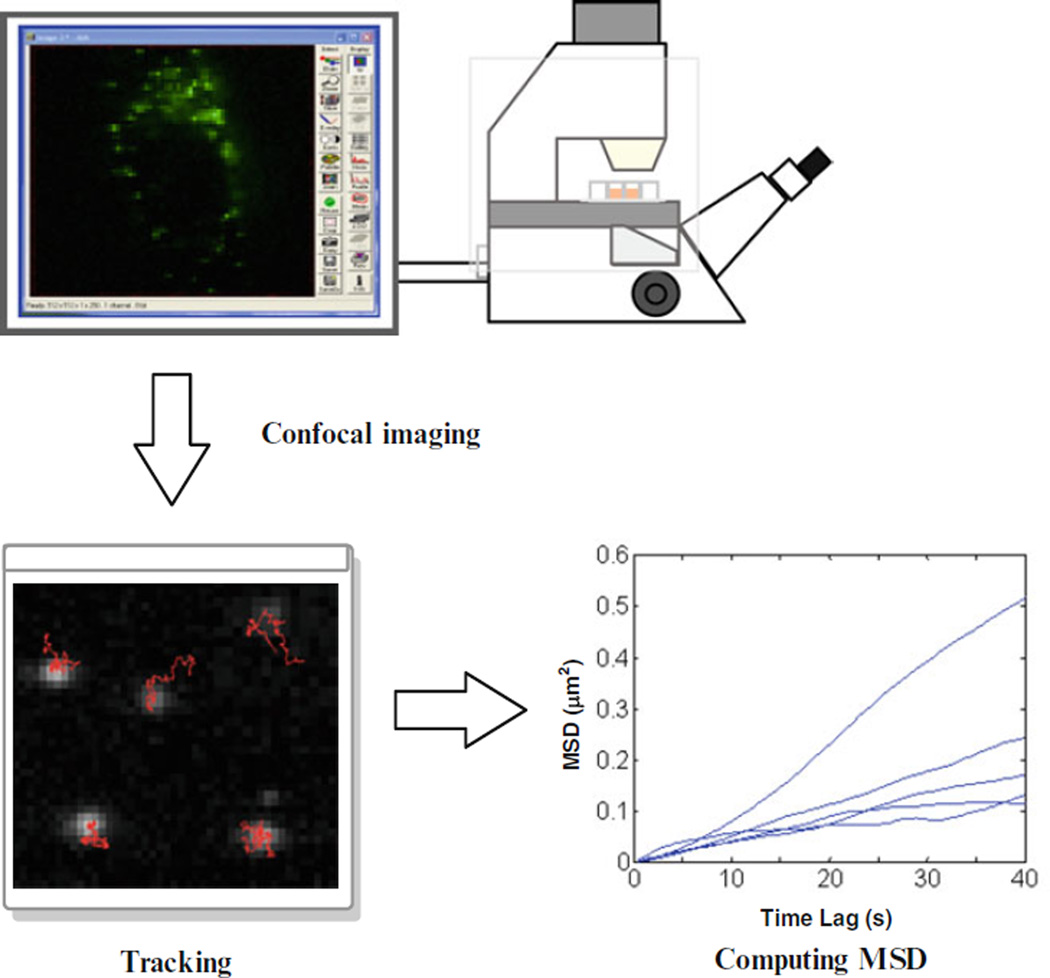
Despite these potential advantages, real-time particle tracking has not been widely used in the field of nanotherapeutics, partially due to the difficulty in understanding the calculations behind the technique. In a typical particle-tracking experiment (Fig. 1), fluorescently labeled nanocarriers are added to live cells and imaged using a fluorescence confocal microscope. Captured high-resolution time-series images are processed to extract x, y coordinate data over time, which are then used to reconstruct the trajectories of the particles. The data are subsequently used to calculate mean square displacement (MSD) and other transport parameters, such as diffusion coefficient, or velocity. This chapter begins by describing the MSD calculation, the core of the data analysis and often a confusing concept, in an approachable way designed for researchers inexperienced with this technique. Additionally, programmatic language is provided in Subheading 3 that explains how to perform the MSD calculation using MATLAB.
Fig. 1.
Steps in a typical real-time particle-tracking experiment. Images are taken of fluorescently labeled nanoparticles inside live cells using confocal microscopy. Next, image analysis is performed to find the particles’ positions in each frame and then to determine the particle trajectories. Finally, mean square displacement (MSD) and other transport parameters are calculated using the trajectory data
Comprehensive instructions are given that detail how to successfully perform the basic procedures in a typical particle-tracking experiment. Specifically, real-time particle tracking of nanoparticles in live cells and in glue samples (for determining tracking resolution) will be described in parallel in Subheading 3. The following procedures will be explained: preparing the glue samples to determine tracking resolution, preparing the live cell imaging samples, imaging samples with a confocal microscope, tracking particles (to determine trajectories) with ImageJ and MATLAB programs, computing MSD, and determining tracking resolution with glued nanoparticles.
1.2 MSD Calculation
MSD is a measure of a particle’s motion which is typically calculated in the analysis stage of a particle-tracking experiment. It is calculated after particle trajectories have been determined, and once calculated, it can be used to derive other transport parameters, such as diffusivity. Two-dimensional MSD is most commonly used for intracellular tracking and therefore will be discussed in this chapter. MSD, <Δr2(τ)>, is determined as a function of time lag, τn = nΔt, where Δt is the time between frames and n is the number of time intervals. MSD is calculated by finding the average particle square displacement for all possible time lags for a particle trajectory, where square displacements between frames can easily be calculated using the x and y coordinate data from the particle trajectories,
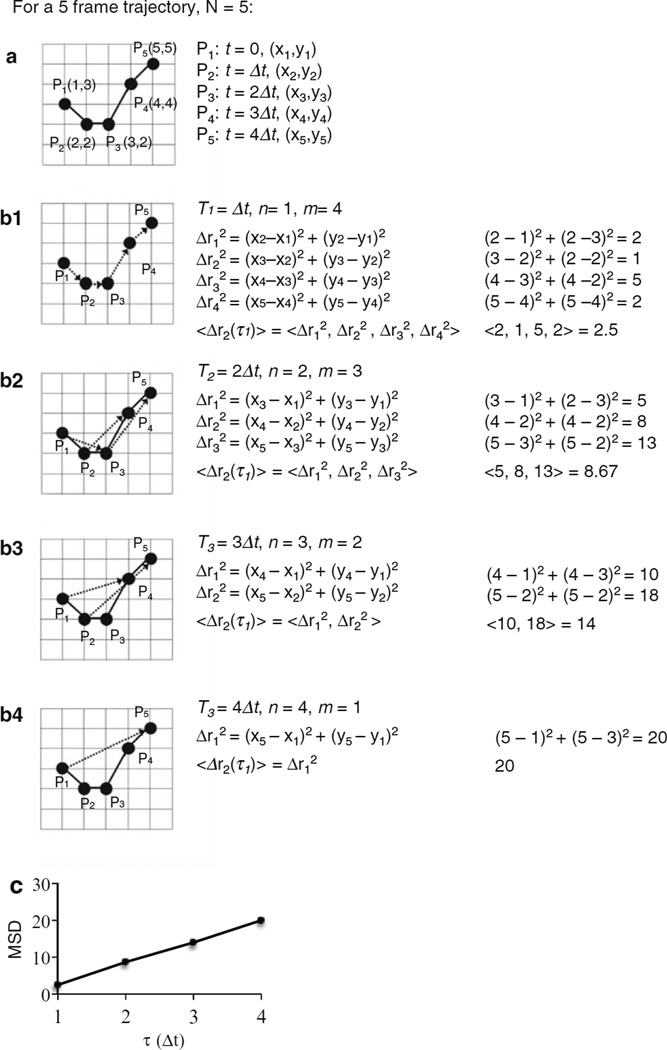
For the smallest τ (n = 1), the particle square displacements are simply the square displacements between each frame. For time lags longer than one frame interval, the particle displacements are calculated between all frames that are of that particular time lag apart. For example, if the time lag is 3-frame intervals (n = 3), then particle displacement would be calculated between frames 1 and 4, frames 2 and 5, frames 3 and 6, etc. Note that each τn for all integer values of n from 1 to N − 1 should be used, where N is the total number of frames for that trajectory. As an example, Fig. 2 demonstrates the mean square displacement calculation for the case of a five-frame trajectory. The number of displacements, m, that can be computed for a particular time lag is m = N − n. For example, for the smallest time lag τ = Δt, there are N − 1 displacement values; for the largest time lag, between frame 1 and frame N, τ = (N − 1)Δt, there is only 1 displacement value.
Fig. 2.
Example MSD calculation for a five-frame trajectory. (a) Particle positions in each frame, where Pi denotes the and position for each frame, i. The displacement squared, Δri2 = (xi+n − xi)2 + (yi+n − yi)2, is calculated between the x,y particle positions in frames that are time intervals apart, with n increasing by 1 for each successive time lag. (b1–b4) Displacements used for a time lag of τn = nΔt, where = 1, 2, 3, and 4, and the corresponding calculations to find MSD for each time lag. m = N−n is the number of displacements,. The displacements used are denoted by the arrow. For example, (b2) depicts the displacements used for τ = 2Δt, so the square displacements are calculated between particle positions in frames that are 2 time intervals apart. Note that displacements are not simply calculated between particles in every second frame (P1→P3, P3→P5). Rather, displacements are calculated between particles in all frames that are 2 time intervals apart (P1→P3, P2→P4, P3→P5), as shown by the arrow. Once all the square displacements have been found for a particular time lag, the mean of those displacements is calculated, Δr2 = <Δr12, …, Δrm2>. Finally, MSD is typically plotted as a function of time lag, as shown in (c), to allow for further analysis of transport parameters
Once all of the displacements have been found for a particular time lag, the MSD for that time lag can be calculated by finding the arithmetic mean of the square of the displacements <Δr2(τ)> = <Δr12, Δr22, …, ΔrN−n2>, where <…> denotes mean. Mathematically, the following equation summarizes the calculation of two-dimensional MSD of a given trajectory of x, y coordinates at a particular τn:
Next, ensemble MSD can be determined across all particles. To calculate ensemble MSD, a simple arithmetic mean of the MSD’s of all particle trajectories in an experiment is determined. Note that longer trajectories and smaller time scales both result in more displacement values, and thus more statistically meaningful MSD calculations. Therefore, MSD values calculated using the upper range of the time lag or using very short trajectories are considered unreliable since few displacement values were used in these calculations. More discussions of MSD calculation and various transport parameters that can be derived from it are found in references (3–10).
2 Materials
2.1 Cell Culture
HeLa cells (ATCC).
Complete medium: Dulbecco’s Modified Eagle’s Medium (Life Technologies, Grand Island, NY, USA) supplemented with 10% fetal bovine serum and 1% penicillin/streptomycin.
Phosphate buffered saline (PBS): 137 mM NaCl, 2.7 mM KCl, 10 mM Na2HPO4, 2 mM KH2PO4, pH 7.4.
0.25% trypsin–EDTA for cell passing.
2.2 Imaging
Carboxylate-Modified FluoSpheres polystyrene nanoparticles (Life Technologies, Grand Island, NY, USA), red (580/605 nm), 100 nm, 2% in weight.
Hoechst 34580 if nucleus identification is desired.
Microscope slides and coverslips.
Loctite 495 superglue.
Lab-Tek™ 8-well chambered coverglass (culture area = 0.8 cm2/well) (Thermo Fisher Scientific, Waltham, MA, USA).
LSM 5 LIVE confocal microscope (Zeiss, Thornwood, NY, USA) with a 63×/1.4 oil objective, the appropriate filters for the nanoparticles being studied, and an environmental chamber maintained at 37°C and 5% CO2.
2.3 Image Processing and Data Analysis
For tracking particles with ImageJ, a “spot tracker” plug-in needs to be downloaded from http://bigwww.epfl.ch/sage/soft/spottracker/ and installed. Documentation of the plug-in is in Ref. 11.
MATLAB 7.0 (MathWorks) or newer needs to be installed for MSD calculation and particle tracking with MATLAB. For tracking particles with MATLAB, download publicly available subroutines and instruction document “Instructions_feature_track_pretrack.pdf” from the Maria Kilfoil research group Web site, http://people.umass.edu/kilfoil/downloads.html in “Particle pretracking and tracking and 2D feature finding” section. Store all M-files in the current directory. MATLAB’s Image Processing Toolbox is also required.
3 Methods
3.1 Cell Culture
Maintain cells in complete medium at 37°C in 5% CO2.
Pass cells at 1:10 ratio every 3–4 days.
3.2 Preparing Glue Sample to Determine Tracking Resolution
Dilute PSNP 1:100 in ultrapure water.
Spot 10 µL of the PSNP solution onto a microscope slide, and spot a small amount of superglue (about 50–100 µL) on top of the PSNP.
Press down a coverslip over the glue and wait until dry.
3.3 Preparing Live Cell Imaging Sample
Plate cells onto a Lab-Tek 8-well chambered coverglass at density of 2 × 10⁴ cells/well (20% confluency), and incubate in complete medium for 24 h.
Replace the medium with 0.4 mL fresh complete medium containing 0.1 mg/mL PSNP (see Note 1).
Incubate samples for desired time (usually 15 min to 24 h), at 37°C and 5% CO2.
If nucleus identification is desired, add medium containing 1 µg/mL Hoechst to cells and incubate at 37°C for 30 min before imaging (see Note 2 for an alternative nuclear labeling method).
Wash cells with PBS and replenish with medium.
3.4 Imaging Sample with Confocal Microscope
Using a high-magnification objective (63× oil), perform time-series imaging for 200 frames at 50 ms per frame with a 2× zoom (see Note 3). For imaging glued particles, find a population of beads near the glue/particle interface where the particles are immobilized by the glue. For imaging particles in living cells, find the best focal plane with reference to the Hoechst-stained cell nucleus. A single image with both Hoechst channel and nanoparticle channel can be taken before and after the time-series images to ensure that the images stay on the same optical plane.
3.5 Tracking Particles with Image J
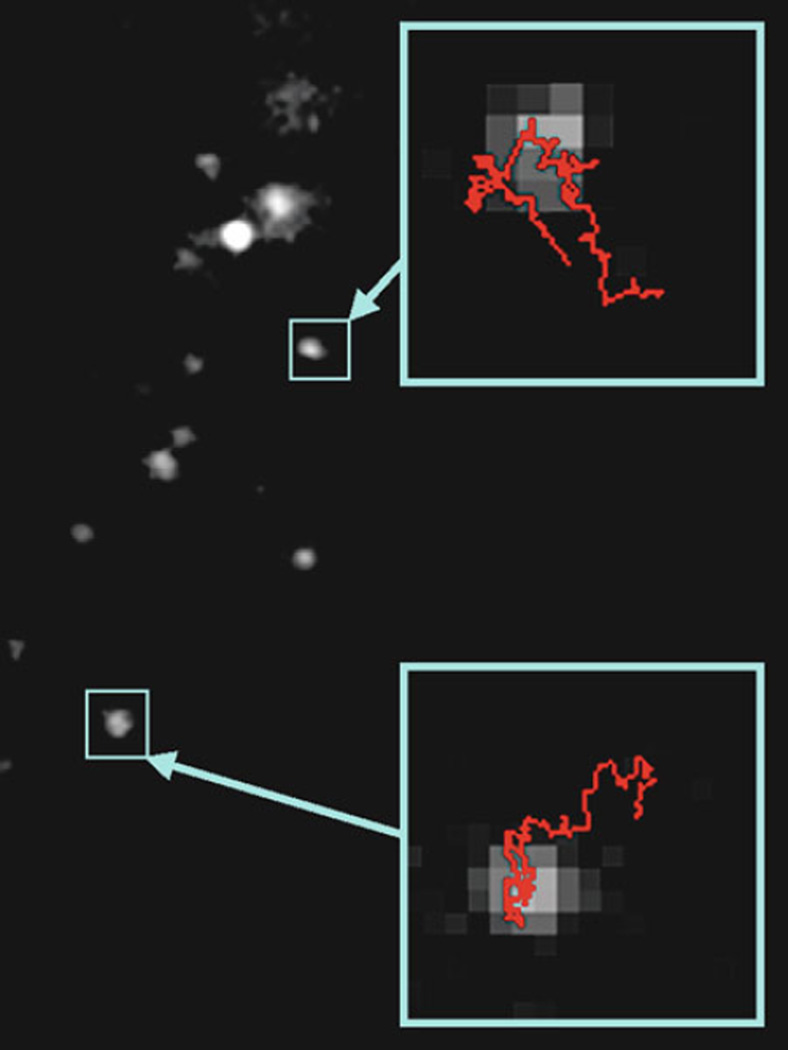
The ImageJ plug-in explained below can only track one particle at a time in a time-series image stack that was obtained from the confocal imaging. See Fig. 3 for PSNP trajectories obtained with ImageJ.
Open the time-series file with ImageJ, and crop the stack of images to the particle to be tracked by drawing a rectangle around it and selecting image>crop, making sure that the particle stays within the field of view during the frames to be tracked.
Select plug-ins>spot tracker>spot tracker 2D.
Draw a small rectangle around the particle and select Add to specify the initial location of the particle.
Modify the parameters of the plug-in to fit the time-series properties. Maximum displacement refers to the maximum movement in pixels below which the particle can be successfully tracked. The other parameters (intensity factor, intensity variation, movement constraint, and center constraint) specify the different weights for the cost function of the algorithm. More information can be obtained by clicking Help.
Click Track to obtain a table of the tracking data, which includes x position, y position, confidence interval, pixel intensity at the center, velocity from one frame to the next, and a mean intensity over a 1 × 1 pixel window. At this point, Display Results can be chosen to visualize the trajectory of the particle.
After performing the tracking, the plug-in will output the data in a table that includes frame number, x position, y position, and various other quantities that may be desired. This table can be copied and further analyzed to calculate other useful parameters such as MSD. Select File>Save As… to save table in .xls format.
Fig. 3.
Example trajectories (insets) obtained with ImageJ spot tracker plug-in for PSNPs
3.6 Tracking with MATLAB Programs
The MATLAB programs from Maria Kilfoil research group can track multiple particles simultaneously. The following procedure is based on a complete tutorial written by Vincent Pelletier and Maria Kilfoil (Instructions_feature_track_pretrack.pdf). Small changes must be made to the program files to run on Macintosh computers (see Note 4).
The following explains the default arrangement of the files (for custom arrangement, see Note 5). Organize images from each experiment into one root folder containing subfolders named “fov#” with a different # for each field of view. Each subfolder should contain time-series images named “fov#_####.tif,” with the first # referring to the subfolder and the second #### referring to the index of the frame in four-digit format. The root folder should contain time information vectors called “time” and saved as “fov#times.mat” with the # referring to the corresponding subfolder. All downloaded M-files should also be stored in the root folder. In MATLAB, make the root folder the current directory.
Run mpretrack_intit.m to determine the correct parameters for accepting real particles and rejecting false features. This function requires inputting basepath, featsize (size of the feature), barint (minimum intensity), barrg (maximum Rg squared), barcc (maximum eccentricity), IdivRg (minimum ratio of Intensity/pixel), fovn (ID# for the series of images), frame (frame number of a representative image), and three more optional parameters. The inputs for all functions are detailed in the comments found in the function files and the tutorial.
The output of mpretrack_init.m will be a matrix containing accepted features (MT) and a matrix containing rejected features (M2). These matrices contain the following columns from left to right (all units in pixels or pixels^2): x positions, y positions, integrated intensity, square radius of gyration, and eccentricity. A figure with accepted features surrounded by green circles and rejected features in red will be displayed. It takes several runs to optimize the input parameters until the correct features are accepted.
Run mpretrack.m using as inputs basepath, fovn, numframes (number of frames in the series), the parameters optimized in step 3, and three other optional parameters. This function creates a matrix named MT containing accepted features for all frames in that field of view. MT has the same first five columns as the output of mpretrack.init.m, as well as a sixth column for frame number and a seventh column for the image time (taken from fov#_times.mat). This matrix is stored as the following file: (basepath ‘Feature_finding MT_#_Feat_Size_#.mat’).
Run fancytrack.m to determine trajectories from particle data determined by mpretrack.m. The following are inputs for fancytrack.m: basepath, FOVnum (field of view number), featsize (feature size for accessing the right MT file), and optional trajectory parameters, maxdisp (maximum displacement the particle may make between successive frames), goodenough (minimum length requirement, in number of frames, for a trajectory to be retained), and memory (how many consecutive frames a feature is allowed to skip). If unsatisfactory trajectories are determined, an empty matrix is output, or errors occur, try optimizing these optional trajectory parameters. For example, the default of optional parameter goodenough is 100 and may cause errors if the total number of frames is near or less than 100.
The output of fancytrack.m is a file named res_fov#.mat (# refers to the field of view number) in the folder (basepath ‘Bead_tracking\res_files\’). This file contains a matrix, res, with the same first seven columns as the output from step 4 (MT) and an additional eighth column containing the trajectory ID number. The matrix is automatically saved in .mat form. If desired, MATLAB’s built-in function xlswrite can be used to save the matrix as an excel spreadsheet; however, this is not necessary if MSD is calculated using MATLAB as described in Subheading 3.7.
3.7 Computing MSD with MATLAB
Format data outputted from ImageJ or other tracking software to X, Y vectors. If the trajectories are different in length, then the data need to be trimmed to the same length. Usually a trajectory that has more than 200 frames is sufficient for statistically significant calculations (see Note 6).
-
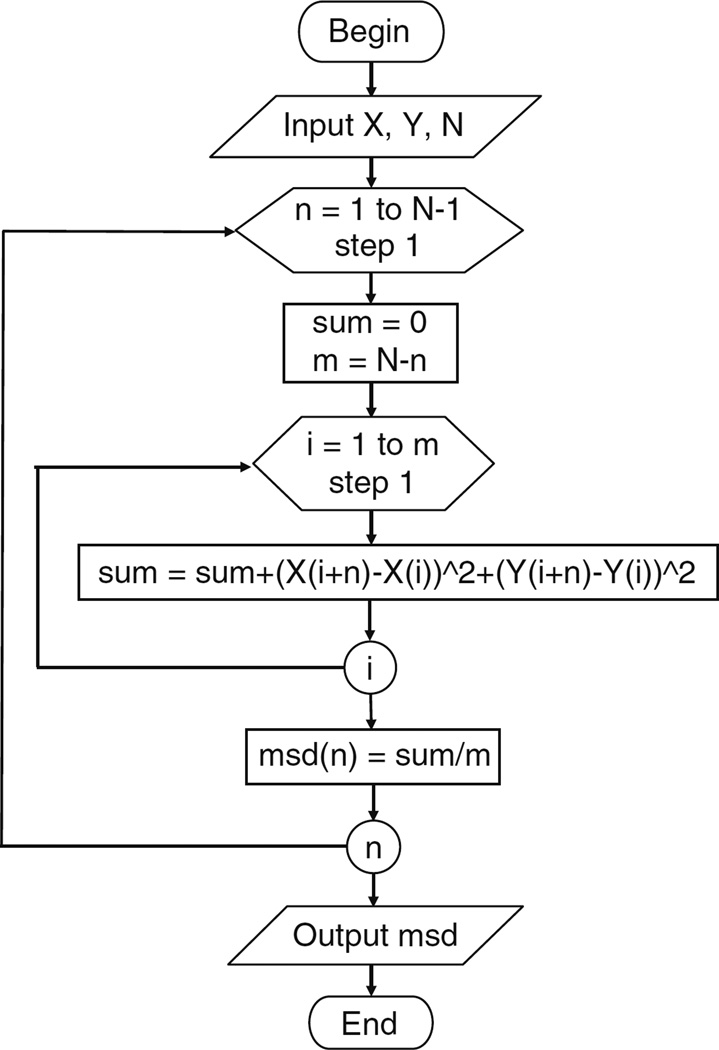
Create a subroutine for computing MSD of one trajectory. A main program needs to be created to calculate multiple trajectories by calling this subroutine in a loop. The following pseudo-code of the subroutine can be translated easily to MATLAB code (see Fig. 4 for flowchart). X, Y vectors are the position data, N is number of frames, and msd is the calculated MSD vector. Note that the frame interval and the time lag vectors are not needed in the computation.
MSD computing subroutine:Begin input X, Y, N for n = 1 to N−1 sum = 0 m = N−n for i = 1 to m sum = sum + (X(i + n)−X(i))^2 + (Y(i + n)−Y(i))^2 msd(n) = sum/m; output msd End Ensemble MSD can be computed by averaging MSD of all particles. For an MSD with N time lags, the first N − 100 points are considered significant (see Note 6).
Fig. 4.
Flowchart of a subroutine for computing MSD of a single trajectory. X and Y are the particle position vectors, N is the total number of frames, n is the number of time intervals for a particular time lag, m is the number of displacements for a particular n, and i is the index of m
3.8 Determining Tracking Resolution from Glued Nanoparticles
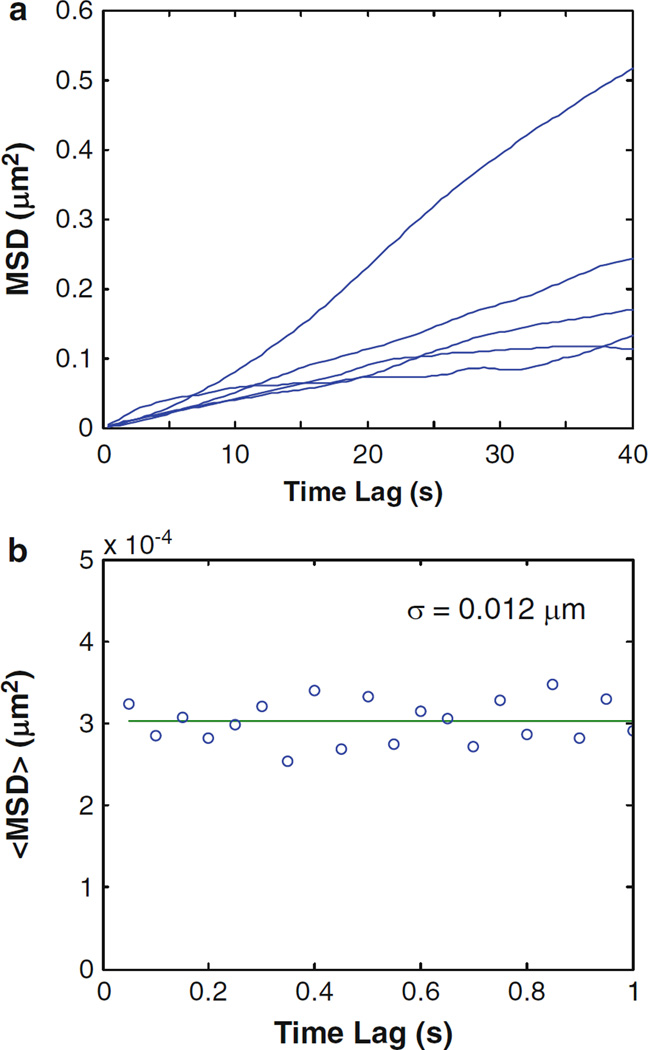
The glued particles are immobile and will reflect the vibrational noise of the experimental setup. Thus, by calculating the MSD of glued PSNP, the tracking resolution of the system is determined. Calculate the arithmetic mean (M) of the first 50 points of the ensemble MSD. Then, use σ = (M/2)1/2 to obtain the tracking resolution σ (see Note 7 and Fig. 5).
Fig. 5.
Example MSD plots of PSNPs. (a) Five PSNPs were tracked in live HeLa cells. (b) PSNPs immobilized with superglue were tracked to determine tracking resolution. Tracking resolution was calculated by taking the mean of the ensemble MSD of the first 20 time lags
Acknowledgment
This work was supported by the National Institutes of Health (RC2GM092599 and T32EB009379).
Footnotes
Too high of a concentration of nanoparticles may complicate particle-tracking image analysis.
Labeling the nucleus helps to locate the plane crossing the cell cytoplasm and nucleus and to assure the nanoparticles are inside the cell. An alternative way to outline the cell is by transfecting it with green fluorescent protein (GFP) plasmid DNA. 24–48 h after transfection, the cytoplasm and nucleus will be labeled with expressed GFP and ready for nanoparticle addition.
Optimal time interval depends on fluorescence properties of particles and how fast the particles are moving. For PSNP endocytosed by mammalian cells, a time interval of 50–400 ms works well. The duration of the movie also depends on whether the cell moves during the course of the movie. To maximize the temporal resolution, excitation laser power needs to be optimized so that the fluorescence signal is strong enough for particle tracking but will not cause sample photobleaching within the recording time.
Mac users need to make minor changes to the program files to account for differences in file path naming. Backward slashes (\) should be changed to forward slashes (/) in the following locations: line 72 of mpretrack_init.m, lines 70 and 77 of mpretrack.m, and lines 51 and 59 of fancytrack.m.
The default arrangement of the files and folders, basepath can be set to null. Readers can customize the arrangement and name format of the folders and image files by changing lines 71 and 72 in mpretrack_init.m and lines 74 and 77 in mpretrack.m, accordingly.
The error of an MSD data point is m−1/2, where m is the number of displacements for a particular time lag. If 10% is an acceptable error, then m = 100 and n = N − 100. Only the MSD of first n time lags are acceptable. If N = 200, then n = 100, i.e., the first 100 points of the MSD are significant.
In practice, <Δr2 (0)> = 2σ2 ≠ 0, due to the errors introduced by experimental conditions and particle-tracking algorithm. Glued PSNPs are assumed to be fixed on the slide during the tracking, thus any displacements are considered to be errors. Therefore, the system tracking resolution is determined by the <Δr2> of the glued PSNPs.
References
- 1.Suh J, et al. Efficient active transport of gene nanocarriers to the cell nucleus. Proc Natl Acad Sci USA. 2003;100:3878–3882. doi: 10.1073/pnas.0636277100. [DOI] [PMC free article] [PubMed] [Google Scholar]
- 2.Huang F, et al. Quantitative nanoparticle tracking: applications to nanomedicine. Nanomedicine. 2011;6(4):693–700. doi: 10.2217/nnm.11.42. [DOI] [PMC free article] [PubMed] [Google Scholar]
- 3.Qian H, et al. Single particle tracking. Analysis of diffusion and flow in two-dimensional systems. Biophys J. 1991;60:910–921. doi: 10.1016/S0006-3495(91)82125-7. [DOI] [PMC free article] [PubMed] [Google Scholar]
- 4.Kusumi A, et al. Confined lateral diffusion of membrane receptors as studied by single particle tracking (nanovid microscopy). Effects of calcium-induced differentiation in cultured epithelial cells. Biophys J. 1993;65:2021–2040. doi: 10.1016/S0006-3495(93)81253-0. [DOI] [PMC free article] [PubMed] [Google Scholar]
- 5.Saxton MJ, Jacobson K. Single-particle tracking: applications to membrane dynamics. Annu Rev Biophys Biomol Struct. 1997;26:373–399. doi: 10.1146/annurev.biophys.26.1.373. [DOI] [PubMed] [Google Scholar]
- 6.Suh J, et al. Real-time multiple-particle tracking: applications to drug and gene delivery. Adv Drug Deliv Rev. 2005;57:63–78. doi: 10.1016/j.addr.2004.06.001. [DOI] [PubMed] [Google Scholar]
- 7.Lai SK, Hanes J. Real-time multiple particle tracking of gene nanocarriers in complex biological environments. Methods Mol Biol. 2008;434:81–97. doi: 10.1007/978-1-60327-248-3_6. [DOI] [PubMed] [Google Scholar]
- 8.Kawai M, et al. Dynamics of different-sized solid-state nanocrystals as tracers for a drug-delivery system in the interstitium of a human tumor xenograft. Breast Cancer Res. 2009;11:R43. doi: 10.1186/bcr2330. [DOI] [PMC free article] [PubMed] [Google Scholar]
- 9.Chen C, Suh J. Real-time particle tracking for studying intracellular transport of nanotherapeutics. In: Weissig V, D’Souza GGM, editors. Organelle-specific pharmaceutical nanotechnology. Hoboken: Wiley; 2010. [Google Scholar]
- 10.Wirtz D. Particle-tracking microrheology of living cells: principles and applications. Annu Rev Biophys. 2009;38:301–326. doi: 10.1146/annurev.biophys.050708.133724. [DOI] [PubMed] [Google Scholar]
- 11.Sage D, et al. Automatic tracking of individual fluorescence particles: application to the study of chromosome dynamics. IEEE Trans Image Process. 2005;14:1372–1383. doi: 10.1109/tip.2005.852787. [DOI] [PubMed] [Google Scholar]


