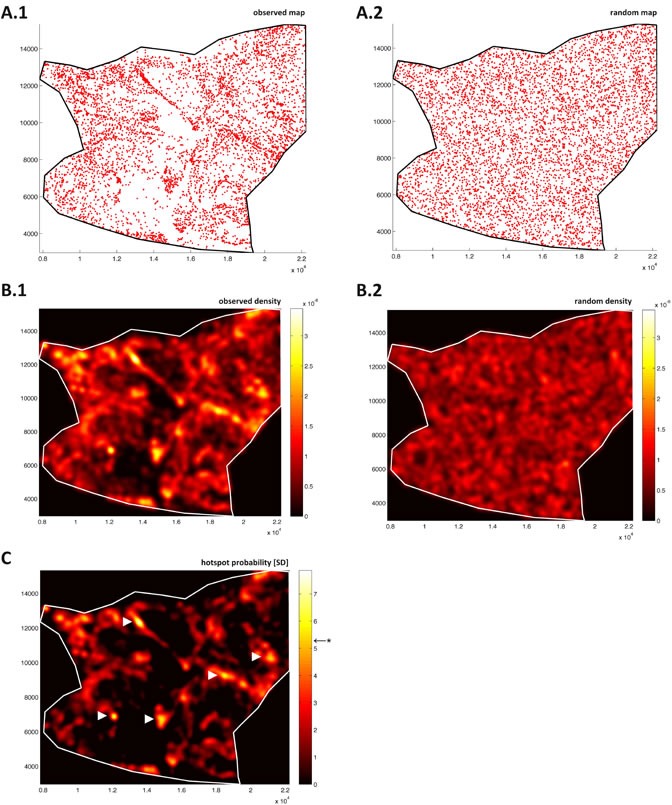
Figure 4. Blood vessels in colorectal tumor tissue show highly significant clustering.

A point map of vessels in colorectal tumor tissue from Figure 2A is shown in A.1. Point map of random pattern A.2. in the same region; microvessel density function of tumor tissue B.1.; density function of the complete spatial randomness (CSR) model B.2.; color-coded units of the density functions are arbitrary. C. Probability map (units: standard deviations of CSR), Bonferroni corrected level of significance is at F = 5.27 (marked by *). Five statistically significant tumor angiogenic hotspots emerge in this region (indicated by arrows).
