

Abstract
Individual variation in the susceptibility of the auditory system to acoustic overstimulation has been well-documented at both the functional and structural levels. However, the molecular mechanism responsible for this variation is unclear. The current investigation was designed to examine the variation patterns of cochlear gene expression using RNA-seq data and to identify the genes with expression variation that increased following acoustic trauma. This study revealed that the constitutive expressions of cochlear genes displayed diverse levels of gene-specific variation. These variation patterns were altered by acoustic trauma; approximately one-third of the examined genes displayed marked increases in their expression variation. Bioinformatics analyses revealed that the genes that exhibited increased variation were functionally related to cell death, biomolecule metabolism, and membrane function. In contrast, the stable genes were primarily related to basic cellular processes, including protein and macromolecular syntheses and transport. There was no functional overlap between the stable and variable genes. Importantly, we demonstrated that glutamate metabolism is related to the variation in the functional response of the cochlea to acoustic overstimulation. Taken together, the results indicate that our analyses of the individual variations in transcriptome changes of cochlear genes provide important information for the identification of genes that potentially contribute to the generation of individual variation in cochlear responses to acoustic overstimulation.
Keywords: Susceptibility, cochlea, noise, gene, glutamate, RNA-sequence
1. Introduction
Acoustic trauma is a significant health problem. Individuals with histories of acoustic overstimulation often suffer from multiple auditory symptoms that include loss of hearing sensitivity, reduction in speech clarity and the occurrence of tinnitus. These auditory dysfunctions stem primarily from structural, biological and molecular changes in the cochlea.
Acoustic trauma exhibits large individual variation. Clinical observations have revealed that individuals who work in environments with similar noise levels often display diverse levels of auditory dysfunction (Pyykkö et al., 2007; Toppila et al., 2000). Similarly, animal studies of cochlear structures have revealed diverse extents of cochlear pathogenesis in response to the same noise conditions (Hunter-Duvar, 1977; Lipscomb et al., 1977; Saunders et al., 1985; Thorne et al., 1984). While this individual variation has been linked to various risk factors, including age, race, blood pressure and eye color (Barrenas et al., 1991; Pyykkö et al., 2007; Toppila et al., 2000), the molecular mechanisms responsible for these individual variations in susceptibility are not completely clear.
Acoustic overstimulation affects cochlear function by altering the molecular regulation of cellular function. Acoustic overstimulation is known to alter the expression patterns of cochlear genes, and these expression changes reflect the molecular responses of the cochlea to noise damage. Expression analyses of cochlear genes have revealed diverse response patterns (Han et al., 2012; Patel et al., 2013). Notably, the expression changes exhibit a large individual variation (Cai et al., 2012). Variations in the expressions of certain genes have been linked to differences in individual susceptibility to acoustic overstimulation (Gratton et al., 2010). Because acoustic trauma has been shown to provoke expression changes in multiple gene families (Jamesdaniel et al., 2011; Patel et al., 2013), profiling the patterns of variation in global expression responses will help to define the complex biological processes that are associated with acoustic trauma. Currently, such individual variation in the transcriptome changes of cochlear genes in responses to acoustic overstimulation remains largely unexplored.
High-throughput analysis of gene expression by RNA-sequencing (RNA-seq) is emerging as a valuable tool for comprehensive analyses of the global gene expression patterns (Mortazavi et al., 2008; Wang et al., 2009). These analyses feature large dynamic ranges and reduced variations in techniques (Bullard et al., 2010; Marioni et al., 2008; Mortazavi et al., 2008). RNA-seq offers an attractive approach to better understanding the extent, basis and function of gene expression variations. Using this technology, we screened the expression changes of cochlear genes in the sensory epithelium after acoustic trauma (Cai et al., 2014; Patel et al., 2013). These analyses revealed the involvement of multiple genes families in the cochlear response to acoustic injury. Moreover, our studies revealed the existence of marked individual variation in gene expression patterns.
The current study was designed to analyze the individual variations in noise-induced transcriptome changes of cochlear genes using RNA-seq data and to define the functional relevance of the genes that exhibited the greatest increases in expression variation following acoustic trauma. We documented the variations in the expression patterns of cochlear genes in control samples that were not subjected to acoustic overstimulation. The observed pattern of variation was altered following the acoustic injury. Approximately one-third of the examined genes exhibited increased variation in their expression levels. Bioinformatics analyses revealed that the genes that exhibited the greatest increases in variation were associated with cell death, biomolecule metabolism and membrane function. In contrast, the genes whose expression levels were the most stable were functionally related to the synthesis and transport of proteins and macromolecules. Based on the results of the analyses of the RNA seq data, we further screened genes that are responsible for mitochondrial function, and this screening revealed that the glutamate metabolism genes were associated with the variation related to the functional effects of acoustic overstimulation. Taken together, the findings of this study suggest that variation analysis of RNA-seq data is a powerful strategy for identifying candidate genes for investigations of the molecular basis of individual variation in the cochlear response to acoustic overstimulation.
2. Materials and Methods
2.1. Animals
CBA/CaJ and C57BL/6J mice (4-8 weeks, male and female, The Jackson Laboratory, Bar Harbor, ME, USA) were used in the current study. The CBA mice were used for generating the RNA-seq data for the variation analysis of cochlear genes. This strain of mice was used because of their late onset of age-related hearing loss. The C57BL/6J mice were used to confirm the involvement of glutamate metabolism in the generation of functional variation in cochlear responses to acoustic overstimulation. This strain of mice was used because it is commonly used as the background strain for genetic modification of gene expression. The C57BL/6J mouse is homozygous for Cdh23ahl and displays the early onset of age-related hearing loss (Erway et al., 1993; Johnson et al., 1997). Moreover, this strain displays increased susceptibility to acoustic trauma (Erway et al., 1996). The numbers of animals (cochleae) used for each experimental condition are described in the subsequent sections and in the Results section. All procedures involving the use and care of the animals were approved by the Institutional Animal Care and Use Committee of the State University of New York at Buffalo.
2.2. Experimental procedures
All animals received a baseline hearing evaluation using the auditory brainstem response (ABR) and the mice that exhibited normal hearing sensitivity were included in the study. For the RNA-seq analysis, intra-subject comparison was performed to reduce the influence of systemic variation in gene expression on the analysis of the local effects of noise. One ear canal of the mouse was blocked to prevent acoustic overstimulation, and the other ear was exposed to the noise. One day after the noise exposure, the animals were killed under deep anesthesia with CO2, and the cochleae were collected for RNA-seq analyses. For the qRT-PCR array confirmation analysis, the mice were exposed to the noise. One day after the noise exposure, the ABRs were measured again, and the animals were then killed under deep anesthesia with CO2. The organ of Corti tissues were collected for PCR-array analyses. For the pathological analyses, the animals were exposed to the noise, the ABRs were measured 14 to 17 days later, and the animals were then killed. The cochleae were collected for pathological analyses.
2.3. Acoustic overstimulation
A continuous noise with the spectrum ranging from 1–7 kHz was used to induce acoustic injury to the cochlea. The noise level was set at 120 dB (sound pressure level, re 20 μPa) at the level of mice head and the duration of the exposure was 1 hour. This noise signal was generated by a real-time signal processor (RP2.1; Tucker-Davis Technologies, TDT), and was subsequently routed through an attenuator (PA5; TDT) and a power amplifier (Crown XLS 202; Harman International Company) to a loudspeaker (NSD2005-8; Eminence). The noise level was calibrated with a condenser microphone (LDL 2559; Larson Davis) that was placed in the animal's holding cage at head level. The microphone output was sent to a preamplifier (model 825; Larson Davis) and was read through a sound level meter (model 800 B; Larson Davis).
2.4. Auditory brainstem response measurement
ABR was measured to assess the hearing sensitivity of the subjects. The animal was anesthetized with an intraperitoneal injection of ketamine (87 mg/kg) and xylazine (3 mg/kg) and was placed on a heating pad (Homeothermic Blanket Control Unit; Harvard Apparatus) to keep its body temperature at 37.5 °C. The ABRs were elicited with tone bursts at 4, 8, 16, and 32 kHz (0.5 ms rise/fall Blackman ramp, 1 ms duration, alternating phase) at a rate of 21 bursts/s. The surface electrodes were placed subdermally over the vertex (non-inverting input) and posterior to the stimulated (inverting input) and nonstimulated ears (ground) of the animal. The outputs of the electrodes were delivered to a preamplifier/base station (RA4LI and RA4PA/RA16B; TDT, Tucker-Davis Technologies, Alachua, FL, USA). The responses were filtered (100–3000 Hz), amplified, averaged using TDT hardware and software, and stored and displayed on a computer. The ABRs were performed in both the normal condition and after the noise exposure (see the Results section for details on the time points of the measurements). The ABR threshold was defined as the lowest intensity that reliably elicited detectable responses.
2.5. Collection of the sensory epithelium for RNA-seq analysis
For the RNA-seq analysis, the animals were killed 1 day after the noise exposure. Both the right and left cochleae were quickly removed from the skull and placed in an RNA-stabilizing reagent (RNAlater; Qiagen, Valencia, CA, USA). The bony shell of the cochlea facing the middle ear cavity and the lateral wall of the cochlea were carefully removed. Next, the sensory epithelium in the cochlear region approximately 50 to 80 % from the apex was gently separated from the modiolus of the cochlea. The isolated tissue was transferred to an RNase-free PCR tube and stored at −80°C until the subsequent gene expression analysis. The tissue from one cochlea was used to generate one sample. There were four biological replicates for each control and noise group.
2.6. Collection of the organ of Corti for the qRT-PCR array analysis
The animals were sacrificed one day after noise exposure. The cochleae were collected and placed in ice old Hanks solution for quick processing to remove the bony shell over the first cochlear turn and the modiolus. Next, the cochleae were placed in the RNAlater solution for further dissection to collect the organ of Corti using a micro-dissection technique that was described in our previous study (Cai et al., 2013). The tissue from one cochlea was used to generate one sample. The collected samples were placed in PCR tubes and stored in −70 °C before total RNA extraction. There were four biological replicates for each control and noise group.
2.7. Isolation of total RNA
Total RNA was isolated from either the cochlear sensory epithelium or the organ of Corti using an RNA isolation kit (RNeasy Plus Mini Kit, Qiagen). The cochlear tissue was physically disrupted using a rotor-stator homogenizer in 150 μl Qiazol lysis buffer for 30 seconds. The solution was incubated for 10 min at room temperature and then 50 μl of chloroform was added. The mixture was shaken vigorously for 15 seconds, incubated for 5 min at room temperature, and then centrifuged (12,000 rpm) for 15 min at 4 °C. The upper clear aqueous layer was transferred into a centrifuge tube and combined with 175 μl of 75% ethanol, mixed and passed through a spin column (provided in the Qiagen RNeasy Mini Kit) and centrifuged at 8000 rpm for 20 sec. The solution was washed with the manufacturer-provided buffer three times. Finally, total RNA was collected in 30 μl of RNase free water. The quantity and quality of collected total RNA were evaluated using an Agilent Bioanalyzer 2100 (Agilent Technologies, Santa Clara, CA). The RNA Integrity Number (RIN) and the total RNA concentration were determined using procedures that were described in our previous publication (Patel et al., 2013).
2.8. RNA sequencing
RNA-seq analyses were performed to define the expression profile of cochlear genes in the sensory epithelium. The synthesis of cDNA from the total RNA for each sample was performed with the Clontech SMARTer™ Ultra Low RNA Kit (Clontech Laboratories Inc., Mountain View, CA). From each cDNA sample, a sequencing library was prepared using the Illumina Paired End Sample Prep Kit (Illumina Inc., San Diego, CA) according to the Illumina Ultra Low Input mRNA-Seq Protocol. The average insert size of the libraries was 124 bp. Each cDNA library was sequenced in a 50-cycle single read flow cell lane on an Illumina HiSeq 2000. Four biological repeats were performed for each experimental condition and each sample was generated from a single cochlear sensory epithelium.
For the RNA-seq data analysis, the sequence results were aligned to the mouse reference genome sequence (USCS Genome Browser, mm10) using TopHat version 1.3.2 (Trapnell et al., 2009) and Bowtie (Langmead et al., 2009). The resulting alignments were further assembled and annotated using Cufflinks software (Trapnell et al., 2010). The abundance of the gene expression was normalized to the fragments per kilobase of exon model per million mapped reads (FPKM) (Mortazavi et al., 2008).
2.9. qRT-PCR array
qRT-PCR array analysis was performed to profile the expression pattern of mitochondrial function genes in the tissues of the organ of Corti collected from the control ears, the ears with moderate damage and the ears with severe damage. We used PCR array plates (PAMM-087ZD-12, Qiagen, Valencia, CA, USA) that contain 84 mitochondrial function genes and 5 reference genes. The protocol to isolate the total RNA, synthesize and pre-amplify the cDNA and run the qRT-PCR reactions was performed as previously described (Cai et al., 2013). Briefly, the isolated total RNA was used to generate cDNA, and the cDNA was pre-amplified using the RT2 Nano PreAMP cDNA Synthesis Kit (Qiagen, Valencia, CA, USA). The synthesized cDNA was mixed with RT2 Real-Time PCR SYBR Green/Fluorescein Master Mix (Qiagen, Valencia, CA, USA), transferred to a 96-well plate and used to perform qRT-PCR on a Bio-Rad CFX Real-Time PCR System. The quality control for the mRNA quantification was performed using three integrated control assays in the PCR array: a reverse transcription control, a positive PCR control, and a genomic DNA control. All PCR runs passed the control tests.
2.10. Protection of one ear from the acoustic overstimulation
We used intra-subject comparisons for the variation analyses of the RNA-seq data. One ear of each mouse was exposed to the noise, and the other ear was blocked from the noise and served as the control. To block the ear canal, the animal was anesthetized with an intraperitoneal injection of ketamine (87 mg/kg) and xylazine (3 mg/kg). Under a surgical microscope, silicon grease (Dow Corning Corporation, Midland, MI) was gently pushed into the ear canal to fill the canal using a syringe with a fine needle. ABR analysis revealed that the ear canal blockage created a significant attenuation of input sounds that averaged 57.8 ± 10.9 dB, which was sufficient to prevent any threshold shifts when the animals were exposed to the noise.
2.11. Bioinformatics analysis of the functional implications of the cochlear genes
The Database for Annotation, Visualization and Integrated Discovery (DAVID) was used to identify the functional relevance of the genes identified via the variation analysis of the expression patterns. The identified genes were uploaded to the database for enriched GO term analyses to determine the relevant functional clusters (biological processes). Moreover, Kyoto Encyclopedia of Genes and Genomes (KEGG)-pathway and Panther-pathway analyses were performed through the DAVID database to determine the molecular pathways that were associated with the identified genes. The criterion of P < 0.05 was used to identify the relevant pathways and biological processes.
2.12. Pathological analysis
Morphological examinations of the sensory epithelia were performed to determine the levels of sensory cell damage. The animals were killed under deep anesthesia with CO2, and the cochleae were fixed with 10% buffered formalin. After dissection, the sensory epithelium was stained with FITC-phalloidin to visualize the cuticular plates using a procedure that has been previously described (Hu et al., 2002b). Briefly, the tissues were incubated for 30 min in a staining solution that contained fluorescein isothiocyanate (FITC)-phalloidin (1:250, Sigma-Aldrich), 0.25% Triton-X-100 and 1% bovine serum albumin. After the F-actin staining, the tissues were mounted on slides containing an anti-fade medium (ProLong™ Antifade kit, Life Technologies). The missing hair cells were quantified based on the presence or absence of the fluorescence of FITC- phalloidin in the cuticular plates.
2.13. Data analyses
All values are represented as the mean ± the standard deviation. The significance of the changes and differences between conditions were examined using two statistical programs, i.e., SigmaStat for Windows V. 3.5 and Prism 5 for Windows. Based on the experimental designs, one-way ANOVAs, two-way ANOVAs, Student's t tests, or Pearson's correlation analyses (see the Results section for details) were performed. The results were considered statistically significant only if the P value was < 0.05.
For the variation analyses of the RNA-seq data, we calculated the percentage change of the coefficients of variation (CV) value for each gene using the following equation:
A relative quantification method was used for the analysis of the changes in the expressions of the genes related to mitochondrial function (Livak et al., 2001). The expression level of a given gene was first normalized to the average level of the reference genes (i.e., Actb, Gapdh, Gusb and Hsp90ab1) to generate a ΔCt value. The ΔΔCt value was then calculated with the following formula: ΔCt (an experimental group) -ΔCt (a control group). The statistical analyses of the PCR data were accomplished with a web-based software package provided by Qiagen, and the P-value was set to 0.05. Only fold-changes > 1.5 were considered biologically significant.
3. Results
3.1. Expression profiles of the cochlear genes detected in the sensory epithelium
The RNA-seq generated sequence reads. We compared the average read numbers between the noise and the control samples and observed no significant difference between the two groups (Student's t test, t = 1.014, df = 6, P = 0.35, Table 1), which suggested that the RNA-seq raw datasets were relatively consistent between the two group samples. Next, we identified the genes that were detectable in the cochlear sensory epithelia. A threshold value of FPKM < 0.1 was used as the cut-off criterion to filter out the low abundance genes. The numbers of detectable genes for each of the four control samples ranged from 13321 to 14679 (14157 ± 611), and the numbers for each of the four noise samples ranged from 13389 to 14714 (14219 ± 575). There was no significant difference in the average numbers of detected genes between the control and noise samples (Student's t test, t = -0.147 df = 6, P = 0.89, Table 2). To reduce the rate of false positive identification, we considered a gene to be expressed in the cochlear sensory epithelium only when its FPKM value was greater than the cut-off value in all examined samples. This digital inventory of expression data was used for the following analyses of the individual variations.
Table 1. The numbers of reads in the control and the noise samples.
| Control group | Noise group | |
|---|---|---|
| Subject 1 | 55,418,554 | 54,520,647 |
| Subject 2 | 76,054,269 | 56,802,014 |
| Subject 3 | 52,965,010 | 33,806,938 |
| Subject 4 | 40,784,841 | 43,405,709 |
| Average | 56,305,668 | 47,133,827 |
| SD | 14,638,422 | 10,638,668 |
Table 2. The numbers of genes detected in the sensory epithelium of the cochlea.
| Control Group | Noise Group | |
|---|---|---|
| Genes detected in individual samples | ||
| Subject 1 | 13321 | 13389 |
| Subject 2 | 14679 | 14714 |
| Subject 3 | 14540 | 14360 |
| Subject 4 | 14088 | 14412 |
| # of genes detected in all samples | 12407 | 12294 |
Note: mm10 assembly was used for the alignment of reads to generate the annotated genes.
3.2. The control samples display diverse levels of variation in FPKM values across the examined genes
To determine the pattern of the variations in the FPKM values, we first examined the overall correlations of the expression levels of the cochlear genes across the samples. Pearson's correlations were performed for the FPKMs between each pair of the four biological replicates. The correlation coefficients across the sample pairs ranged from 9.2 to 9.7 (Fig. 1) with an average r value of 0.95 ± 0.02 (mean ± SD). These findings suggest a high degree of correlation of the overall expression levels across the individual samples.
Figure 1.

Correlation analyses of the FPKM values between each pair of normal control samples. (A) Sample 1 and sample 2. (B) Sample 1 and Sample 3. (C) Sample 1 and Sample 4. (D) Sample 2 and sample 3. (E) Sample 2 and Sample 4. (F) Sample 3 and Sample 4. The FPKM values are highly correlated between the sample pairs.
We then calculated the CVs of the FPKMs across the four biological replicates for each gene. The CV is the ratio of the standard deviation to the mean and is commonly used as a measure of the dispersion of the probability distribution of a dataset with variable means. As shown in Fig. 2A, the cochlear genes exhibited diverse CV values. A large number of genes exhibited CV values between 20% and 60%. A small group of genes (19.9 %) exhibited CV values greater than 80%. This analysis revealed the presence of diverse levels of variation in the FPKM values across the individual genes.
Figure 2.

Analyses of the coefficients of variation (CVs) of the FPKM values of the normal control samples (n = 4 biological repeats). (A) The numbers of genes in each CV value range. A large portion of the genes display the CV values in the range from 20 to 80%. (B) The Pearson's correlation analysis of the CV values and FPKM values of the cochlear genes. The two parameters are weakly correlated. (C) The distribution of the FPKM values for the genes with different CV values. The dots represent the values of the individual genes, and the red horizontal lines represent the mean values. The average FPKM values are significantly different between these four CV ranges (Kruskal-Wallis one-way analysis of variance on ranks, H = 1274.8, df = 3, P < 0.001; Dunn's post-hoc test, P < 0.05). The groups with lower FPKM values exhibit higher CV values on average.
It has been reported that less abundant genes display higher levels of inconsistency in expression analyses (McIntyre et al., 2011; Mortazavi et al., 2008). Therefore, we determined whether the CV variations observed in the current investigation were associated with the FPKM values. Overall, the Pearson's correlation analyses revealed a weak correlation between the CV and FPKM values of the genes (r = -0.37, P < 0.001; Fig. 2B). To further analyze this correlation, we divided the detected genes into four categories based on their CVs (i.e., < =5%, > 5% to =50%; >50% to =80%, and > 80%) and compared the average FPKM values between these four groups using the Kruskal-Wallis one-way analysis of variance on ranks. We observed a general trend that the groups with lower FPKM values had higher CV values on average (H = 1274.8, df = 3, P < 0.001; Dunn's post-hoc test, P < 0.05, Fig. 2C). A small number of genes exhibited either very small or very large CV values. The genes that exhibited small variations tended to be those with relatively higher expression levels. The genes that exhibited large variations tended to be those with relatively lower expression levels. However, there was a large overlap of the expression levels of the genes with different CV values, particularly for those genes with CV values between 5 and 80%.
3.3. Acoustic trauma increases individual variation in the expression of cochlear genes
We sought to determine how individual variation changes after acoustic overstimulation. We first compared the CV values for the genes detected in both the control and noise samples. We observed an increase in the average CV value from 33.9% ± 19.8% in the control samples to 36.2% ± 20.0% in the noise samples (Student's t test, t = -8.64, df = 23242, P < 0.001; Fig. 3A). We further analyzed the percentage change in the CV value of each gene to determine the changes in CVs across individual genes. As shown in a Bland-Altman plot (Fig. 3B), both increases and decreases in the CV values were present. However, overall, the increase was much greater than the decrease, which indicated that increases in CV were the defining feature of the variation. Noticeably, a small group of genes displayed marked increases in CV following acoustic overstimulation (marked in red dots in Fig. 3B).
Figure 3.

Changes in the expression variations of cochlear genes after acoustic injury. (A) Comparison of the average CV values between the normal samples (n = 4) and the noise samples (n = 4). The average CV value of the noise samples is slightly but significantly greater than that of the control samples (Student's t test, t = -8.64, df = 23242, P < 0.001). (B) Bland-Altman plot showing the increases and decreases in CV values following the acoustic trauma. The dots represent the percentage changes in the CV values of the individual genes. Positive values represent increases in expression variation, and negative values represent decreases in expression variation. The red dots represent the 500 genes that exhibit the greatest CV changes. These genes were used for bioinformatics analysis of the functional relevance of the unstable genes. The x-axis is the sum of the CVs from the control and noise groups. (C) Venn diagram showing the numbers and percentages of genes in the stable, increased and decreased CV categories. (D) Comparison of the average Pearson's correlation coefficients for each pair of samples between the control and noise groups (Student's t test, t =-2.4; df = 10; P < 0.05).
Next, we categorized the genes into the following three groups based on their percentage changes in CV values: stable genes, genes with increased variation, and the genes with decreased variation. Specifically, the stable genes were those with percentage CV changes equal to or below 25 %. The genes that were defined as exhibiting increased or decreased variation were those with absolute CV changes that exceeded 25%. A total of 4480 genes (38.5% of the 11636 total genes that were detected in both the control and noise samples) displayed increases in CV, and 2966 genes (25.5% of the 11636 total) displayed decreases in CV (Fig. 3C) following acoustic overstimulation. The remaining 4176 genes (36% of the total 11636) exhibited changes in CV that did not exceed 25%. This analysis indicated that the numbers of genes in each of these categories were similar.
Finally, we performed Pearson's correlation analyses of the gene expressions between individual sample pairs. The correlation coefficients between the noise sample pairs ranged from 0.85 to 0.92. The average r value decreased from 0.95 ± 0.02 for the normal samples to 0.90 ± 0.04 for the noise samples (Fig. 3D, Student's t test, t =-2.4; df = 10; P < 0.05). These analyses suggested that the strength of the expression correlation was reduced after noise exposure, which is consistent with the results of the analyses of the changes in CV. Taken together, these observations revealed an increase in the variation of gene expression following acoustic trauma.
3.4. Bioinformatic analyses of the cochlear genes that exhibited increased expression variations
To examine the functional references of the genes that exhibited increased variation after the acoustic injury, we performed bioinformatic analyses to determine the biological processes and pathways that were associated with these genes. We selected the 500 genes that exhibited the largest changes in CV value after the acoustic trauma and input this gene list into the Database for Annotation, Visualization and Integrated Discovery (DAVID) (Dennis et al., 2003). The gene ontology analysis extracted 56 terms with 15 terms with P values < 0.05 (Table 3). These terms included cell death and apoptosis. The finding of apoptosis is consistent with our previous finding that apoptosis is a major cell death pathway in noise-damaged cochlear pathogenesis (Hu et al., 2002b; Jamesdaniel et al., 2011). Moreover, many of the molecular processes were related to the biosynthesis and metabolism of phosphate, nitrogen, and amino acid derivatives.
Table 3. Cellular processes associated with the genes that exhibited the increased expression variation.
| Terms | P Value | Genes |
|---|---|---|
| Cell death | 0.0154 | Traf2, Fkbp8, Lyz2, Lyz1, Aifm3, Madd, Klf11, Malt1, Sod1, Stk4, Scrib, C8g, Irak3, Rad21, Gspt1, Bok, Sharpin, Psen2, Luc7l3, Phlda1 |
| Death | 0.0193 | Traf2, Fkbp8, Lyz2, Lyz1, Aifm3, Madd, Klf11, Malt1, Sod1, Stk4, Scrib, C8g, Irak3, Rad21, Gspt1, Bok, Sharpin, Psen2, Luc7L3, Phlda1 |
| Nitrogen compound biosynthetic process | 0.0333 | Nmnat3, Mocs2, Ctps, Cox10, Snca, Azin1, Rp2h, Dhodh, Aldh4a1, Adsl, Thnsl1, Impdh1, Nmnat1 |
| Cellular amino acid derivative metabolic process | 0.0347 | Ly6e, Snca, Azin1, Sod1, Tpmt, Chpt1, Eif5a2, Gstp1 |
| Protein catabolic process | 0.0356 | Otud5, Traf2, Anapc4, Senp8, Malt1, Ube2ql1, Senp7, Lnpep, Rnf125, Cblb, Ubr7, Pias3, Psma4, Ubr5, Psen2, Fbxl5, Usp47, Mdm2, Klhl20, Zer1 |
| Phosphate metabolic process | 0.0382 | Efna1, Erbb3, Nek1, Cent1, Snca, 4930444a02rik, Mapkapk2, Acp1, Lats1, Irak3, Il12rb1, Adck2, Snrk, Gnptab, Dusp15, Ptpla, Map2k7, Sgk3, Madd, Nlk, Trim28, Axl, Scyl3, Sod1, Stk4, Mtmr11, Grk6, Fuk |
| Phosphorus metabolic process | 0.0382 | Efna1, Erbb3, Nek1, Ccnt1, Snca, 4930444a02riK, Mapkapk2, Acp1, Lats1, Irak3, Il12rb1, Adck2, Snrk, Gnptab, Dusp15, Ptpla, Map2k7, Sgk3, Madd, Nlk, Trim28, Axl, Scyl3, Sod1, Stk4, Mtmr11, Grk6, Fuk |
| Actin filament-based process | 0.0390 | Pfn2, Limch1, Arhgef18, Capza1, Myo9b, Racgap1, Itgb1, Rhou, Rhog |
| Phosphorylation | 0.0415 | Sgk3, Madd, Erbb3, Efna1, Nek1, Nlk, Trim28, Ccnt1, Snck, Axl, 4930444a02riK, Scyl3, Mapkapk2, Sod1, Lats1, Stk4, Irak3, Il12rb1, Adck2, Snrk, Gnptab, Grk6, Fuk, Map2k7 |
| Membrane depolarization | 0.0431 | Aifm3, Snca, Edn1, Park7 |
| Cell wall macromolecule metabolic process | 0.0464 | Lyz2, Lyz1, Oxr1 |
| Cell wall macromolecule catabolic process | 0.0464 | Lyz2, Lyz1, Oxr1 |
| Apoptosis | 0.0483 | Traf2, Fkbp8, Aifm3, Madd, Klf11, Malt1, Sod1, Stk4, Scrib, Irak3, Rad21, Gspt1, Bok, Sharpin, Psen2, Luc7l3, Phlda1 |
| Macromolecule catabolic process | 0.0486 | Otud5, Traf2, Eif2c1, Anapc4, Senp8, Malt1, Ube2ql1, Sod1, Senp7, Lnpep, Rnf125, Cblb, Ubr7, Pias3, Psma4, Ubr5, Psen2, Fbxl5, Usp47, Mdm2, Klhl20, Zer1 |
| Oxidoreduction coenzyme metabolic process | 0.0493 | Nmnat3, Dcxr, Pdss2, Nmnat1 |
For the pathway analyses, we used the Panther and KEGG pathway databases. The Panther pathway captured the apoptosis signaling pathway, which was consistent with the results of the annotation analysis. The KEGG pathway analysis revealed four enriched pathways, and the top pathway was related to alanine, aspartate and glutamate metabolism (Table 4).
Table 4. Molecular pathways associated with the genes that exhibited the increased expression variation.
| Pathways | P Value | Genes |
|---|---|---|
| Alanine, aspartate and glutamate metabolism | 0.0295 | Gls, Adsl, Aldh4a1, Gpt |
| Terpenoid backbone biosynthesis | 0.0388 | Idi1, Acat1, Pdss2 |
| Pyrimidine metabolism | 0.0660 | Itpa, Ctps, Pole, Dhodh, Entpd6, Txnrd1 |
| Neurotrophin signaling pathway | 0.0740 | Irak3, Mapkapk2, Zfp369, Pik3r3, Map2k7, Calm2, Arhgdib |
For comparison, we also examined the functional references of the stable genes. We selected the 505 genes that exhibited CV changes below 3% following the noise exposure and uploaded these genes to DAVID. The gene ontology analysis captured 50 terms, among which 31 displayed P values < 0.05 (Table 5). These terms were primarily related to basic biological processes, protein transport and the cell cycle. There were no cell death related terms. Moreover, the KEGG and Panther pathway analyses revealed multiple molecular pathways (Table 6). None of these pathways overlapped with those identified for the genes that exhibited large CV changes. These analyses suggest that the genes that exhibited increased CV values and the genes that exhibited stable CV values had different functional relevance.
Table 5. Cellular processes associated with the stable genes.
| Terms | P Value | Genes |
|---|---|---|
| Translation | 0.0003 | Mrpl2, Brf1, Rpl36, Rpl27, Rps15a, Rps3, Ighmbp2, Mrps18c, Mrpl14, Eif3h, Ncoa5, Nars2, Rpl9, Rps12, Fau, Rpl37a, Rps11, Rps20, Eif2b3, Mars |
| Protein transport | 0.0005 | Vps29, Pacs1, Sec24b, Chmp4c, Rab5c, Rasl2-9, Use1, Tomm7, Rab11b, Exoc4, Cep290, Exoc3, Dopey2, Sec22c, Snap23, Appbp2, Ap2m1, Sys1, Txnip, Rrbp1, Snupn, Rab4a, Vti1b, Vps41, Stxbp4, Ywhag, Cadps2, Rab5a, Slc15a4, Mrpl45, Stx5a |
| Establishment of protein localization | 0.0005 | Vps29, Pacs1, Sec24b, Chmp4c, Rab5c, Rasl2-9, Use1, Tomm7, Rab11b, Exoc4, Cep290, Exoc3, Dopey2, Sec22c, Snap23, Appbp2, Ap2m1, Sys1, Txnip, Rrbp1, Snupn, Rab4a, Vti1b, Vps41, Stxbp4, Ywhag, Cadps2, Rab5a, Slc15a4, Mrpl45, Stx5a |
| Protein localization | 0.0012 | Vps29, Pacs1, Sec24b, Chmp4c, Rab5c, Tln2, Rasl2-9, Use1, Akap10,Tomm7, Rab11b, Exoc4, Cep290, Exoc3, Dopey2, Sec22c, Snap23, Appbp2, Ap2m1, Sys1, Txnip, Rrbp1, Snupn, Rab4a, Vti1b, Vps41, Stxbp4, Ywhag, Cadps2, Rab5a, Slc15a4, Mrpl45, Stx5a |
| Protein polymerization | 0.0025 | Gm6682, Ang, Tubb5, Tubg1, Gas7, Tuba1b |
| Cell cycle phase | 0.0058 | Ppp2r3a, Rasl2-9, Anapc10, Sirt2, Nde1, Sycp3, Ccnd2, Rsph1, Psmc3ip, Cdc123, Tubb5, Zfp830, Camk2b, Tubg1, Gadd45a, Nek6, Tfdp1 |
| Mitotic cell cycle | 0.0061 | Ppp2r3a, Rasl2-9, Anapc10, Sirt2, Nde1, Sycp3, Ccnd2, Cdc123, Zfp830, Camk2b, Tubg1, Gadd45a, Nek6, Tfdp1 |
| Interphase of mitotic cell cycle | 0.0062 | Ppp2r3a, Ccnd2, Cdc123, Camk2b, Gadd45a, Tfdp1 |
| Interphase | 0.0073 | Ppp2r3a, Ccnd2, Cdc123, Camk2b, Gadd45a, Tfdp1 |
| Intracellular transport | 0.0081 | Pacs1, Vps29, Txnip, Sec24b, Htatip2, Kif5b, Snupn, Rasl2-9, Use1, Vti1b, Vps41, Stxbp4, Nde1, Ywhag, Tomm7, Appbp2, Ehd1, Mrpl45, Stx5a, Ap2m1 |
| Transcription, DNA-dependent | 0.0091 | Phrf1, Polr2f, Brf1, Ptrf, Ang, Thrap3, Gtf2h3, Lipe, Mars |
| RNA biosynthetic process | 0.0110 | Phrf1, Polr2f, Brf1, Ptrf, Ang, Thrap3, Gtf2h3, Lipe, Mars |
| Cell cycle | 0.0123 | Gas2l3, S100a6, Ppp2r3a, Rasl2-9, Anapc10, Bccip, Nde1, Cdkn2c, Rsph1, Psmc3ip, Cdc123, Tubb5, Camk2b, Zfp830, Tubg1, Tfdp1, Txnip, Sirt2, Sycp3, Mapk6, Ccnd2, Mapk3, Cdk20, Gadd45a, Nek6 |
| Cell cycle process | 0.0141 | Gas2l3, Ppp2r3a, Rasl2-9, Anapc10, Sirt2, Nde1, Sycp3, Ccnd2, Rsph1, Psmc3ip, Cdc123, Tubb5, Zfp830, Camk2b, Tubg1, Gadd45a, Nek6, Tfdp1 |
| Cellular macromolecular complex subunit organization | 0.0151 | Gm6682, Hist1h2be, Mbd2, Gas7, Tarbp2, Ptrf, Tbca, Ang, Tubb5, Celf2, Tubg1, Tuba1b, Smarca4 |
| Cellular protein complex assembly | 0.0152 | Gm6682, Ang, Tbca, Tubb5, Tubg1, Mbd2, Gas7, Tuba1b |
| Cellular macromolecular complex assembly | 0.0156 | Tarbp2, Gm6682, Hist1h2be, Ang, Tbca, Tubb5, Celf2, Tubg1, Mbd2, Gas7, Tuba1b, Smarca4 |
| Macromolecular complex assembly | 0.0167 | Gm6682, Brf1, Hist1h2be, Mbd2, Gas7, Ighmbp2, Tarbp2, Ptrf, Tbca, Ang, Tubb5, Celf2, Tubg1, Tuba1b, Lipe, Smarca4 |
| RNA processing | 0.0185 | Phrf1, Tsen54, Pusl1, Magoh, Ints2, Prpf19, Sf3b1, Ints8, Tarbp2, Ppih, Hnrnpk, Ctu1, Jmjd6, Srrm2, Dbr1, Wdr12, Celf2, Ddx54, Dus4l |
| Protein ubiquitination | 0.0209 | Bmi1, Prpf19, Ube4b, Traf7, Cbx8, Stub1 |
| Protein complex biogenesis | 0.0211 | Ighmbp2, Gm6682, Brf1, Ptrf, Ang, Tbca, Tubb5, Tubg1, Mbd2, Gas7, Tuba1b, Lipe |
| Protein complex assembly | 0.0211 | Ighmbp2, Gm6682, Brf1, Ptrf, Ang, Tbca, Tubb5, Tubg1, Mbd2, Gas7, Tuba1b, Lipe |
| Small GTPase mediated signal transduction | 0.0218 | Ralgps2, Rab5c, Rab4a, Mras, Ptplad1, Rfxank, Cdc42ep1, Rab11b, Rem1, Rab5a, Rras, Sdcbp, Rap1b |
| Transcription | 0.0259 | Bmi1, Ascc1, Foxo1, Pawr, Cbx8, Rfxank, Ighmbp2, Med28, Ang, Med26, Anp32a, Cep290, Zfp275, Sertad1, Zfp239, Nfkbiz, Phrf1, Brf1, Sox11, Zfp628, Ccnl1, Gtf2h3, Hmg20a, Mbd2, Zfp593, Ptrf, Zmiz1, Ncoa5, Zfp710, Irx3, Polr2f, Zfp397, Trib3, Ctnnd1, Zfp758, Zfp110, Nr1d1, Zfp523, Traf7, Mars, Tfdp1, Zfp251, Txnip, Zbtb7a, Klf12, Smad6, Hdac2, Jmjd6, Atxn7, Thrap3, Irf3, Zbtb3, Ddx54, Tbl1x, Ncor1, Lipe |
| Insulin receptor signaling pathway | 0.0288 | Slc2a8, Foxo1, Stxbp4, Pik3r1 |
| Macromolecular complex subunit organization | 0.0318 | Gm6682, Brf1, Hist1h2be, Mbd2, Gas7, Ighmbp2, Tarbp2, Ptrf, Tbca, Ang, Tubb5, Celf2, Tubg1, Tuba1b, Lipe, Smarca4 |
| Vesicle-mediated transport | 0.0321 | Pacs1, Vps29, Sec24b, Mrc2, Dennd1a, Use1, Vps41, Fnbp1, Cadps2, Jmjd6, Rab5a, Exoc4, Exoc3, Sec22c, Snap23, Ehd1, Stx5a, Epn1, Ap2m1 |
| Intracellular protein transport | 0.0341 | Txnip, Pacs1, Sec24b, Snupn, Rasl2-9, Vti1b, Vps41, Stxbp4, Ywhag, Tomm7, Mrpl45, Stx5a, Ap2m1 |
| Protein modification by small protein conjugation | 0.0412 | Bmi1, Prpf19, Ube4b, Traf7, Cbx8, Stub1 |
| Lipid biosynthetic process | 0.0420 | Cyp51, Scd1, Scd2, Hsd17b12, Prkab1, Fads2, Pisd, Pigs, Tecr, Aldh1a1, Prpf19, Ang, Gal3st1 |
| Gene silencing | 0.0476 | Tarbp2, Cbx8, Kcnq1, Sirt2, Smarca4 |
Table 6. Molecular pathways associated with the stable genes.
| Pathways | P Value | Genes |
|---|---|---|
| KEGG pathway analysis | ||
| Biosynthesis of unsaturated fatty acids | 0.0009 | Scd1, Acox1, Scd2, Hsd17b12, Fads2, Tecr |
| Ribosome | 0.0009 | Rpl9, Rps12, Rpl36, Rps15a, Rpl27, Fau, Rpl37a, Rps20, Rps11, Rps3 |
| Endocytosis | 0.0125 | Chmp4c, Rab5c, Rab4a, Cxcr2, Hspa1a, Cblc, Rab11b, Rab5a, Ehd1, Hspa8, Epn1, Iqsec1, Ap2m1 |
| Oxidative phosphorylation | 0.0320 | Ndufa2, Atp5j2, Cox7a2, Atp6ap1, Atp6v1e1, Atp6v1g2, Ndufc1, Uqcrq, Cox5b |
| Gap junction | 0.0357 | Gm6682, Adcy6, Mapk3, Tubb5, Pdgfd, Tuba1b, Prkx |
| Proteasome | 0.0443 | Psma1, Psmc6, Psma5, Psmd1, Psma7 |
| Alpha-Linolenic acid metabolism | 0.0922 | Acox1, Pla2g4a, Fads2 |
| SNARE interactions in vesicular transport | 0.0935 | Use1, Vti1b, Snap23, Stx5a |
| Insulin signaling pathway | 0.0994 | Cblc, Prkar2a, Mapk3, Prkab1, Foxo1, Pik3r1, Lipe, Prkx |
| Pattern pathway analysis | ||
| Parkinson disease | 0.0102 | Psma1, Ywhag, Psma5, Mapk3, Hspa1a, Psma7, Fbxw11, Stub1, Hspa8 |
| Transcription regulation by bZIP transcription factor | 0.0921 | Prkar2a, Polr2f, Brf1, Psmc3ip, Gtf2h3 |
3.5. Expression changes in mitochondrial glutamate carrier genes are associated with the level of noise-induced auditory dysfunction
As described above, the KEGG pathway analysis captured the glutamate metabolism as a biological process associated with the variable genes (see Table 4). We sought to provide additional evidence for the involvement of glutamate metabolism in cochlear susceptibility to acoustic trauma by examining whether genes that related to glutamate metabolism respond differently in cochleae showing different levels of susceptibility to acoustic overstimulation.
C57BL/6J mice were used in this analysis. We selected this strain of mice because these mice were commonly used as the background strain for genetic modification of gene expression. Moreover, we had used this strain of mice in our previous studies of acoustic trauma, so that the data from the current study could be analyzed with the consideration of our previous observations. We first examined the individual variations in functional loss and cochlear pathogenesis in the mice following acoustic overstimulation. The numbers of missing outer hair cells were quantified 14 to 17 days after the noise exposure after the permanent damage had developed. The cochleae were labeled with FITC-phalloidin, and the middle to basal sections of the cochleae (30-100 % of the distance from the apex) were examined. As shown in the cochleogram (Fig. 4A), losses of outer hair cells were identified in the entire length of the examined section, and more prevalent damage was identified in the basal end of the cochlea. Noticeably, there was substantial individual variation in the total numbers of missing outer hair cells across the individual cochleae (Fig. 4B). Moreover, the ABR assessments revealed substantial variation in the threshold shifts, which ranged from 31 to 58.8 dB (Fig. 4C). These observations are consistent with previous observations that individual subjects that are subjected to same acoustic overstimulation develop diverse levels of sensory cell damage (Hunter-Duvar, 1977; Saunders et al., 1985; Thorne et al., 1984).
Figure 4.

Individual variations in the levels of outer hair cell damage and the levels of functional loss. (A) Cochleograms of the missing outer hair cells as a function of the distance from the apex of the cochlea. Each line represents the data of a single cochlea. Large differences in hair cell loss are present across the 15 examined cochleae. (B) Comparison of the total numbers of missing outer hair cells per cochlea. Each dot presents one cochlea. Again, a large variation in the levels of outer hair cell damage is clearly present. (C) ABR threshold shifts in a group of 26 ears that were measured at 14 to 17 days after the acoustic overstimulation. All of the examined ears exhibit threshold shifts, but the levels are different, and the average shifts range from 31 to 58.8 dB.
We then exposed eight additional mice to the noise. On the first day after the noise exposure, the ABRs were measured. Based on the ABR results, we selected the four cochleae that exhibited the greatest hearing threshold shifts and the four that exhibited the smallest hearing threshold shifts. The two groups displayed an average 20 dB difference in their threshold shifts (two-way ANOVA, P < 0.01, Fig. 5A). We sought to determine whether the genes in the severely damaged and moderately damaged cochleae responded differently to the acoustic overstimulation.
Figure 5.
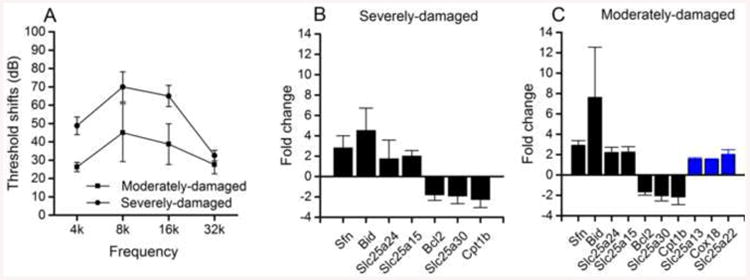
Verification of the involvement of glutamate metabolism-related genes. (A) The average ABR threshold shifts in the four severely damaged and four moderately damaged cochleae measured 1 day after noise exposure. The two groups exhibit an average 20-dB difference in threshold shifts (two-way ANOVA, P < 0.01). (B) Significant changes in the expression levels of the genes related to mitochondrial function in the ears (n = 4) that exhibited greater hearing loss. The positive values represent upregulations, and negative values represent downregulations. (C) Significant changes in the expression levels of the genes related to mitochondrial function in the ears (n = 4) that exhibited less hearing loss. The three blue bars indicate the three genes whose expression levels increased exclusively in the ears that exhibited less hearing loss.
The organ of Corti samples were collected. These samples contained sensory cells (inner and outer hair cells), pillar cells (both inner and outer), Deiters cells, inner phalangeal cells and inner border cells (Cai et al., 2013). An expression analysis of a panel of 84 mitochondrial function-related genes (see the gene list in Table 7) was performed. These genes were selected because mitochondria have been implicated in noise-induced sensory cell degeneration (Chen et al., 2000; Hu, 2007; Nicotera et al., 2003). Moreover, this panel of genes contains two mitochondrial glutamate carrier genes (Slc25a22 and Slc25a13), allowing us to determine whether glutamate metabolism is involved in susceptibility of the cochlea to noise damage. Using qRT-PCR, the expression changes were assessed in the control, severely damaged and moderately damaged groups. Four genes were upregulated and three genes were down-regulated in both the severely damaged and moderately damaged groups (Figs. 5B and 5C). Noticeably, three genes were up-regulated exclusively in the moderately damaged group (Fig. 5C). Among these three damage level-specific genes, two (Slc25a22 and Slc25a13) were mitochondrial glutamate carrier genes, which suggests that glutamate metabolism is involved in generation of diverse levels of functional loss of the cochlea.
Table 7. The list of mitochondrial function related genes used for the PCR array analysis.
| Aifm2 | Cox18 | Immp1l | Pmaip1 | Slc25a15 | Slc25a25 | Stard3 | Timm8b | Ucp1 |
|---|---|---|---|---|---|---|---|---|
| Aip | Cpt1b | Immp2l | Rhot1 | Slc25a16 | Slc25a27 | Taz | Timm9 | Ucp2 |
| Bak1 | Cpt2 | Lrpprc | Rhot2 | Slc25a17 | Slc25a3 | Timm10 | Tomm20 | Ucp3 |
| Bbc3 | Dnajc19 | Mfn1 | Sfn | Slc25a19 | Slc25a30 | Timm17a | Tomm22 | Uxt |
| Bcl2 | Dnm1l | Mfn2 | Sh3glb1 | Slc25a2 | Slc25a31 | Timm17b | Tomm34 | |
| Bcl2l1 | Fis1 | Mipep | Slc25a1 | Slc25a20 | Slc25a37 | Timm22 | Tomm40 | |
| Bid | Timm10b | Msto1 | Slc25a10 | Slc25a21 | Slc25a4 | Timm23 | Tomm40l | |
| Bnip3 | Grpel1 | Mtx2 | Slc25a12 | Slc25a22 | Slc25a5 | Timm44 | Tomm70a | |
| Cdkn2a | Hsp90aa1 | Nefl | Slc25a13 | Slc25a23 | Sod1 | Timm50 | Trp53 | |
| Cox10 | Hspd1 | Opa1 | Slc25a14 | Slc25a24 | Sod2 | Timm8a1 | Tspo |
Finally, we examined the variation patterns of the 84 mitochondrial function genes in the RNA-seq dataset. The three damage level-specific genes displayed increased CV values following the acoustic overstimulation (Fig. 6A). We also examined the FPKM values and the CVs values of these genes in the normal samples. As shown in Figure 6B, the FPKM values of the three damage level-dependent genes were equal to or greater than 2.8, which indicates that these genes were not low abundance genes. Moreover, their CV values ranged from 15.8 to 30.1. These relatively small CV values indicated that the expression levels of these genes were quite constant in the normal condition.
Figure 6.

The variation in the RNA-seq data for the three noise damage level-specific genes. (A) CV percentage changes of the three genes. Notice that all three genes displayed increased CV values following acoustic overstimulation (red dots). The black dots represent the remaining mitochondrial function genes. (B) The CV and FPKM values of the three genes (red dots) in the normal samples. These genes displayed moderate CV values (15.8-30.1%) and FPKM values (9.4 – 16.4).
4. Discussion
Individuals display significant variation in their cochlear responses to acoustic overstimulation (Cody et al., 1983; Hunter-Duvar, 1977; Lipscomb et al., 1977; Pyykkö et al., 2007; Saunders et al., 1985; Thorne et al., 1984; Toppila et al., 2000). To determine the underlying molecular basis of this variation, we used RNA-seq transcriptome datasets to examine the patterns of variation of cochlear gene expression. This study revealed the following major findings. First, expression variation was present under physiological conditions, and this variation was gene-specific. Second, acoustic overstimulation altered the extent of the expression variation of cochlear genes. Although decreases in variation were observed for some genes, increased variation was the core feature of the expression responses. Third, the genes that exhibited increased expression variation were functionally related to cell death and the metabolism of biomolecules including nitrogen, phosphate, amino acid derivatives, macromolecules and proteins. In contrast, the genes that were stable were primarily related to protein synthesis and transport. Finally, we confirmed that glutamate metabolism is related to the variation in the functional responses of the cochleae to acoustic overstimulation. Together, the results of our variation analysis of RNA-seq data revealed the candidate genes and biological processes that can be used for further investigations of the molecular mechanisms responsible for individual variations in cochlear responses to acoustic trauma.
An important finding of the current study is the identification of the biological processes that are functionally relevant to the genes that exhibited the greatest increases in expression variation following acoustic overstimulation. Using DAVID, we revealed 15 biological terms with P values below 0.05. These terms are associated with three biological processes: cell death, biomolecule metabolism, and membrane function and molecule metabolism.
Death, cell death and apoptosis are three terms that are related to the process of cell death. The identification of these terms is consistent with the results of the current pathological observations, which revealed a significant increase in the number of missing outer hair cells following acoustic overstimulation. We have previously shown that apoptosis is a major cell death process involved in cochlear pathogenesis following acoustic overstimulation (Hu et al., 2002a; Hu et al., 2000). Several studies have revealed changes in the expression patterns of apoptotic genes in noise-damaged cochleae (Han et al., 2006; Hu et al., 2009; Vicente-Torres et al., 2006; Yamashita et al., 2004; Yamashita et al., 2008). Here, we demonstrated that the genes that contribute to cell death and apoptosis can exhibit variable response patterns. Among the genes identified in the current study, Sod1 (superoxide dismutase 1, soluble) is an antioxidant enzyme that is responsible for converting superoxide to hydrogen peroxide. Oxidative free radical damage has been found to be a major cause of sensory cell damage (Henderson et al., 2006), and SOD has been linked to the generation of individual variation following acoustic trauma (Carlsson et al., 2005; Ohlemiller et al., 2000). Many of the genes identified in the current investigation have not been linked to acoustic injury. Therefore, future studies verifying their involvement in the regulation of the cochlear response to acoustic overstimulation are expected to provide new insights into the molecular basis of noise-induced cochlear injury.
A large portion of the cellular processes identified in the current study was related to biomolecule metabolisms. Based on the definition provided by the Gene Ontology Consortium, the process of nitrogen compound biosynthetic is related to the chemical reactions and pathways that lead to the formation of organic and inorganic nitrogenous compounds. The cellular amino acid derivative metabolic process is associated with the chemical reactions and pathways that involve molecules derived from amino acids and organic acids that contain one or more amino substituent. The metabolic process of phosphate and phosphorus and phosphorylation are all related to the phosphate group, which occurs in the anion or salt of any phosphoric acid. Many of these biomolecules are important for the regulation of the functional statuses of molecules. For example, protein phosphorylation is an important mechanism in the regulation of protein activity. Protein phosphorylation related to MAPK and JNK signaling has been linked to acoustic trauma (Jamesdaniel et al., 2011; Murai et al., 2008). Given the importance of biomolecule states in the regulation of cellular functions, the genes that participate in the regulation of these molecules are expected to regulate cochlear responses to acoustic overstimulation.
Regarding the pathway analysis, the current variation analysis captured the pathway associated with alanine, aspartate and glutamate metabolism. To confirm this result, we screened the expression changes of the genes related to mitochondrial function using a qRT-PCR array technique. We revealed that two genes, i.e., Slc25A22 and SLC25A13, exhibited damage level-dependent expression changes. Both of these genes are the members of the mitochondrial carrier family and are responsible for glutamate transfer through the mitochondrial membrane. These genes are paralogous (Palmieri, 2013) and are expressed in the inner mitochondrial membrane. Glutamate plays multiple biological roles in cell function. Glutamate is also a neurotransmitter for cochlear inner hair cells. Glutamate toxicity has been linked to acoustic trauma (Jager et al., 2000). Mice that do not express GLAST, a glutamate transporter gene, display increased susceptibility to acoustic overstimulation (Hakuba et al., 2000). The current study provides further evidence in support of the potential role of glutamate metabolism in regulation of cellular responses to acoustic overstimulation. Given the findings that the increases in the expressions of Slc25A22 and SLC25A13 were associated with reductions in cochlear dysfunction, the modulation of the glutamate metabolism might serve as a therapeutic strategy for reducing cochlear cell damage following acoustic overstimulation.
In addition to the variable genes, the current investigation revealed genes that exhibited relatively stable expression patterns following acoustic injury. The bioinformatic analysis revealed that these genes were primarily involved in protein and macromolecule synthesis and transport. Notably, the biological/molecular processes that are associated with the genes that exhibited increased variation did not overlap those associated with the stable genes. This mutually exclusive pattern suggests that the variable genes and the stable genes participate in different cellular processes.
The current study used an RNA-seq dataset to investigate individual variations in gene expression levels. RNA-seq analysis has been shown to exhibit good reproducibility and less variation due to technique (Bullard et al., 2010; Marioni et al., 2008; Mortazavi et al., 2008). However, similar to any other expression analysis method, RNA-seq has intrinsic technical variation. Confounding factors include the length of the exon, sequence composition (e.g., GC-content) and sampling bias associated with library construction (McIntyre et al., 2011; Pickrell et al., 2010; Risso et al., 2011). Moreover, the abundance of the expression of a gene affects the consistency of its expression analysis (McIntyre et al., 2011). In addition to technique variations, confounding factors related to biological variation are present. These biological factors include the gender, age, the time of sample collection and the compositions of the cell populations in the samples (Radich et al., 2004; Whitney et al., 2003). To reduce the influence of these confounding factors, we took several precautionary steps in our experimental design and data analyses. First, the control samples and noise samples were collected from the same subjects. This experimental paradigm allowed us to perform intra-subject comparisons, which reduced the influence of systemic variations in the subjects' biological/molecular backgrounds and the influence of the systemic effects associated with extrinsic factors, such as timing of noise exposure and sample collection, and intrinsic factors, such as hormone and growth factors induced by acoustics overstimulation. Removal of the influence of such systemic effects allows us to focus on the local effects of acoustic injury. It should be noted that intra-subject comparison makes it impossible to examine the systemic effect of acoustic trauma on cochlear gene expression. Second, we used the changes in variation rather than variation level itself as the measure with which the variations in the gene responses to acoustic overstimulation were evaluated. This strategy reduced the influences of technical variation and gene analysis biases that are associated with differences in gene traits, such as sequence composition and expression abundance. Third, we used the normalized expression data (i.e., the FPKM values) for the variation analyses, which reduced the influences of factors such as the sequence lengths of genes. Finally, we focused on the co-varying genes with similar cellular functions rather than functionally unrelated genes. This data analysis strategy likely reduced the possibility of false positive identifications because the likelihood of the false identification of a group of functionally related genes is less than that for functionally unrelated genes.
5. Conclusions
The current study revealed the presence of gene-specific variations in expression levels of cochlear genes under physiological conditions. These variation patterns were altered following acoustic overstimulation. The analysis of the changes in variation identified the genes whose expression variations increased following the acoustic overstimulation. Bioinformatics analyses revealed the functional implications of these genes. Notably, the genes that exhibited the greatest increases in expression variation were functionally relevant to different processes compared with those associated with the stable genes. Moreover, the current study revealed that glutamate metabolism is associated with the individual variation in the functional effect of the acoustic overstimulation. Taken together, our data suggest the value of variation analyses for understanding the molecular mechanisms that are responsible for the generation of individual variation in noise-induced hearing loss.
Highlights.
Acoustic trauma increases the expression variation of cochlear genes.
We identify the genes that exhibit increased variation in their expression.
We reveal the functional implications of identified genes.
Glutamate metabolism is associated with cochlear susceptibility to acoustic trauma.
Variation analysis is a valuable tool for defining gene-specific variation.
Acknowledgments
This research was supported by NIDCD 1R01DC010154 to BH Hu.
Abbreviations
- ABR
Auditory brainstem response
- RNA-seq
RNA-sequence
- CV
Coefficient of variation
- FPKM
Fragments per kilobase of transcript per million fragments mapped
- DAVID
The Database for annotation, visualization and integrated discovery
- KEGG
Kyoto encyclopedia of genes and genomes
Footnotes
Publisher's Disclaimer: This is a PDF file of an unedited manuscript that has been accepted for publication. As a service to our customers we are providing this early version of the manuscript. The manuscript will undergo copyediting, typesetting, and review of the resulting proof before it is published in its final citable form. Please note that during the production process errors may be discovered which could affect the content, and all legal disclaimers that apply to the journal pertain.
Contributor Information
Shuzhi Yang, Email: qits-002@163.com.
Qunfeng Cai, Email: qunfengcai@gmail.com.
Jonathan Bard, Email: jbard@buffalo.edu.
Jennifer Jamison, Email: jjamison@buffalo.edu.
Jianmin Wang, Email: Jianmin.Wang@RoswellPark.org.
Weiping Yang, Email: yangwp301@126.com.
References
- Barrenas ML, Lindgren F. The influence of eye colour on susceptibility to TTS in humans. British journal of audiology. 1991;25:303–7. doi: 10.3109/03005369109076602. [DOI] [PubMed] [Google Scholar]
- Bullard JH, Purdom E, Hansen KD, Dudoit S. Evaluation of statistical methods for normalization and differential expression in mRNA-Seq experiments. BMC bioinformatics. 2010;11:94. doi: 10.1186/1471-2105-11-94. [DOI] [PMC free article] [PubMed] [Google Scholar]
- Cai Q, Patel M, Coling D, Hu BH. Transcriptional changes in adhesion-related genes are site-specific during noise-induced cochlear pathogenesis. Neurobiology of disease. 2012;45:723–32. doi: 10.1016/j.nbd.2011.10.018. [DOI] [PMC free article] [PubMed] [Google Scholar]
- Cai Q, Wang B, Patel M, Yang SM, Hu BH. RNAlater facilitates microdissection of sensory cell-enriched samples from the mouse cochlea for transcriptional analyses. J Neurosci Methods. 2013;219:240–51. doi: 10.1016/j.jneumeth.2013.08.010. [DOI] [PMC free article] [PubMed] [Google Scholar]
- Cai Q, Vethanayagam RR, Yang S, Bard J, Jamison J, Cartwright D, Dong Y, Hu BH. Molecular profile of cochlear immunity in the resident cells of the organ of Corti. Journal of Neuroinflammation. 2014;11:173. doi: 10.1186/s12974-014-0173-8. [DOI] [PMC free article] [PubMed] [Google Scholar]
- Carlsson PI, Van Laer L, Borg E, Bondeson ML, Thys M, Fransen E, Van Camp G. The influence of genetic variation in oxidative stress genes on human noise susceptibility. Hear Res. 2005;202:87–96. doi: 10.1016/j.heares.2004.09.005. [DOI] [PubMed] [Google Scholar]
- Chen GD, McWilliams ML, Fechter LD. Succinate dehydrogenase (SDH) activity in hair cells: a correlate for permanent threshold elevations. Hear Res. 2000;145:91–100. doi: 10.1016/s0378-5955(00)00076-9. [DOI] [PubMed] [Google Scholar]
- Cody AR, Robertson D. Variability of noise-induced damage in the guinea pig cochlea: electrophysiological and morphological correlates after strictly controlled exposures. Hear Res. 1983;9:55–70. doi: 10.1016/0378-5955(83)90134-x. [DOI] [PubMed] [Google Scholar]
- Dennis G, Jr, Sherman BT, Hosack DA, Yang J, Gao W, Lane HC, Lempicki RA. DAVID: Database for Annotation, Visualization, and Integrated Discovery. Genome Biol. 2003;4:3. [PubMed] [Google Scholar]
- Erway LC, Willott JF, Archer JR, Harrison DE. Genetics of age-related hearing loss in mice: I. Inbred and F1 hybrid strains. Hear Res. 1993;65:125–32. doi: 10.1016/0378-5955(93)90207-h. [DOI] [PubMed] [Google Scholar]
- Erway LC, Shiau YW, Davis RR, Krieg EF. Genetics of age-related hearing loss in mice. III. Susceptibility of inbred and F1 hybrid strains to noise-induced hearing loss. Hear Res. 1996;93:181–7. doi: 10.1016/0378-5955(95)00226-x. [DOI] [PubMed] [Google Scholar]
- Gratton MA, Eleftheriadou A, Garcia J, Verduzco E, Martin GK, Lonsbury-Martin BL, Vazquez AE. Noise-induced changes in gene expression in the cochleae of mice differing in their susceptibility to noise damage. Hear Res. 2010 doi: 10.1016/j.heares.2010.12.014. [DOI] [PMC free article] [PubMed] [Google Scholar]
- Hakuba N, Koga K, Gyo K, Usami SI, Tanaka K. Exacerbation of noise-induced hearing loss in mice lacking the glutamate transporter GLAST. J Neurosci. 2000;20:8750–3. doi: 10.1523/JNEUROSCI.20-23-08750.2000. [DOI] [PMC free article] [PubMed] [Google Scholar]
- Han W, Shi X, Nuttall AL. AIF and endoG translocation in noise exposure induced hair cell death. Hear Res. 2006;211:85–95. doi: 10.1016/j.heares.2005.10.004. [DOI] [PubMed] [Google Scholar]
- Han Y, Hong L, Zhong C, Chen Y, Wang Y, Mao X, Zhao D, Qiu J. Identification of new altered genes in rat cochleae with noise-induced hearing loss. Gene. 2012;499:318–22. doi: 10.1016/j.gene.2012.02.042. [DOI] [PubMed] [Google Scholar]
- Henderson D, Bielefeld EC, Harris KC, Hu BH. The Role of Oxidative Stress in Noise-Induced Hearing Loss. Ear Hear. 2006;27:1–19. doi: 10.1097/01.aud.0000191942.36672.f3. [DOI] [PubMed] [Google Scholar]
- Hu BH. Delayed mitochondrial dysfunction in apoptotic hair cells in chinchilla cochleae following exposure to impulse noise. Apoptosis. 2007;12:1025–36. doi: 10.1007/s10495-006-0027-7. [DOI] [PubMed] [Google Scholar]
- Hu BH, Henderson D, Nicotera TM. Involvement of apoptosis in progression of cochlear lesion following exposure to intense noise. Hear Res. 2002a;166:62–71. doi: 10.1016/s0378-5955(02)00286-1. [DOI] [PubMed] [Google Scholar]
- Hu BH, Henderson D, Nicotera TM. F-actin cleavage in apoptotic outer hair cells in chinchilla cochleas exposed to intense noise. Hear Res. 2002b;172:1–9. doi: 10.1016/s0378-5955(01)00361-6. [DOI] [PubMed] [Google Scholar]
- Hu BH, Guo W, Wang PY, Henderson D, Jiang SC. Intense noise-induced apoptosis in hair cells of guinea pig cochleae. Acta Otolaryngol. 2000;120:19–24. [PubMed] [Google Scholar]
- Hu BH, Cai Q, Manohar S, Jiang H, Ding D, Coling DE, Zheng G, Salvi R. Differential expression of apoptosis-related genes in the cochlea of noise-exposed rats. Neuroscience. 2009;161:915–925. doi: 10.1016/j.neuroscience.2009.03.072. [DOI] [PMC free article] [PubMed] [Google Scholar]
- Hunter-Duvar I. Inner ear correlates in acoustic trauma. Trans Sect Otolaryngol Am Acad Ophthalmol Otolaryngol. 1977;84:422. [PubMed] [Google Scholar]
- Jager W, Goiny M, Herrera-Marschitz M, Brundin L, Fransson A, Canlon B. Noise-induced aspartate and glutamate efflux in the guinea pig cochlea and hearing loss. Exp Brain Res. 2000;134:426–34. doi: 10.1007/s002210000470. [DOI] [PubMed] [Google Scholar]
- Jamesdaniel S, Hu B, Kermany MH, Jiang H, Ding D, Coling D, Salvi R. Noise induced changes in the expression of p38/MAPK signaling proteins in the sensory epithelium of the inner ear. Journal of proteomics. 2011;75:410–24. doi: 10.1016/j.jprot.2011.08.007. [DOI] [PMC free article] [PubMed] [Google Scholar]
- Johnson KR, Erway LC, Cook SA, Willott JF, Zheng QY. A major gene affecting age-related hearing loss in C57BL/6J mice. Hear Res. 1997;114:83–92. doi: 10.1016/s0378-5955(97)00155-x. [DOI] [PubMed] [Google Scholar]
- Langmead B, Trapnell C, Pop M, Salzberg SL. Ultrafast and memory-efficient alignment of short DNA sequences to the human genome. Genome Biol. 2009;10:R25. doi: 10.1186/gb-2009-10-3-r25. [DOI] [PMC free article] [PubMed] [Google Scholar]
- Lipscomb DM, Axelsson A, Vertes D, Roettger R, Carrol J. The effect of high level sound on hearing sensitivity, cochlear sensorineuroepithelium and vasculature of the chinchilla. Acta Otolaryngol. 1977;84:44–56. doi: 10.3109/00016487709123941. [DOI] [PubMed] [Google Scholar]
- Livak KJ, Schmittgen TD. Analysis of relative gene expression data using real-time quantitative PCR and the 2(-Delta Delta C(T)) Method. Methods. 2001;25:402–8. doi: 10.1006/meth.2001.1262. [DOI] [PubMed] [Google Scholar]
- Marioni JC, Mason CE, Mane SM, Stephens M, Gilad Y. RNA-seq: an assessment of technical reproducibility and comparison with gene expression arrays. Genome research. 2008;18:1509–17. doi: 10.1101/gr.079558.108. [DOI] [PMC free article] [PubMed] [Google Scholar]
- McIntyre LM, Lopiano KK, Morse AM, Amin V, Oberg AL, Young LJ, Nuzhdin SV. RNA-seq: technical variability and sampling. BMC genomics. 2011;12:293. doi: 10.1186/1471-2164-12-293. [DOI] [PMC free article] [PubMed] [Google Scholar]
- Mortazavi A, Williams BA, McCue K, Schaeffer L, Wold B. Mapping and quantifying mammalian transcriptomes by RNA-Seq. Nature methods. 2008;5:621–8. doi: 10.1038/nmeth.1226. [DOI] [PubMed] [Google Scholar]
- Murai N, Kirkegaard M, Järlebark L, Risling M, Suneson A, Ulfendahl M. Activation of JNK in the inner ear following impulse noise exposure. Journal of neurotrauma. 2008;25:72–77. doi: 10.1089/neu.2007.0346. [DOI] [PubMed] [Google Scholar]
- Nicotera TM, Hu BH, Henderson D. The caspase pathway in noise-induced apoptosis of the chinchilla cochlea. J Assoc Res Otolaryngol. 2003;4:466–77. doi: 10.1007/s10162-002-3038-2. [DOI] [PMC free article] [PubMed] [Google Scholar]
- Ohlemiller KK, McFadden SL, Ding DL, Lear PM, Ho YS. Targeted mutation of the gene for cellular glutathione peroxidase (Gpx1) increases noise-induced hearing loss in mice. Journal of the Association for Research in Otolaryngology. 2000;1:243–254. doi: 10.1007/s101620010043. [DOI] [PMC free article] [PubMed] [Google Scholar]
- Palmieri F. The mitochondrial transporter family SLC25: identification, properties and physiopathology. Molecular aspects of medicine. 2013;34:465–84. doi: 10.1016/j.mam.2012.05.005. [DOI] [PubMed] [Google Scholar]
- Patel M, Hu Z, Bard J, Jamison J, Cai Q, Hu BH. Transcriptome characterization by RNA-Seq reveals the involvement of the complement components in noise-traumatized rat cochleae. Neuroscience. 2013;248C:1–16. doi: 10.1016/j.neuroscience.2013.05.038. [DOI] [PMC free article] [PubMed] [Google Scholar]
- Pickrell JK, Marioni JC, Pai AA, Degner JF, Engelhardt BE, Nkadori E, Veyrieras JB, Stephens M, Gilad Y, Pritchard JK. Understanding mechanisms underlying human gene expression variation with RNA sequencing. Nature. 2010;464:768–72. doi: 10.1038/nature08872. [DOI] [PMC free article] [PubMed] [Google Scholar]
- Pyykkö I, Toppila E, Zou J, Kentala E. Individual susceptibility to noise-induced hearing loss. Audiological Medicine. 2007;5:41–53. [Google Scholar]
- Radich JP, Mao M, Stepaniants S, Biery M, Castle J, Ward T, Schimmack G, Kobayashi S, Carleton M, Lampe J, Linsley PS. Individual-specific variation of gene expression in peripheral blood leukocytes. Genomics. 2004;83:980–8. doi: 10.1016/j.ygeno.2003.12.013. [DOI] [PubMed] [Google Scholar]
- Risso D, Schwartz K, Sherlock G, Dudoit S. GC-content normalization for RNA-Seq data. BMC bioinformatics. 2011;12:480. doi: 10.1186/1471-2105-12-480. [DOI] [PMC free article] [PubMed] [Google Scholar]
- Saunders JC, Dear SP, Schneider ME. The anatomical consequences of acoustic injury: A review and tutorial. J Acoust Soc Am. 1985;78:833–60. doi: 10.1121/1.392915. [DOI] [PubMed] [Google Scholar]
- Thorne PR, Gavin JB, Herdson PB. A quantitative study of the sequence of topographical changes in the organ of Corti following acoustic trauma. Acta Otolaryngol. 1984;97:69–81. doi: 10.3109/00016488409130966. [DOI] [PubMed] [Google Scholar]
- Toppila E, Pyykko II, Starck J, Kaksonen R, Ishizaki H. Individual Risk Factors in the Development of Noise-Induced Hearing Loss. Noise Health. 2000;2:59–70. [PubMed] [Google Scholar]
- Trapnell C, Pachter L, Salzberg SL. TopHat: discovering splice junctions with RNA-Seq. Bioinformatics. 2009;25:1105–11. doi: 10.1093/bioinformatics/btp120. [DOI] [PMC free article] [PubMed] [Google Scholar]
- Trapnell C, Williams BA, Pertea G, Mortazavi A, Kwan G, van Baren MJ, Salzberg SL, Wold BJ, Pachter L. Transcript assembly and quantification by RNA-Seq reveals unannotated transcripts and isoform switching during cell differentiation. Nat Biotechnol. 2010;28:511–5. doi: 10.1038/nbt.1621. [DOI] [PMC free article] [PubMed] [Google Scholar]
- Vicente-Torres MA, Schacht J. A BAD link to mitochondrial cell death in the cochlea of mice with noise-induced hearing loss. J Neurosci Res. 2006;83:1564–72. doi: 10.1002/jnr.20832. [DOI] [PMC free article] [PubMed] [Google Scholar]
- Wang Z, Gerstein M, Snyder M. RNA-Seq: a revolutionary tool for transcriptomics. Nature reviews. Genetics. 2009;10:57–63. doi: 10.1038/nrg2484. [DOI] [PMC free article] [PubMed] [Google Scholar]
- Whitney AR, Diehn M, Popper SJ, Alizadeh AA, Boldrick JC, Relman DA, Brown PO. Individuality and variation in gene expression patterns in human blood. Proc Natl Acad Sci U S A. 2003;100:1896–901. doi: 10.1073/pnas.252784499. [DOI] [PMC free article] [PubMed] [Google Scholar]
- Yamashita D, Miller JM, Jiang HY, Minami SB, Schacht J. AIF and EndoG in noise-induced hearing loss. Neuroreport. 2004;15:2719–22. [PubMed] [Google Scholar]
- Yamashita D, Minami SB, Kanzaki S, Ogawa K, Miller JM. Bcl-2 genes regulate noise-induced hearing loss. J Neurosci Res. 2008;86:920–8. doi: 10.1002/jnr.21533. [DOI] [PubMed] [Google Scholar]