Abstract
Purpose
To identify quantitative MRI parameters associated with diffusion tensor imaging (DTI) and fast bound-pool fraction imaging (FBFI) that may detect alterations in gray matter and/or white matter in adults with Fabry disease, a lysosomal storage disorder.
Materials and Methods
Twelve healthy controls (mean age ± standard deviation: 48.0±12.4 years) and ten participants with Fabry disease (46.7±12.9 years) were imaged at 3.0 T. Whole-brain parametric maps of diffusion tensor metrics (apparent diffusion coefficient (ADC) and fractional anisotropy (FA)) and the bound-pool fraction (f) were acquired. Mean voxel values of parametric maps from regions-of-interest within gray and white matter structures were compared between cases and controls using the independent t-test. Spearman’s rho was used to identify associations between parametric maps and age.
Results
Compared to controls, the left thalamus of Fabry participants had an increase in FA (0.29±0.02 vs. 0.33±0.05, respectively; p=0.030) and a trend towards an increase in ADC (0.73±00.02 vs. 0.76±0.03 μm2/s, respectively; p=0.082). The left posterior white matter demonstrated a reduction in f (10.45±0.37 vs. 9.00±1.84 %, respectively; p=0.035), an increase in ADC (0.78±0.04 vs. 0.94±0.19 μm2/s, respectively; p=0.024), and a trend towards a reduction in FA (0.42±0.07 vs. 0.36±0.08, respectively; p=0.052). Amongst all parameters, only f measured in the left posterior white matter was significantly associated with age in Fabry participants (rho= −0.71, p=0.022).
Conclusions
Parameters derived from DTI and FBFI detect Fabry-related changes in the adult human brain, particularly in the posterior white matter where reductions in myelin density as measured by FBFI appear age related.
Keywords: Fabry disease, quantitative MRI, white matter disease, bound-pool fraction, diffusion tensor imaging, magnetization transfer
INTRODUCTION
Fabry disease is an X-linked lysosomal storage disorder caused by mutations in the GLA gene that result in a deficiency of the enzyme alpha-galactosidase A (1). Qualitative MRI studies initially identified T2-weighted lesions attributable to small vessel disease occurring in both gray matter (GM) and white matter (WM) structures in hemizygous males with Fabry disease (2). Also in hemizygous males, a T1-weighted hyperintensity in the pulvinar was described as distinctly characteristic to Fabry disease (3). In subsequent studies, macroscopic WM lesions (WMLs) apparent on qualitative MRI sequences (e.g. T2WI, FLAIR, magnetization transfer [MT]) were identified in both hemizygous males and heterozygous carrier females at a similar frequency with reports ranging from 30% to 100% in both genders (4-7). Microstructural WM changes identified via diffusion-based quantitative MRI techniques (i.e. diffusion tensor imaging, DTI) have also been identified in both genders with and without coexisting WMLs (8). Monitoring structural changes in Fabry disease is essential since alterations may herald stroke, a life-threatening complication in Fabry disease (9). In addition, the effects of enzyme replacement therapy on the central nervous system in Fabry disease remain ambiguous and some studies have suggested that WMLs may continue to develop regardless of therapy (4, 10). Accordingly, the identification of parameters that quantify GM and WM structure may prove valuable in understanding the natural history of the disease and for evaluating the effects of therapy.
Fast bound-pool fraction imaging (FBFI) is a quantitative MRI technique based on the two-pool model of magnetization transfer (MT) where the bound-pool fraction (f) represents the quantity of protons bound to macromolecules relative to protons bound to water (i.e. the free pool, 1–f) (11). The acquisition of whole-brain voxel-based measurements of f was made time-efficient by identifying constraints for the other parameters in the two-pool model of MT (k, transfer rate constant; T2F and T2B, transverse relaxation time of the free- and bound-pools, respectively), thus reducing the number of Z-spectra data points necessary for parameter fitting and substantially reducing overall scan time (12). The rapid acquisition of the bound-pool fraction was then correlated to histological findings and a strong association with myelin density was identified (12). Notably, f had been previously compared to parameters derived from DTI (i.e. apparent diffusion coefficient, ADC; fractional anisotropy, FA) and found to provide complementary information in WM due to a relative insensitivity to fiber coherence (13, 14). Subsequently, f and diffusion-based parameters have been used for detecting changes in myelin associated with multiple sclerosis (15). In this study, we sought to identify quantitative MRI parameters associated with DTI and FBFI that may detect alterations in gray matter (GM) and/or WM in adults with Fabry disease.
MATERIAL AND METHODS
Participant Group
Male and female individuals with Fabry disease were recruited locally through the Lysosomal Storage Disorders program at the University of Washington. A control group of healthy volunteers with no history of neurological disease (e.g. stroke, brain tumor, neurodegenerative diseases such as multiple sclerosis, etc.) was recruited to match age and gender of the Fabry cohort. Prior to imaging, all participants were provided a standardized MRI screening questionnaire and participants were excluded if found to be MRI incompatible (e.g. brain aneurysm clip, claustrophobia). Clinical information on participants with Fabry disease was obtained through chart review. The study was approved by the institutional review board prior to study initiation. All participants gave their written informed consent. From September 4, 2013 to March 1, 2014, 11 participants with Fabry disease and 12 healthy controls received an MRI.
MR Imaging Protocol
Participants were imaged on a whole-body 3.0 T MRI scanner (Achieva, Philips Medical Systems, Best, Netherlands) using a quadrature transmit/receive head coil (Philips Medical Systems).
Bound-pool fraction maps were obtained using a whole-brain 3D spoiled gradient echo (SPGR) MT sequence (TR/TE = 43/4.6 ms, α = 10°) utilizing a single-lobe saturation pulse with Gaussian apodization (duration = 19 ms, nominal effective flip angle = 900°) to acquire three Z-spectroscopic data points with offset frequencies (Δ) of 4, 8, and 96 kHz. The variable flip angle (VFA) method to obtain necessary R1 maps for parameter fitting was implemented with a 3D SPGR sequence (TR/TE = 20/4.6 ms) with α = 4, 10, 20, and 40°. Both the MT and VFA protocols were acquired with a field-of-view (FOV) = 224×224×120 mm3, matrix = 112×112×60, acquisition resolution = 2.0×2.0×2.0 mm3 (zero interpolated to 1.75×1.75×2.0 mm3), one signal average, and half Fourier factor = 0.625. To correct for B0 and B1 heterogeneity, whole-brain B0 and B1 maps were obtained using the dual-TE phase difference method (16) and the actual flip-angle imaging method (17), respectively. The B0 data was acquired with a 3D SPGR sequence (TR/TE = 20/4.6 ms, delta TE = 1 ms, α = 10°) using a FOV = 224×224×120 mm3, matrix = 76×50×30, acquisition resolution = 2.95×4.48×4.0 mm3 (zero-interpolated to 1.75×1.75×2.0 mm3), and one signal average. The B1 data was acquired with a 3D SPGR sequence (TR1/TR2/TE = 25/125/4.6 ms. α = 60°) using a FOV = 224×224×120 mm3, matrix = 64×42×15, acquisition resolution = 3.5×5.33×8.0 mm3 (zero-interpolated to 1.75×1.75×2.0 mm3), and one signal average.
DTI utilized a single-shot 2D spin-echo echo-planar sequence with TR/TE = 9500/64 ms, α = 90°, EPI factor = 111, 32 gradient directions, half Fourier factor = 0.6, and two b-values of 0 and 1000 s/mm2. Images were acquired with FOV = 224×224 mm2, matrix = 112×111, in-plane resolution = 2.0×2.0 mm2 (zero-interpolated to 1.75×1.75 mm2), slice thickness = 2.0 mm, 60 slices, and one signal average.
All sequences were obtained in the transverse plane with the same FOV using zero angulations in all planes relative to the scanner gantry. The total scan time for the entire imaging protocol was about 25 minutes.
Image Processing
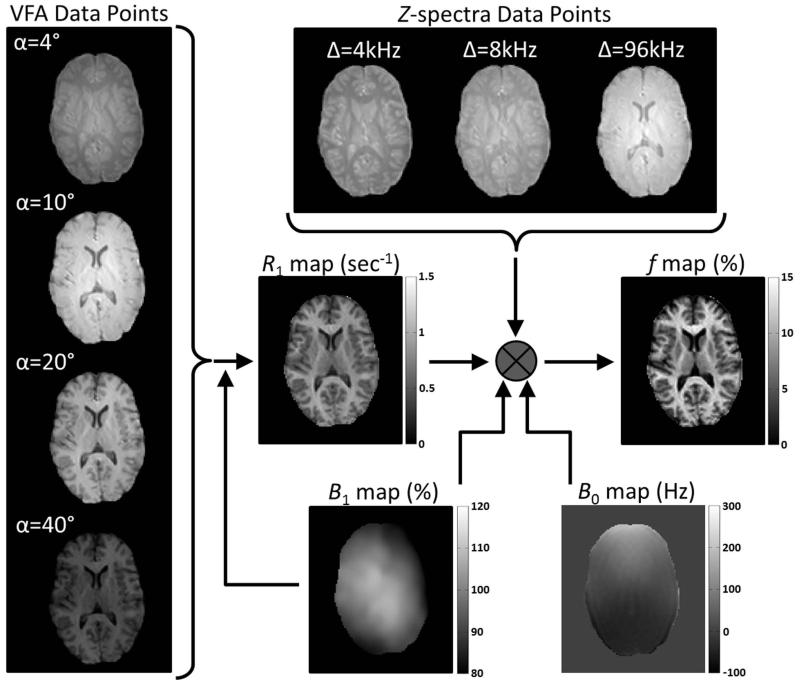
Bound-pool fraction maps (f maps) were constructed consistent with a previously described methodology (12) that utilizes the matrix model of magnetization transfer (18) for single parameter determination of f. Briefly, R1 maps were used to define R1F and reconstructed from the VFA data after voxel-based B1 corrections were applied to α. In the MT data, the Δ = 96 kHz Z-spectra images were used to normalize the Δ = 4 and 8 kHz data points and voxel-based B0 and B1 corrections were applied to Δ and α, respectively, during voxel-based fitting for f. Figure 1 outlines the combination of images necessary for production of f maps. In addition, there were four cross-relaxation parameters (k, T2FR1F, T2B, and R1B) that required constraints for isolated determination of f. The parameters k, T2FR1F, and T2B were constrained to 29 × f/(1-f) s−1, 0.030, 10.7 μs, respectively, as previously determined (12). R1B, the longitudinal relaxation of the bound-pool, was set to a fixed value of 1 s−1 by convention (13, 18-20). Image processing dedicated to whole-brain voxel-based determination of f was performed using in-house written Matlab (The Mathworks, Natick, MA) and C/C++ language software.
Figure 1.
Requisite images from a control participant (male, 29 years) for voxel-based production of f maps. VFA and Z-spectra acquisition flip angles (α) are corrected with B1 maps during calculation of R1 maps and f maps, respectively. The production of f maps also requires correction of Z-spectra offset frequencies (Δ) with B0 maps and utilization of R1 maps.
Diffusion-weighted images were processed using DTIStudio software (Version 3.0.3, Johns Hopkins University). Whole-brain ADC and FA maps were calculated using the default options in DTIStudio. A 3×3 median filter was applied in the axial plane to all parametric maps (f, ADC, and FA) after reconstruction to minimize noise during parameter fitting resulting from effects of misregistration and noise present in the original images.
Image Analysis
Supratentorial GM and WM structures were identified based on their anatomical location using reference atlases (21, 22). Relatively large structures present on two adjacent slices were selected for analysis to: 1) minimize partial-volume effects related to both in- and through-plane resolution; and 2) minimize effects associated with misregistration between DTI and FBFI parametric maps. Using tissue-contrast properties of DTI and FBFI parametric maps described in the literature (18, 23) coupled with the anatomic locations identified from the reference atlases, a region-of-interest (ROI) was manually outlined in two adjacent slices within each structure and the mean value for each parametric map was recorded as previously described (13). Manual registration was used for each structure to similarly position ROIs in both f and diffusion-based parametric maps. Data collected from each ROI and manual registration was done using in-house written Matlab software. Data collected from a single reviewer was used during statistical analysis of the comparison between Fabry participants and controls. To establish reliability of measurements, a second reviewer using the same methodology independently placed ROIs on both f and diffusion-based parametric maps.
Statistical Analysis
For Fabry patients, clinical categorical variables are presented as percentages. For clinical continuous variables and each anatomic structure evaluated, means and standard deviations (SDs) were calculated for each group. The student’s independent t-test assuming equal or unequal variance based on Levene’s test was used to compare mean values between cases and controls. Spearman’s rho was used to identify correlations between continuous variables. The intraclass correlation coefficient (ICC) was used to evaluate reproducibility. Statistical analyses were performed with SPSS for Windows (Version 12.0, SPSS, Chicago, Illinois). Statistical significance was defined as P<0.05.
RESULTS
Participant Characteristics
Of the 23 participants enrolled in the study, one (4.3%) did not have usable images secondary to severe image distortion most likely attributable to dental work. The results presented here are from the remaining 22 participants (N = 12 controls, N = 10 cases). The mean (±SD) age between the control group (48.0±12.4 yrs; range: 30.3 – 66.0 yrs) and Fabry participants (46.7±12.9 yrs; range: 25.8 – 65.5 yrs) was similar (p = 0.80). Both groups were 50% female. All participants were Caucasian.
GLA mutations for the Fabry participants are summarized in Table 1. There were 8 different mutations in the 9 Fabry participants with an identified GLA mutation. The lone Fabry participant without a known mutation had not undergone genetic testing but was an obligate Fabry carrier based on family history and had an enzyme activity from a skin biopsy of 8.9 nmol/hr/mg protein (normal range: 20.5 – 33.8 nmol/hr/mg protein). Clinical characteristics of the Fabry participants are detailed in Table 2. Seven (70%) of the Fabry participants were on enzyme replacement therapy.
Table 1. Summary of known GLA mutations in Fabry participants.
| DNA | Protein | N |
|---|---|---|
| c.816C>A | p.N272K | 2 |
| c.809T>C | p.V269A | 1 |
| c.7365A>G | p.A156T | 1 |
| c.1042dupG | p.A348GfsX27 | 1 |
| c.334C>T | p.R112C | 1 |
| c.26delA | – | 1 |
| c.125A>G | p.M42V | 1 |
| c.751G>T | p.E251X | 1 |
Table 2. Clinical characteristics of Fabry participants.
| Present (N = 10), % |
Present in Males (N = 5), % |
Present in Females (N = 5), % |
Range of Symptoms | |
|---|---|---|---|---|
| Cardiac | 80 | 100 | 60 | Bradycardia, LVH, Arrhythmia, ST and/or T-wave changes on ECG, RBB |
| Gastrointestinal | 80 | 60 | 100 | Nausea, Diarrhea, Constipation |
| Acroparesthesias | 70 | 100 | 40 | |
| Tinnitus | 70 | 60 | 80 | |
| Renal | 50 | 60 | 40 | Kidney transplant (N = 1, male), Proteinuria |
| Angiokeratomas | 40 | 60 | 20 | |
| Stroke | 30 | 60 | 0 | |
| Hypohydrosis | 30 | 60 | 0 |
LVH = left ventricular hypertrophy, RBB = right bundle-branch block
Imaging Findings
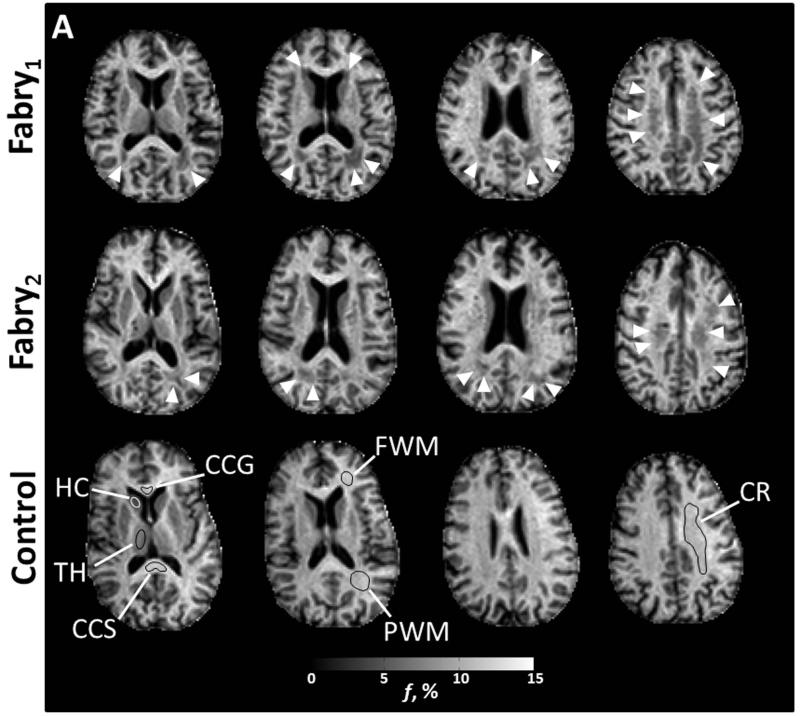
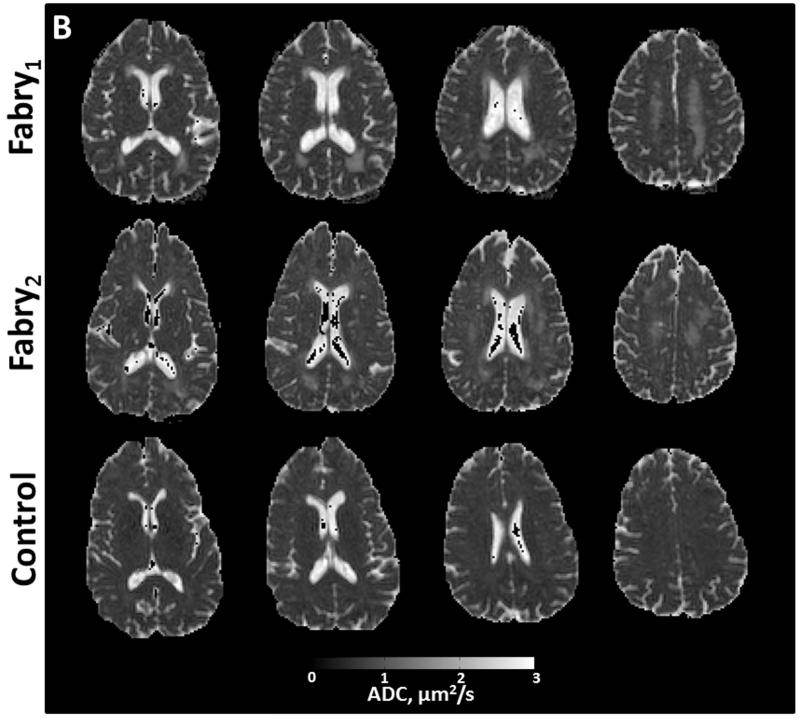
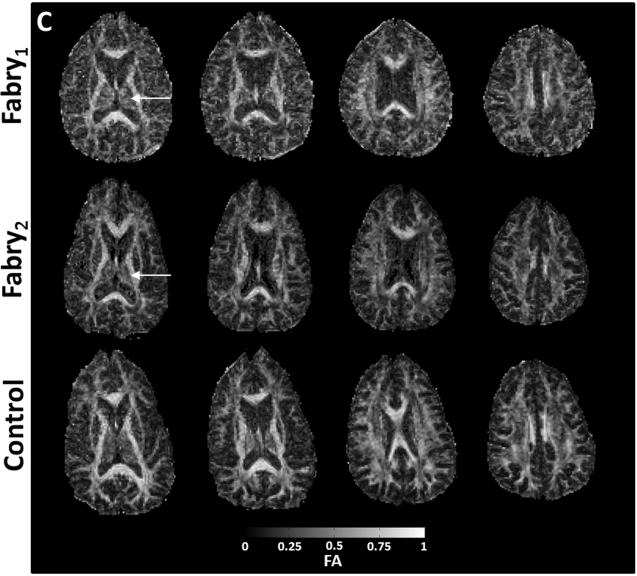
Figure 2 identifies the anatomic locations with sample ROIs on f maps utilized for comparison between cases and controls along with corresponding images from the diffusion-based parametric maps. The comparison between cases and controls for each anatomic structure is detailed in Table 3.
Figure 2.
Axial images from two participants with Fabry disease (Fabry1, female, 53 years; Fabry2, male, 49 years) and a control participant (female, 59 years). Anatomic structures are identified in f maps for the control participant with representative ROIs (A). In the participants with Fabry disease, there is a substantial reduction in the bound pool fraction (A, white arrow heads). An increase in ADC (B) is present in corresponding anatomic locations. White matter changes in the Fabry participant may be less apparent in the fractional anisotropy (FA) images (C) due to heterogenous fiber direction in some structures such as the posterior white matter (PWM) and corona radiata (CR). In gray matter, particularly the left thalamus, there is evidence of increased restricted anisotropy on FA (C, white arrows) in the Fabry participant. CCG = corpus callosum, genu; CCS = corpus callosum, splenium; FWM = frontal white matter; HC = head of caudate; TH = thalamus
Table 3. Mean±SD (inter-subject) values for bound-pool fraction and diffusion parameters for both gray and white matter structures.
| Fabry | Control | p-value | ||
|---|---|---|---|---|
| Gray Matter | ||||
|
| ||||
| Head of Caudate, Right | ||||
| f, % | 5.33±0.24 | 5.44±0.49 | 0.513 | |
| ADC, μm2/s | 0.79±0.08 | 0.77±0.04 | 0.365 | |
| FA | 0.23±0.06 | 0.18±0.04 | 0.035 | |
|
| ||||
| Head of Caudate, Left | ||||
| f, % | 5.50±0.56 | 5.51±0.37 | 0.963 | |
| ADC, μm2/s | 0.79±0.11 | 0.76±0.05 | 0.526 | |
| FA | 0.22±0.06 | 0.18±0.03 | 0.013 | |
|
| ||||
| Thalamus, Right | ||||
| f, % | 7.02±0.34 | 7.23±0.45 | 0.247 | |
| ADC, μm2/s | 0.77±0.03 | 0.74±0.02 | 0.013 | |
| FA | 0.32±0.06 | 0.30±0.03 | 0.224 | |
|
| ||||
| Thalamus, Left | ||||
| f, % | 7.18±0.45 | 7.32±0.35 | 0.408 | |
| ADC, μm2/s | 0.76±0.04 | 0.73±0.02 | 0.082 | |
| FA | 0.33±0.05 | 0.29±0.02 | 0.030 | |
|
| ||||
| White Matter | ||||
|
| ||||
| Corpus Callosum, Genu | ||||
| f, % | 11.73±0.43 | 11.86±0.67 | 0.622 | |
| ADC, μm2/s | 0.79±0.05 | 0.80±0.04 | 0.603 | |
| FA | 0.77±0.04 | 0.76±0.05 | 0.376 | |
|
| ||||
| Corpus Callosum, Splenium | ||||
| f, % | 12.87±0.95 | 12.65±0.65 | 0.534 | |
| ADC, μm2/s | 0.86±0.04 | 0.87±0.05 | 0.893 | |
| FA | 0.71±0.04 | 0.72±0.07 | 0.628 | |
|
| ||||
| Posterior WM, Right | ||||
| f, % | 9.46±0.92 | 10.26±0.47 | 0.017 | |
| ADC, μm2/s | 0.86±0.11 | 0.78±0.04 | 0.054 | |
| FA | 0.41±0.07 | 0.44±0.06 | 0.194 | |
|
| ||||
| Posterior WM, Left | ||||
| f, % | 9.00±1.84 | 10.45±0.37 | 0.035 | |
| ADC, μm2/s | 0.94±0.19 | 0.78±0.04 | 0.024 | |
| FA | 0.36±0.08 | 0.42±0.07 | 0.052 | |
|
| ||||
| Frontal WM, Right | ||||
| f, % | 10.82±0.52 | 11.34±0.95 | 0.141 | |
| ADC, μm2/s | 0.80±0.05 | 0.78±0.04 | 0.230 | |
| FA | 0.37±0.02 | 0.37±0.04 | 0.643 | |
|
| ||||
| Frontal WM, Left | ||||
| f, % | 11.61±1.32 | 11.97±0.80 | 0.444 | |
| ADC, μm2/s | 0.81±0.07 | 0.78±0.03 | 0.305 | |
| FA | 0.35±0.03 | 0.35±0.03 | 0.585 | |
|
| ||||
| Corona Radiata, Right | ||||
| f, % | 9.92±0.62 | 10.36±0.61 | 0.110 | |
| ADC, μm2/s | 0.81±0.09 | 0.75±0.03 | 0.064 | |
| FA | 0.38±0.05 | 0.39±0.04 | 0.468 | |
|
| ||||
| Corona Radiata, Left | ||||
| f, % | 9.85±1.43 | 10.69±0.44 | 0.106 | |
| ADC, μm2/s | 0.83±0.15 | 0.74±0.02 | 0.103 | |
| FA | 0.37±0.05 | 0.39±0.05 | 0.384 | |
FA = fractional anisotropy; WM = white matter
Bold values indicate statistical significance (p < 0.05)
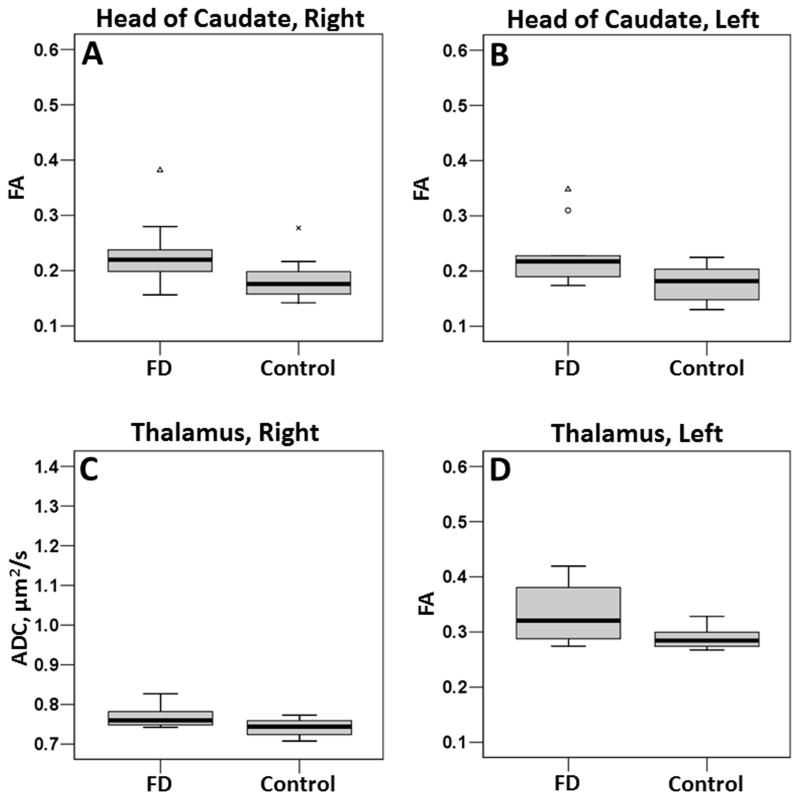
In GM structures, the head of the caudate bilaterally demonstrated significant increases in FA (right, p = 0.035; left, p = 0.013) in Fabry disease participants compared to controls. In the thalamus, there was a significant increase in ADC on the right (p = 0.013) and a trend towards an increase on the left (p = 0.082). The left thalamus also demonstrated a significant increase in FA (p = 0.030). Boxplots for the head of the caudate and thalamus are presented in Figure 3. While the differences in the head of the caudate were not visually apparent on diffusion-based images (Figure 2), alterations in the thalamus, particularly in FA, were identifiable (Figure 2).
Figure 3.
Boxplots for the head of caudate (A, B) and thalamus (C, D). All boxplots are of FA except for C, which is of ADC. To compare the spread of data, scaling for each parameter is identical to the scaling in Figure 4.
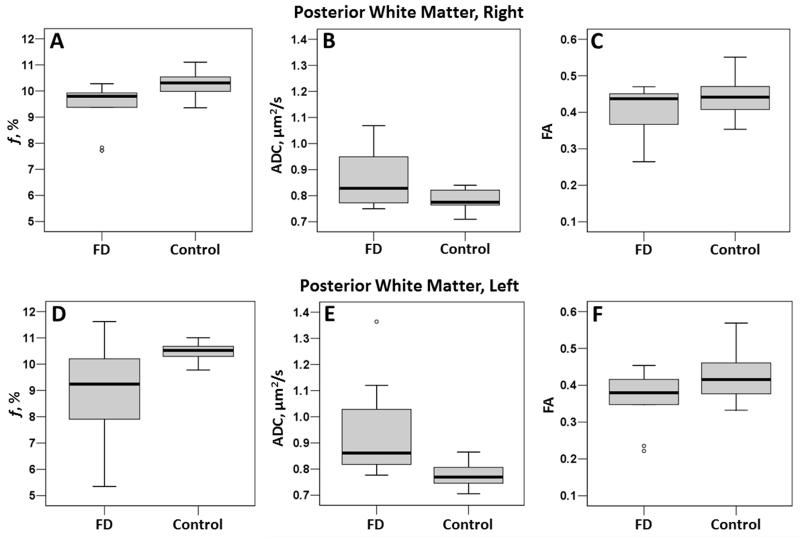
In WM structures, the posterior WM demonstrated significant reductions in the bound-pool fraction (right, p = 0.017; left, p = 0.035; Table 3). In the posterior white matter, there was also a significant increase in ADC on the left (p = 0.024) and a trend towards an increase on the right (p = 0.054). FA demonstrated a trend (p = 0.052) towards an increase in Fabry participants on the left (Table 3). Boxplots for each parameter in the posterior WM are presented in Figure 4.
Figure 4.
Boxplots for the posterior white matter, right (top row) and left (bottom row). Note the large spread of bound pool fraction data in the left posterior WM in participants with Fabry disease (D).
Age Related Changes
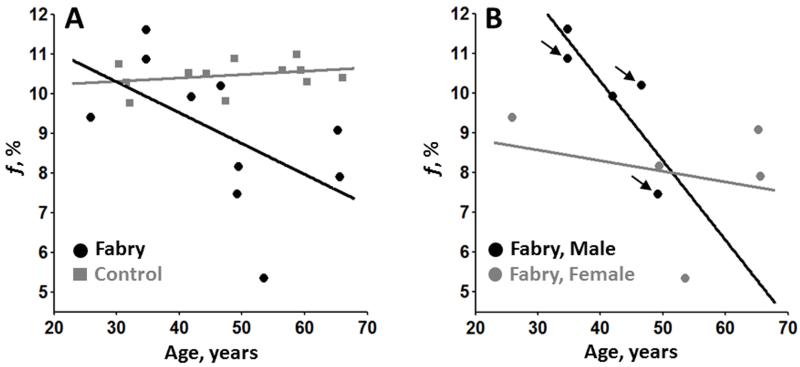
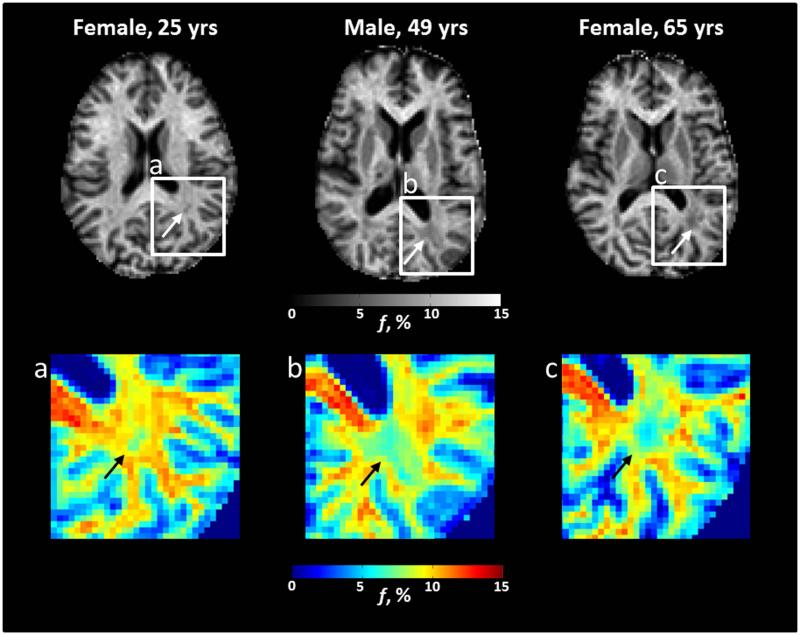
In a post-hoc analysis, associations between parametric values and age were explored for the structures demonstrating a substantial difference between cases and controls detailed in the preceding section. In the WM of Fabry participants there was a significant inverse correlation between f in the left posterior WM and age in Fabry participants (rho = −0.71, p = 0.022; Figure 5). Figure 6 depicts the gradual decrease in f with age in the left posterior WM in Fabry disease. No additional associations were statistically significant although there was a strong trend towards an increase in FA in the right thalamus (rho = 0.62, p = 0.054; Table 4).
Figure 5.
Scatter plots of age vs. bound pool fraction in the left posterior white matter. Solid black/gray lines represent a regression line through corresponding black/gray data points. In (A), there is a reduction of myelin density with age in Fabry participants (black circles) compared to controls (gray squares) that is also present regardless of gender (B). The black arrows (B) identify Fabry participants with a history of stroke.
Figure 6.
Axial bound-pool fraction maps (f maps) from participants with Fabry disease. There is evidence in the left posterior white matter for a gradual decrease in myelin density (white arrows) with age that may be more apparent on corresponding color maps (a-c, black arrows). Specifically, there is a trend from yellow/red towards light and dark blue with increasing age.
Table 4. Spearman’s rho (p-value) between age and parametric maps.
| f | ADC | FA | ||||
|---|---|---|---|---|---|---|
| Fabry | Control | Fabry | Control | Fabry | Control | |
|
Head of
Caudate, Right |
– | – | 0.30 (0.405) |
−0.29 (0.354) |
0.14 (0.701) |
0.19 (0.557) |
|
| ||||||
|
Head of
Caudate, Left |
– | – | –0.02 (0.960) |
–0.32 (0.308) |
0.24 (0.511) |
0.27 (0.404) |
|
| ||||||
|
Thalamus,
Right |
– | – | 0.06 (0.881) |
−0.15 (0.633) |
0.62 (0.054) |
−0.29 (0.366) |
|
| ||||||
|
Thalamus,
Left |
– | – | 0.26 (0.467) |
0.02 (0.948) |
0.48 (0.162) |
−0.47 (0.124) |
|
| ||||||
|
Posterior
WM, Right |
−0.41 (0.244) |
−0.14 (0.665) |
– | – | – | – |
|
| ||||||
|
Posterior
WM, Left |
−0.71
(0.022) |
0.175 (0.587) |
0.53 (0.117) |
−0.05 (0.863) |
−0.44 (0.200) |
0.05 (0.880) |
ADC = apparent diffusion coefficient; FA = fractional anisotropy; WM = white matter
Bold values indicate statistical significance (p < 0.05)
Reproducibility
Comparison of GM and WM mean ROI f map values identified a strong agreement between reviewers in both Fabry participants (ICC > 0.99; p < 0.001) and controls (ICC > 0.99; p < 0.001). Similarly, there was strong agreement between reviewers comparing ADC ROI data from Fabry participants (ICC = 0.95; p <0.001) and controls (ICC = 0.99; p < 0.001). There was also strong agreement in mean ROI values from FA maps between reviewers from Fabry participants (ICC > 0.99; p < 0.001) and controls (ICC > 0.99; p < 0.001).
DISCUSSION
In this case-control study, differences in GM and WM structures in Fabry participants were identified using quantitative MRI techniques. DTI identified changes in the thalamus consistent with an increase in restricted diffusion associated with Fabry disease. Both DTI and FBFI detected changes in WM, particularly the posterior WM, indicative of loss of fiber coherence and demyelination, respectively. Notably, the reduction in the bound-pool fraction (i.e. myelin density) in the posterior WM was strongly associated with age in Fabry disease. Although promising, these observations should be considered with caution. This is a pilot study and the small sample size may not fully encompass the range of disease effects and the predominant anatomic locations of change described in this study may be sample specific. Nevertheless, the findings described herein provide compelling evidence that quantitative imaging techniques such as DTI and FBFI may yield meaningful structural information to study the natural history of Fabry disease in the brain and to also determine the neurological efficacy of therapeutic interventions.
Previous DTI-based imaging studies of Fabry disease have reported variable results regarding differences between Fabry patients and healthy controls. Initially, studies largely found either a global increase or elevation in ADC, but not FA, located in the frontal, parietal and temporal WM (24-26). More recently, Paavilainen et al. reported alterations in ADC in the WM of Fabry patients with only a mild WML load (8). They also noted an increase in FA in the thalamus (8). Consistent with Paavilainen et al., we found changes in WM in diffusion-based parameters. We similarly identified diffusion-based changes in the thalamus consistent with an increase in restricted diffusion. The location of these changes did not necessarily include the pulvinar, which studies originally associated with an increased T1-weighted signal in Fabry patients (27). Notably, a more recent investigation by Burlina et al. found the pulvinar sign in <14% of Fabry patients all of which were male with severe kidney involvement (28). Nevertheless, based on a growing collection of DTI findings, the thalamus may be a location of interest to monitor in future imaging investigations of Fabry disease.
The etiology of changes in the brain associated with Fabry disease remains unclear. Common hypotheses include endothelial dysfunction driven by glycosphingolipid deposition that leads to vascular dysregulation, occlusion, or both (29, 30). Autopsy results with associated imaging findings from a single patient with Fabry disease described changes beyond ischemia that included axonopathic leukoencephalopthy due to multisegmental hydropic swelling of axons in the bilateral deep cerebral WM (31). Importantly, it was noted that the swollen axons remained coated with myelin sheaths (31). Axonal swelling alters myelin density, which would decrease the bound-pool fraction since f strongly corresponds to myelin density (12). In addition, the glycolipid deposition in the cerebral microvasculature associated with Fabry disease would also decrease the measured bound-pool fraction as lipids do not contribute to the MT effect (32). The accumulation of edema would also alter both DTI and FBFI due to loss of fiber coherence and an influx of free protons (i.e. protons bound to water), respectively. Although some of these observations may support the signal changes observed in Fabry disease, particularly in WM, additional autopsy-based studies coupled to imaging would enable a more comprehensive understanding of the effects of Fabry disease on both GM and WM.
The extent of WM disease appeared to increase in severity with age and was extensive in a number of participants with Fabry disease. Associations with age, particularly in regards to increasing quantity and volume of WMLs, have been well described in Fabry disease (2, 6, 33, 34). In addition, Moore et al. has previously described Fabry patients with leukoencephalopathy equivalent in severity as that depicted in our study (35). Although the Fabry participants in the present study displayed many clinical symptoms associated with Fabry disease, none of the participants without a history of stroke exhibited gross neurological deficits, which is consistent with the patient characterization provided by Moore et al. In a case-control study that included 25 Fabry patients, Schermuly et al. sought associations between brain MRI and neuropsychological, psychiatric, pain, and quality of life assessments (34). In a subgroup of seven patients with WML volumes two standard deviations above the mean, only phasic alertness amongst 17 parameters measured was significantly different compared to controls after correcting for depression severity (34), a well-documented psychiatric complication of Fabry disease (36). We can only speculate as to why the vast changes in WM identified in Fabry disease cause minimal clinical impact. The absence of an observed neuropsychological effect beyond depression may be in part related to previous studies (34) analyzing overall disease burden rather than subcategorizing lesions based on anatomic location. Alternatively, neuroplasticity may have a role as the age-related changes identified in the present study suggest an insidious process rather than a single acute event may be a principle driver of Fabry-related changes in WM. Future Fabry studies would benefit from serial quantitative imaging to monitor temporal changes in the microstructure (e.g. axial diffusivity and radial diffusivity) and myelin density in specific WM structures in coordination with serial neuropsychological testing targeted to the lesion site to more fully characterize associations between Fabry disease and functional and cognitive sequelae.
A limitation of this study is the sample size. A larger sample population would enable more complex statistical analyses to evaluate for effects of enzyme replacement therapy, gender, and other demographic data on the imaging findings. In addition, the small sample size coupled with the number of statistical tests performed raises the possibility of a Type I error in the presented data given the observed p-values. However, the broad age range and observed age-related changes led to a distribution of data from Fabry disease participants that spanned normal values to highly abnormal values. This spread in the data weakened the statistical analysis due to relatively large standard deviations in the Fabry disease group. Differences between Fabry participants and healthy controls may have been greater if only an older population was sampled. Future studies that seek to increase the sample size or target a specific demographic in Fabry disease may require a multi-center design as the prevalence of the disease in the general male population with a mixed ethnic background is approximately 1 in 7,800 (37). As such, the accessibility of FBFI merits consideration. Aspects of the FBFI acquisition, specifically variable offsets and power associated with the Z-spectroscopy acquisition, may not be available at all sites. However, the standard 3D magnetization transfer GRE sequence currently utilized on clinical scanners can be readily adapted for this purpose with only minor technical support. An additional limitation of this study is that qualitative images (e.g. T2-weighted, FLAIR) were not acquired for comparison to the quantitative images to determine if changes in GM and WM were occurring beyond regions of abnormal signal intensity on conventional clinical images. Future studies should integrate both qualitative and quantitative imaging to determine if quantitative imaging improves detection of alterations to GM and WM.
In conclusion, DTI and FBFI are complementary quantitative MRI techniques that are based on the mechanical and chemical properties of tissue, respectively. This study demonstrates the feasibility of using these techniques for detecting changes in GM and WM associated with Fabry disease. Both the thalamus and the posterior WM may be anatomic locations that merit monitoring for disease progression and response to therapy during future prospective investigations. Prospective investigations are also necessary to determine the clinical utility of using DTI and FBFI to predict disease progression and risk of stroke based on quantitative imaging results.
Acknowledgments
Grant Support: This research was supported by the NIH (T32 GM007454, K08 MH100609) and a grant from the Genzyme Corporation, a Sanofi Company.
REFERENCES
- 1.Mehta A, Clarke JT, Giugliani R, et al. Natural course of Fabry disease: changing pattern of causes of death in FOS - Fabry Outcome Survey. J Med Genet. 2009;46(8):548–52. doi: 10.1136/jmg.2008.065904. [DOI] [PubMed] [Google Scholar]
- 2.Crutchfield KE, Patronas NJ, Dambrosia JM, et al. Quantitative analysis of cerebral vasculopathy in patients with Fabry disease. Neurology. 1998;50(6):1746–9. doi: 10.1212/wnl.50.6.1746. [DOI] [PubMed] [Google Scholar]
- 3.Moore DF, Ye F, Schiffmann R, Butman JA. Increased signal intensity in the pulvinar on T1-weighted images: a pathognomonic MR imaging sign of Fabry disease. Ajnr. 2003;24(6):1096–101. [PMC free article] [PubMed] [Google Scholar]
- 4.Jardim L, Vedolin L, Schwartz IV, et al. CNS involvement in Fabry disease: clinical and imaging studies before and after 12 months of enzyme replacement therapy. J Inherit Metab Dis. 2004;27(2):229–40. doi: 10.1023/B:BOLI.0000028794.04349.91. [DOI] [PubMed] [Google Scholar]
- 5.Fellgiebel A, Muller MJ, Mazanek M, Baron K, Beck M, Stoeter P. White matter lesion severity in male and female patients with Fabry disease. Neurology. 2005;65(4):600–2. doi: 10.1212/01.wnl.0000173030.70057.eb. [DOI] [PubMed] [Google Scholar]
- 6.Gavazzi C, Borsini W, Guerrini L, et al. Subcortical damage and cortical functional changes in men and women with Fabry disease: a multifaceted MR study. Radiology. 2006;241(2):492–500. doi: 10.1148/radiol.2412051122. [DOI] [PubMed] [Google Scholar]
- 7.Marino S, Borsini W, Buchner S, et al. Diffuse structural and metabolic brain changes in Fabry disease. J Neurol. 2006;253(4):434–40. doi: 10.1007/s00415-005-0020-z. [DOI] [PubMed] [Google Scholar]
- 8.Paavilainen T, Lepomaki V, Saunavaara J, et al. Diffusion tensor imaging and brain volumetry in Fabry disease patients. Neuroradiology. 2013;55(5):551–8. doi: 10.1007/s00234-012-1131-8. [DOI] [PubMed] [Google Scholar]
- 9.Sims K, Politei J, Banikazemi M, Lee P. Stroke in Fabry disease frequently occurs before diagnosis and in the absence of other clinical events: natural history data from the Fabry Registry. Stroke. 2009;40(3):788–94. doi: 10.1161/STROKEAHA.108.526293. [DOI] [PubMed] [Google Scholar]
- 10.Buechner S, Moretti M, Burlina AP, et al. Central nervous system involvement in Anderson-Fabry disease: a clinical and MRI retrospective study. J Neurol Neurosurg Psychiatry. 2008;79(11):1249–54. doi: 10.1136/jnnp.2008.143693. [DOI] [PubMed] [Google Scholar]
- 11.Henkelman RM, Huang X, Xiang QS, Stanisz GJ, Swanson SD, Bronskill MJ. Quantitative interpretation of magnetization transfer. Magn Reson Med. 1993;29(6):759–66. doi: 10.1002/mrm.1910290607. [DOI] [PubMed] [Google Scholar]
- 12.Underhill HR, Rostomily RC, Mikheev AM, Yuan C, Yarnykh VL. Fast bound pool fraction imaging of the in vivo rat brain: Association with myelin content and validation in the C6 glioma model. NeuroImage. 2011;54(3):2052–65. doi: 10.1016/j.neuroimage.2010.10.065. [DOI] [PMC free article] [PubMed] [Google Scholar]
- 13.Underhill HR, Yuan C, Yarnykh VL. Direct quantitative comparison between cross-relaxation imaging and diffusion tensor imaging of the human brain at 3.0 T. NeuroImage. 2009;47:1568–78. doi: 10.1016/j.neuroimage.2009.05.075. [DOI] [PubMed] [Google Scholar]
- 14.Stikov N, Perry LM, Mezer A, et al. Bound pool fractions complement diffusion measures to describe white matter micro and macrostructure. NeuroImage. 2011;54(2):1112–21. doi: 10.1016/j.neuroimage.2010.08.068. [DOI] [PMC free article] [PubMed] [Google Scholar]
- 15.Janve VA, Zu Z, Yao SY, et al. The radial diffusivity and magnetization transfer pool size ratio are sensitive markers for demyelination in a rat model of type III multiple sclerosis (MS) lesions. NeuroImage. 2013;74:298–305. doi: 10.1016/j.neuroimage.2013.02.034. [DOI] [PMC free article] [PubMed] [Google Scholar]
- 16.Skinner TE, Glover GH. An extended two-point Dixon algorithm for calculating separate water, fat, and B0 images. Magn Reson Med. 1997;37(4):628–30. doi: 10.1002/mrm.1910370426. [DOI] [PubMed] [Google Scholar]
- 17.Yarnykh VL. Actual flip-angle imaging in the pulsed steady state: a method for rapid three-dimensional mapping of the transmitted radiofrequency field. Magn Reson Med. 2007;57(1):192–200. doi: 10.1002/mrm.21120. [DOI] [PubMed] [Google Scholar]
- 18.Yarnykh VL, Yuan C. Cross-relaxation imaging reveals detailed anatomy of white matter fiber tracts in the human brain. NeuroImage. 2004;23(1):409–24. doi: 10.1016/j.neuroimage.2004.04.029. [DOI] [PubMed] [Google Scholar]
- 19.Morrison C, Henkelman RM. A model for magnetization transfer in tissues. Magn Reson Med. 1995;33(4):475–82. doi: 10.1002/mrm.1910330404. [DOI] [PubMed] [Google Scholar]
- 20.Sled JG, Pike GB. Quantitative imaging of magnetization transfer exchange and relaxation properties in vivo using MRI. Magn Reson Med. 2001;46(5):923–31. doi: 10.1002/mrm.1278. [DOI] [PubMed] [Google Scholar]
- 21.Nieuwenhuys R, Voogd J, van Huijzen C. The human central nervous system: A synopsis and atlas. 3rd ed. Springer-Verlag; New York: 1988. [Google Scholar]
- 22.Truwit CL, Lempert TE. High Resolution Atlas of Cranial Neuroanatomy. 1st ed Lippincott Williams & Wilkins; 1994. [Google Scholar]
- 23.Wakana S, Jiang H, Nagae-Poetscher LM, van Zijl PC, Mori S. Fiber tract-based atlas of human white matter anatomy. Radiology. 2004;230(1):77–87. doi: 10.1148/radiol.2301021640. [DOI] [PubMed] [Google Scholar]
- 24.Moore DF, Schiffmann R, Ulug AM. Elevated CNS average diffusion constant in Fabry disease. Acta Paediatr Suppl. 2002;91(439):67–8. doi: 10.1111/j.1651-2227.2002.tb03114.x. [DOI] [PubMed] [Google Scholar]
- 25.Albrecht J, Dellani PR, Muller MJ, et al. Voxel based analyses of diffusion tensor imaging in Fabry disease. J Neurol Neurosurg Psychiatry. 2007;78(9):964–9. doi: 10.1136/jnnp.2006.112987. [DOI] [PMC free article] [PubMed] [Google Scholar]
- 26.Fellgiebel A, Mazanek M, Whybra C, et al. Pattern of microstructural brain tissue alterations in Fabry disease: a diffusion-tensor imaging study. J Neurol. 2006;253(6):780–7. doi: 10.1007/s00415-006-0118-y. [DOI] [PubMed] [Google Scholar]
- 27.Takanashi J, Barkovich AJ, Dillon WP, Sherr EH, Hart KA, Packman S. T1 hyperintensity in the pulvinar: key imaging feature for diagnosis of Fabry disease. Ajnr. 2003;24(5):916–21. [PMC free article] [PubMed] [Google Scholar]
- 28.Burlina AP, Manara R, Caillaud C, et al. The pulvinar sign: frequency and clinical correlations in Fabry disease. J Neurol. 2008;255(5):738–44. doi: 10.1007/s00415-008-0786-x. [DOI] [PubMed] [Google Scholar]
- 29.Schatzki PF, Kipreos B, Payne J. Fabry’s disease. Primary diagnosis by electron microscopy. Am J Surg Pathol. 1979;3(3):211–9. [PubMed] [Google Scholar]
- 30.Tagliavini F, Pietrini V, Gemignani F, Lechi A, Pallini R, Federico A. Anderson-Fabry’s disease: neuropathological and neurochemical investigation. Acta neuropathologica. 1982;56(2):93–8. doi: 10.1007/BF00690579. [DOI] [PubMed] [Google Scholar]
- 31.Okeda R, Nisihara M. An autopsy case of Fabry disease with neuropathological investigation of the pathogenesis of associated dementia. Neuropathology. 2008;28(5):532–40. doi: 10.1111/j.1440-1789.2008.00883.x. [DOI] [PubMed] [Google Scholar]
- 32.Koenig SH. Cholesterol of myelin is the determinant of gray-white contrast in MRI of brain. Magn Reson Med. 1991;20(2):285–91. doi: 10.1002/mrm.1910200210. [DOI] [PubMed] [Google Scholar]
- 33.Ginsberg L, Manara R, Valentine AR, Kendall B, Burlina AP. Magnetic resonance imaging changes in Fabry disease. Acta Paediatr Suppl. 2006;95(451):57–62. doi: 10.1111/j.1651-2227.2006.tb02391.x. [DOI] [PubMed] [Google Scholar]
- 34.Schermuly I, Muller MJ, Muller KM, et al. Neuropsychiatric symptoms and brain structural alterations in Fabry disease. Eur J Neurol. 2011;18(2):347–53. doi: 10.1111/j.1468-1331.2010.03155.x. [DOI] [PubMed] [Google Scholar]
- 35.Moore DF, Altarescu G, Barker WC, Patronas NJ, Herscovitch P, Schiffmann R. White matter lesions in Fabry disease occur in ‘prior’ selectively hypometabolic and hyperperfused brain regions. Brain Res Bull. 2003;62(3):231–40. doi: 10.1016/j.brainresbull.2003.09.021. [DOI] [PubMed] [Google Scholar]
- 36.Cole AL, Lee PJ, Hughes DA, Deegan PB, Waldek S, Lachmann RH. Depression in adults with Fabry disease: a common and under-diagnosed problem. J Inherit Metab Dis. 2007;30(6):943–51. doi: 10.1007/s10545-007-0708-6. [DOI] [PubMed] [Google Scholar]
- 37.Scott CR, Elliott S, Buroker N, et al. Identification of infants at risk for developing Fabry, Pompe, or mucopolysaccharidosis-I from newborn blood spots by tandem mass spectrometry. J Pediatr. 2013;163(2):498–503. doi: 10.1016/j.jpeds.2013.01.031. [DOI] [PMC free article] [PubMed] [Google Scholar]


