

Abstract
Objective
To determine tissue specific effects of alcohol on fatty acid synthesis and distribution as related to functional changes in triglyceride transport and membrane formation.
Methods
Tissue fatty acid profile, and de novo lipogenesis were determined in adult male Wistar rats after 5 weeks of ethanol feeding using deuterated water and GC/MS. Liver and pancreas fatty acid profiles and new synthesis fractions were compared with those from control rats on an isocaloric diet.
Results
Fatty acid ratios in the liver indicated that there was an over two-fold accumulation of stearate to that of palmitate, with an apparent decrease in oleate content. On the other hand, in the pancreas there was a 17% decrease in the stearate to palmitate ratio, while oleate to palmitate ratio was increased by 30%. The fractions of deuterium labeled palmitate and stearate were substantially reduced in the liver and pancreas of the alcohol treated animals. Deuterium labeling of oleate was reduced in the liver but not in the pancreas consistent with the oleate/stearate ratios in these tissues.
Conclusions
Long-term alcohol exposure results in opposite effects on the desaturase activity in the liver and pancreas limiting fatty acid transport in the liver but promoting the exocrine function of the pancreas.
Keywords: palmitic acid, stearic acid, oleic acid, fatty acid ratios, deuterium, SiDMAP
Introduction
Stable 13C or deuterium labeled substrate based dynamic metabolic phenotypeing (SIDMAP) is a systems biology approach to measuring changes in the synthesis rate and enzyme reaction pathways of small-molecule intermediary metabolites—such as sugars (e.g., glucose, ribose, glycogen), amino acids, and fatty acids from the known tracer substrate—in any given biological system exposed to genetic modification, drugs or any other environmental perturbation. The levels and labeling via a precursor of these small-molecule metabolites within a cell, tissue, or an organism precisely determine the endogenous activity of biochemical pathways and pinpoints altered substrate flow rates through metabolic pathways towards product metabolites involved in energy production, macromolecule synthesis and morphology (Maguire et al. 2006; 2007).
Tracer substrate and non-tracer based metabolomics approaches to date have extensively been used primarily for studies in cellular physiology (Dunn et al. 2005; Fiehn 2002; Goodacre 2004), cancer (Boros et al. 2002), obesity, diabetes and pregnancy (Buchaman et al. 1998), never the less they are equally applicable to studies on the impact of alcohol on metabolism as well as the effect of medications developed to treat the effects of alcohol abuse. Early non-tracer substrate metabolic profiling studies indicated that excessive alcohol use induces profound metabolic perturbations in steroid metabolism and clearance via urine (Axelson et al. 1981) and that of organic acids in rats (Weiner et al. 1984). Ethanol induced urine profile of metabolites differed greatly with respect to four compounds, namely increased threonic, glucuronic and an undetermined acid as well as decreased pyroglutamic acid. Although the biological basis for the alterations was not investigated, glucuronic acid for example forms conjugates with many organic compounds and therefore ethanol likely alters the removal of compounds from the liver with far reaching systematic metabolic consequences in patients.
This article briefly describes the concepts behind metabolic profiling and reports tissue specific lipid synthesis patterns in rats exposed chronically to ethanol with the use of deuterated water (Patton et al., 1981) as the single tracer and biological mass spectrometry in the liver and pancreas. Our data indicates prominent metabolic perturbations, distorted fatty acid ratios and diverse rate of synthesis of the long chain saturated species palmitate, stearate and their desaturation into oleate in the liver and pancreas. These metabolic consequences of chronic ethanol treatment are consistent with decreased triglyceride transport and membrane synthesis in the liver indicating functional steatosis but increased zymogen membrane assembly for digestive enzyme production in the pancreas, which are hallmarks of pancreatitis.
Materials and Methods
Intragastric ethanol infusion protocol
Male Wistar rats, age matched (65 day old), from Charles Rivers (Modesto, CA) were used in this study and fed a constant energy intake either of a control or of ethanol diet administered through a continuous intragastric administration method of Tsukamoto and French as recently reviewed (Tsukamoto et al 2008). These diets have identical contents in protein, polyunsaturated fatty acids, vitamins and minerals. Ethanol was isocalorically replaced with dextrose in the control diet. After one week of acclimatization continuous intragastric ethanol infusion was initiated at a dose of 9g/kg/day which was increased by 0.5g in a stepwise manner until it reached 14 g/kg/day in week 6. At he initial ethanol dose, total caloric intake derived from the diet was set at 533 Cal/kg and the caloric percentages of ethanol, dietary carbohydrate (dextrose), protein (lactalbumin hydrolysate) and fat (corn oil) are 24.3%, 15.5%, 25% and 35%, respectively. The highest ethanol dose at the end of the 6th week accounts for 45% of calories. Vitamin and salt mix are included at the recommended amounts by the Committee on Animal Nutrition of the National Research Council. After 5 weeks of ethanol feeding animals were given the stable isotope tracer as described previously (Bassilian et al. 2002; Lee et al. 2000). This procedure is designed to maintain tracer enrichment in body water at about 3% throughout the study (Aije et al. 1995). The rational of using deuterium labeled water as the single tracer is that during de novo lipogenesis, deuterium is incorporated into the fatty acid molecules from deuterated water. The amount of deuterium incorporation into the newly synthesized molecules depends on the deuterium enrichment in water and the pathway of de novo lipogenesis. The degree of deuterium incorporation relative to the expected provides an estimate of the newly synthesized fraction. The animals were killed by an overdose of pentobarbital and their serum, liver and pancreas were quickly removed, frozen and stored at −78 °C until tissue processing. Animal studies have been reviewed and fully approved by the necessary institutional review boards of the universities involved (UCLA and USC) for all experimental procedures including ethanol feeding, stable isotope tracer administration, euthanasia and mass spectral analysis of fatty acid extracts from serum and organs.
Stable isotopic labeling of faaty acids
Labeling of fatty acids via de novo synthesis using deuterium labeled water was performed according to the protocol developed and used since the 70s (Wadke et al. 1973). The elongation reactions begin with the reduction of the keto group at Carbon three (C3) as shown on figure 1. The first step is a reduction to an alcohol, catalyzed by 3-ketoacyl-ACP reductase. The hydrogen atoms and electrons are supplied by NADPH and an additional proton from deuterium (D+). Next, a dehydratase removes a water to produce trans-Δ2-Enoyl ACP and the final reduction step uses a second NADPH+D+ to produce deuterium labeled acyl carrying protein (acyl-ACP) and the consequent condensation and decarboxylation of malonyl ACP adds another 2-carbon acetyl group and the cycle repeats in the fatty acid synthase (FAS) complex.
Figure 1.

Stable isotope methods using heavy water (2H2O) and their deuterium (circledD+ in red) is a common tracer for both fatty acid de novo synthesis and elongation by the exchange of hydrogen with deuterium in NADPH+D+ and consequently in the acyl-ACP product. This method can safely be used in tissue culture, animals or humans over prolonged periods. These methods also provide information on the relative contribution of glycolysis and glyceroneogenesis to triglyceride synthesis in extended metabolite profile analyses.
Fatty acids from serum (100 μl) and tissues (100 mg) were extracted after saponification with 30% KOH and 100% ethanol overnight using petroleum ether after acidification (pH 1) using concentrated HCL. Fatty acids were converted to their methylated derivative using 0.5 N methanolic-HCL. Palmitate was monitored at m/z270, stearate at m/z289 and oleate at m/z264 using electron impact (EI) ionization. The incorporation of deuterium and its enrichment as markers of new synthesis in response to ethanol were determined using the mass isotopomer distribution analysis (MIDA) approach, which analyzes matrices and distribution of all isotopomers of palmitate, stearate and oleate based on the binomial precursor - product labeling principle (Σm=1 for each fatty acid) as reported previously (Lee et al. 1991; Lee 1996).
Gas Chromatography/Mass Spectrometry (GC/MS)
Mass spectral data were obtained on the HP5973 mass selective detector connected to an HP6890 gas chromatograph. The settings are as follows: GC inlet 230°C, transfer line 280°C, MS source 230°C, MS Quad 150°C. A Bpx70 column (25m length, 220μm diameter, 0.25μm film thickness, SGE Incorporated, Austin, TX) was used for palmitate, stearate, oleate and linoleate with specific temperature programming for each fatty acid studied.
Data analysis and statistical methods
In vivo experiments were carried out using three animals for either the control or ethanol diets. Mass spectral analyses of full fatty acid profiles were carried out by three independent automatic injections of 2 μl samples by the automatic sampler and accepted only if the standard sample deviation was less than 1% of the normalized peak intensity to the parent ion. Statistical analysis was performed using the parametric unpaired, two-tailed independent sample t test with 99% confidence intervals (μ±2.58σ) and P<0.01 was considered to indicate significant differences in fatty acid synthesis in ethanol fed rats treated chronically with ethanol.
Results
Stable isotope tracer methods have opened the pave to determine multiple fatty acid synthesis and turnover rates, simultaneously, in biological organisms as well as in in vivo systems by the incorporation of the heavy isotope deuterium during steps of reductive synthesis. Herein we applied this method to determine ethanol induced disturbances in the synthesis and turnover of serum, liver and pancreatic tissue long chain fatty acids in order to reveal tissue specific abnormalities in these vital metabolite processes for organ function.
Figure 2 shows typical raw fatty acid chromatograms of the liver and pancreas of animals treated with ethanol for 6 weeks through their diet. The individual fatty acids are shown in their order of elution from the GC column as follows: myristate (M; C14), palmitate (P; C16), palmitate (PO; C16:1[9]), stearate (S; C18), oleate (O; C18:1[9]), and linoleate (L; C18:2[6:9]). It can be depicted from the figure that the most abundant fatty acid species are palmitate, stearate and oleate in the liver and pancreas of both control and ethanol treated rats, therefore these fatty acids were subjected to detailed mass isotopomer distribution analysis (MIDA) as shown later. By integrating metabolite peak areas and heights it is evident that control liver contains more oleate than stearate, indicating active fatty acid synthesis, chain elongation and desaturation. Ethanol treatment induces a visible increase in stearate tissue content, which does not go through consequent desaturation as seen in control livers. Control pancreas tissue contains roughly equal amounts of stearate and oleate. However, after ethanol treatment the pancreatic tissue shows a visible increase in the desaturation of stearate into oleate.
Figure 2. Fatty acid chromatogram of control (left) and ethanol treated (right) liver (A) and pancreas (B) of rats treated for 6 weeks with ethanol diet.
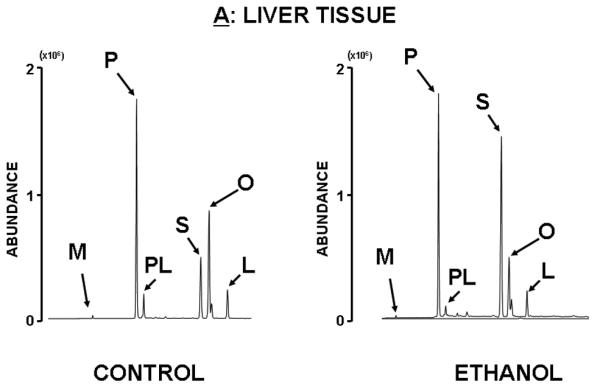
There are discernible changes in fatty acid ratios in these organs after ethanol treatment and these changes reveal opposite and robust metabolic response from the liver and pancreas as shown by fatty acid peak heights. For example, in liver tissue the increase in stearate (S) and decrease in desaturated fatty acids such as palmitoleate (PL), oleate (O) and linoleate (L) are apparent, while in the pancreas opposite changes are evident.
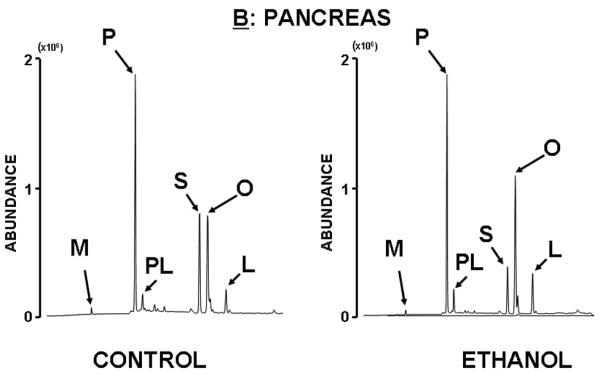
It was evident that palmitate is the most abundant fatty acid in the liver, pancreas and serum of control animals. Based on the noticeable alterations in fatty acid peak areas and heights, which point to significant tissue fatty acid concentration and ratio diversities in liver and pancreas after ethanol treatment we determined fatty acid tissue concentrations (100 mg tissue) by integrated peak areas and normalized them to palmitate (100 per cent) for easy comparison. Serum fatty acid palmitate, stearate and oleate ratios did not show response to ethanol, indicating the precise regulation of triglyceride assembly with the appropriate ~63% stearate and ~38% oleate ratio in control and ethanol treated animals (Figure 3; A). On the other hand, ethanol treatment resulted in a significant increase in stearate ratio compared to palmitate from 35% (SD±4) [control] to 106% (SD±9; p<0.01) [ethanol], while decreasing the oleate ratio from 60 % (SD±8) [control] to 39% (SD±3; p<0.01) [ethanol] in the liver (Figure 3; B). The pancreas showed opposite changes in fatty acid tissue composition as the ratio of stearate fell from 47% (SD±5) [control] to 39% (SD±6; p<0.01), while increasing oleate from 59% (SD±11) [control] to 77% (SD±4; p<0.01) [ethanol] (Figure 3; C). These observations are consistent with a prominent yet divergent intra-organ reconstruction and remodeling of the fatty acid architecture in the liver and pancreas in response to chronic ethanol treatment.
Figure 3.
Fatty acid tissue ratios expressed as per cent of the palmitate peak in control and ethanol treated rats. Palmitate is 100% (not shown), stearate and oleate are shown as percent of palmitate levels, white bars represent control and grey bars represent ethanol treatment. Serum fatty acid ratios (A) remained constant in control and ethanol treated animals.Liver cells (B) accumulate significant amounts of stearate compared to palmitate and oleate while pancreatic cells (C) accumulate oleate primarily in response to ethanol treatment. (Average (±SD) of Control (n=3)/ethanol treated (n=3) animals; *p<0.01)
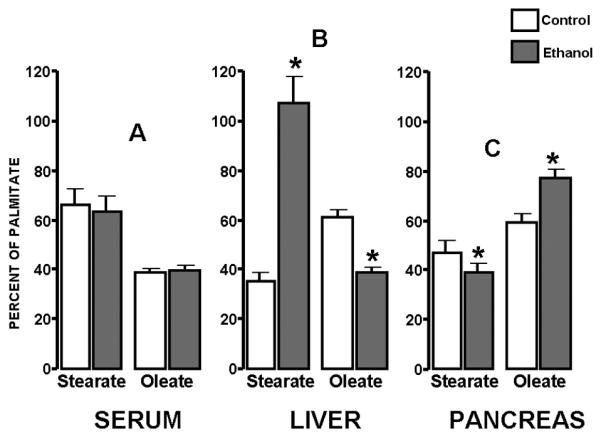
Figure 4 shows the fraction of deuterium labeled newly synthesized palmitate, stearate and oleate as per cent of total palmitate, stearate and oleate, respectively, in the serum, liver and pancreas of control and ethanol treated animals. It can be depicted from the figure that the fraction of newly synthesized saturated fatty acids (palmitate and stearate) is uniformly decreased in the serum (A), liver (B) and pancreas (C). In control animals the new fractions of palmitate, stearate and oleate are almost identical in the serum (A) and liver (B) indicated by the white bars, which confirms the central role of liver in new fatty acid synthesis and transport. However, after ethanol treatment a main difference appears, that is, the still relatively high de novo stearate synthesis in liver does not appear in serum as deuterium labeled stearate shown by the gray bars. This indicates lack of transport and compartmentalization of fatty acids, especially stearate, in the liver after ethanol exposure.
Figure 4. Fraction of new palmitate, stearate and oleate in control and ethanol-treated serum, liver and pancreas.
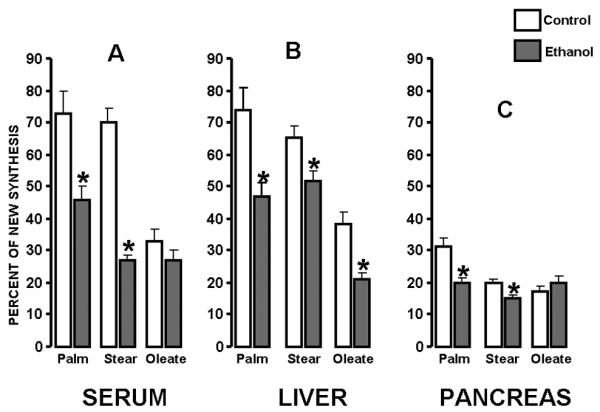
In general, de novo fatty acid synthesis is decreased in the liver and pancreas, which also appears in the serum due to transport, in most part, from the liver. Interestingly, newly synthesized stearate in liver (B) does not appear in the serum of ethanol treated animals (A) demonstrating a severe defect in long chain saturated fatty acid transport from the ethanol exposed liver. The “Y” axis shows Fraction of New Synthesis of each fatty acid as percent of the total corresponding fatty acid pool in tissues as indicated on “X”. (Palm=palmitate, Stear=stearate; Average+SD; n=3; *p<0.05)
Labeling of palmitate by deuterium fell from 74% (SD±6) [control] to 47% (SD±9; p<0.01) [ethanol] in the liver (Figure 4 B), and from 31% (SD±5) [control] to 20% (SD±13; p<0.01) [ethanol] in the pancreas (Figure 4 C). Deuterium labeling in stearate also fell from 65% (SD±13) [control] to 52% (±14; p<0.01) [ethanol] in the liver, and from 20% (SD±6) [control] to 15% (SD±15; p<0.05) [ethanol] in the pancreas. On the other hand, oleate deuterium labeling showed an opposite labeling patterns in the liver and pancreas. While oleate deuterium labeling still decreased from 38% (SD±4) [control] to 21% (SD±1; p<0.01) [ethanol] in the liver, oleate labeling actually increased from 17% (SD±4) [control] to 20% (SD±5; p<0.05) [ethanol] in the pancreas. These findings clearly indicate that ethanol lipotoxicity is mediated by significant diminished oleate synthesis and accumulation of stearate. The abnormal saturated to unsaturated fatty acid ratio presents a constraint on triglyceride transport leading to fat accumulation and an apparent decrease in new synthesis, and remodeling in the liver. On the other hand, fatty acids in the pancreas are probably derived from uptake from serum and the composition is regulated by chain elongation and desaturation.
Discussion
The primary site of de novo fatty acid synthesis is the mammalian liver where triglycerides are assembled and transported to the serum for delivery and storage in fat tissue. Studies have long suggested that alcohol (chemically known as ethanol) interferes with the processes that regulate the balance between lipid breakdown (oxidation of the β—carbon) as a source of energy and lipid synthesis de novo. Lipid metabolism is profoundly altered in alcohol-dependent patients (Crabb 2004; Crabb and Lianpunsakul 2006). These processes of lipid synthesis and breakdown are regulated by several factors that control the activation (i.e., transcription) of genes involved in lipid metabolism. Two of these factors are the peroxisomal proliferator–activated receptors (PPARs) and the sterol response element–binding proteins (SREBPs)-1 and -2. PPARs are hormone receptors located in the cell nucleus with a significant role in directly binding specific fatty acids and consequently activating their oxidation pathways in cell organelles such as peroxisomes or mitochondria (PPARα), regulating energy disspipation (PPARβ) or stimulating lipogenesis (PPARγ). SREBPs act as “sensors” for fatty acid and cholesterol levels in blood and tissue, thereby helping to maintain constant levels (i.e., homeostasis) of lipids in the body. Increased peroxisomal lipid oxidation resulting from alcohol exposure readily leads to the generation of highly reactive oxygen-containing particles (ROS), which can cause damage in a variety of tissues (Lieber 2004). Although methods for measuring lipids continue to develop and improve (Mutch 2006), it seems that more elaborate approaches such as measuring fatty acid rate of synthesis and turnover via specific metabolic reactions with the important ratios for optimum transport and storage are still to be evaluated. For example, it has been suggested that liver lipids of alcohol-dependent patients contain a higher ratio of unsaturated fatty acids than those of nonalcoholic control subjects (Bunout 1999). This observation implies that alcohol-dependent patients have an elevated activity of the oleate producing enzyme called stearoyl-CoA desaturase. Pawlosky and Salem (1999) in Rhesus monkeys showed for example that although alcohol consumption does not affect the absorption of unsaturated fatty acids into circulation, the elongation of these fatty acids into longer-chain molecules was increased, suggesting that alcohol enhances rather fatty acid chain elongation of valuable polyunsaturated fatty acids necessary for membrane assembly and triglyceride transport of the healthy liver and other tissues.
In our tracer substrate based metabolomics study control animals show similar distribution of newly synthesized palmitate, stearate and oleate in liver and serum triglycerides indicating the central role of liver cells for fatty acid synthesis, triglyceride assembly and transport. There is, however, a significant accumulation of newly synthesized stearate in the liver of ethanol treated animals, which does not appear in serum triglycerides. As the properties of any specific fat molecule depend on the particular fatty acids that contribute it, fatty acids with long chains are more susceptible to intermolecular forces of attraction (in this case, van der Waals forces) raising its melting point and therefore decreasing fluidity and transportability via cellular membranes. In fact, fasting serum triglycerides contain fatty acid ratios of the third scale, namely each oleate molecule is assembled with two long chain saturated fatty acid species for each triglyceride, one palmitate and the other one either palmitate or stearate next to the essential oleate. This can be seen in our study on figure 3 where circulating serum fatty acid ratios clearly demonstrate this rule.
In the same intragastric infusion model of alcohol administration severe liver steatosis ensues (Tsukamoto et al. 2005; French et al. 1986), which herein is supported by the distorted high saturated fatty acid ratios of stearate to oleate and its functional consequence in limiting fatty acid transport from the liver. Although this increase is not the result of increased de novo synthesis based on the relatively lower deuterium labeling of liver palmitate, stearate and oleate after alcohol treatment. The mechanism of alcoholic liver fat deposition in this model is more complex, which rather involves decreased flux through desaturase which acts as a constraint on long chain enriched triglyceride transport and delivery to fat tissues. Although this finding is incongruous with the finding that alcohol-dependent patients have an elevated activity of stearoyl-CoA(Δ9)-desaturase, which’s product is oleate, previous studies did not measure flux directly through this reaction in an in vivo ethanol metabolizing system. Furthermore, a study in micropigs chronically fed alcohol, demonstrates selective inhibition of Δ6 and Δ5 but not Δ9 desaturase activities (Nakamura et al. 1994). Never the less our study also points to the important role desaturases and their unsaturated fatty acid products play in the development and pathophysiology of liver steatosis in alcoholism. In fact, increased Δ9-desaturase activity in prolonged alcohol consumption may indicate decreased flux and its resulting negative feedback regulatory effect due to the lack of unsaturated products on desaturase enzyme protein expression and/or synthesis.
Based on these discrepancies and limited understanding of ethanol’s System effect on cellular and host metabolism it is crucial to perform additional tracer substrate based metabolomics studies in order to test the hypothesis that as alcohol endures first degree reaction type breakdown as a toxic agent and therefore it inhibits fatty acid desaturase flux via its excessive surplus of competing hydrogen atoms introduced into metabolism. Such hypothesis, if proven true, would allow the modeling, measuring and counteracting of the ethanol-posed metabolic flux constraints on desaturase, its flux and product oleate as one necessary desaturated fatty acid providing optimum ratio for oxidation and transport of other fatty acids including palmitate and stearate. The metabolic constraint exerted by ethanol on the liver follows fist degree reaction kinetics and can be calculated by:
Where V: reaction rate; k: reaction constant; t: reaction time and c: tissue/serum concentration of ethanol. Generating the integral of formula (A): ln c=−kt (B)
will allow to measure ethanol-related constraints via hydrogen flux in an integrated metabolic network with a competing saturated fatty acid substrate (stearate) providing molar equivalent hydrogen (2H) during product (oleate) synthesis and therefore sharing NAD+ and NAD(P)+ dependent reactions and their regenerating capacity through terminal (biological) oxidation in the TCA cycle and 2H2O, the non-organic end-products of both stearate desaturation into oleate and ethanol breakdown into acetate.
It is particularly interesting in our study that in the pancreas, on the contrary, increased oleate synthesis from stearate is evident upon chronic ethanol exposure posing a significant diversity of pancreas related fatty acid metabolism to that of liver. As chronic alcohol exposure produces high levels of fatty acid ethyl esters (FAEEs) in serum, the non-oxidative products of ethanol metabolism, the observed trypsinogen activation and vacuolization of acinar cells specific to the pancreas provide direct evidence that FAEEs produce pancreas-specific toxicity via non-oxidative metabolism (Werner et al. 1997). Non-oxidative metabolism of ethanol poses no metabolic constraint, in fact, is being accelerated as much as 9-fold by oleate administration as shown in acinar cell cultures (Haber et al. 2004). The increased glandular content of digestive enzymes, increased glandular content of the lysosomal enzyme cathepsin-B with the potential of activating trypsinogen, increased fragility of lysosomes due to increased membrane fluidity induced by high oleic acid synthesis or its esters, and increased fragility of zymogen granules all constitute a “primed” setting (the “Drinker's Pancreas”) for autodigestion (Apte et al. 1994).
We acknowledge one potential limitation of this study as we selected equal calorie intake with the ethanol supplementation diet for control rats using excess carbohydrate in their diet. In the experimental paradigm thus the control rats received 39.8% carbohydrate calories, while ethanol fed animals received about 15.5% carbohydrate calories. Although the effect of different carbohydrate feeding on fatty acid synthesis is not known, we believe that excess carbohydrates impact less on fatty acid synthesis, chain elongation and desaturation than a mismatch in calorie intake does. This is due to the fact that ethanol and carbohydrates require mitochondria linked oxidation and have the same order of hydrogen saturation, while excess dietary fatty acids would increase peroxisomal activity and would directly interfere with the goals of this tracer study. Clearly, any change in macronutrient composition will affect de novo lipogenesis, making it difficult to design the perfect control experimental model (Lee et al., 2000).
The discrepancy between the increased oleate to palmitate ratio (Figure 3) but maintained oleate de novo synthesis (Figure 4) in the pancreas points to an important metabolic diversity between the liver and pancreas. This involves the diversities in synthesis and efflux of fatty acids/triglycerides from liver but rather influx and uptake of fatty acids/triglycerides from plasma by the pancreas. This is indicated by the similar pattern of new fatty acid fractions in the plasma and pancreas but not in liver after ethanol treatment regarding oleate’s deuterium labeling.
In order to further clarify the diverse metabolic mechanisms of ethanol and fatty acid ethyl esters induced liver and pancreatic tissue specific toxicities additional metabolomics studies are necessary. Our data clearly warrant these studies to further clarify destinies of fatty acids for building endoplasmic reticulum, Golgi apparatus, cell membrane and zymogen in hepatocytes and acinar cells using 13C metabolic substrate–based fatty acid and intermediary metabolite product profiles, and to compare and correlate ethanol-induced tissue specific metabolic changes via determining not only the synthesis and turnover rates of fatty acids allowed by 2H2O but also altered metabolic substrate-product relationships induced by alcoholism.
Acknowledgements
This work was supported by the PHS M01-RR00425 of the General Clinical Research Unit, by P01-CA42710 of the UCLA Clinical Nutrition Research Unit Stable Isotope Core to W-NPL; P50AA11999 (Southern California Research Center for ALPD and Cirrhosis) to QD and HD; by Medical Research Service of the Department of Veterans Affairs to SP; by the Hirshberg Foundation for Pancreatic Caner research to LGB; and by P01 AT003960-01A1 grant for the UCLA Center for Excellence in Pancreatic Diseases to W-NPL, LGB, SP and V-LWG.
The text and art work of this article were co-edited by Tracy Lagunero and Javad J. Fatollahi of SiDMAP, LLC, Los Angeles, California.
References
- Aije HO, Connor MJ, Lee WNP, et al. In vivo study of the biosynthesis of long chain fatty acids (LCFA) using deuterated water (D2O) Am J Physiol. 1995;269:E247–E252. doi: 10.1152/ajpendo.1995.269.2.E247. [DOI] [PubMed] [Google Scholar]
- Apte MV, Norton ID, Wilson JS. Ethanol induced acinar cell injury. Alcohol Alcohol Suppl. 1994;2:365–8. [PubMed] [Google Scholar]
- Axelson M, Cronholm T, Sahlberg BL, et al. Changes in the metabolic profile of steroids in urine during ethanol metabolism in man. J Steroid Biochem. 1981;14:155–159. doi: 10.1016/0022-4731(81)90168-0. [DOI] [PubMed] [Google Scholar]
- Bassilian S, Ahmed S, Lim SK, et al. Loss of regulation of lipogenesis in the Zucker diabetic rat. II. Changes in stearate and oleate synthesis. Am J Physiol Endocrinol Metab. 2002;282:E507–13. doi: 10.1152/ajpendo.00211.2001. [DOI] [PubMed] [Google Scholar]
- Crabb DW. Alcohol deranges hepatic lipid metabolism via altered transcriptional regulation. Transactions Am Clin and Climatological Assoc. 2004;115:273–287. [PMC free article] [PubMed] [Google Scholar]
- Crabb DW, Liangpunsakul S. Alcohol and lipid metabolism. J Gastroenterol and Hepatol. 2006;21(Suppl. 3):S56–S60. doi: 10.1111/j.1440-1746.2006.04582.x. [DOI] [PubMed] [Google Scholar]
- Lee WN, Bassilian S, Lim S, et al. Loss of regulation of lipogenesis in the Zucker diabetic (ZDF) rat. Am J Physiol Endocrinol Metab. 2000;279:E425–32. doi: 10.1152/ajpendo.2000.279.2.E425. [DOI] [PubMed] [Google Scholar]
- Boros LG, Cascante M, Lee WN. Metabolic profiling of cell growth and death in cancer: applications in drug discovery. Drug Discov Today. 2002 Mar 15;7(6):364–72. doi: 10.1016/s1359-6446(02)02179-7. [DOI] [PubMed] [Google Scholar]
- Buchanan TA, Xiang A, Kjos SL, et al. Gestational diabetes: antepartum characteristics that predict postpartum glucose intolerance and type 2 diabetes in Latino women. Diabetes. 1998 Aug;47(8):1302–10. doi: 10.2337/diab.47.8.1302. [DOI] [PubMed] [Google Scholar]
- Bunout D. Nutritional and metabolic effects of alcoholism: Their relationship with alcoholic liver disease. Nutrition. 1999;15:583–589. doi: 10.1016/s0899-9007(99)00090-8. [DOI] [PubMed] [Google Scholar]
- Dunn WB, Ellis DI. Metabolomics: Current analytical platforms and methodologies. Trends in Anal Chem TRAC. 2005;24:285–294. [Google Scholar]
- Fiehn O. Metabolomics: The link between genotypes and phenotypes. Plant Mol Bio. 2002;48:155–171. [PubMed] [Google Scholar]
- French SW, Miyamoto K, Tsukamoto H. Ethanol-induced hepatic fibrosis in the rat: role of the amount of dietary fat. Alcohol Clin Exp Res. 1986;10:13S–19S. doi: 10.1111/j.1530-0277.1986.tb05175.x. [DOI] [PubMed] [Google Scholar]
- Goodacre R, Vaidyanathan S, Dunn WB, et al. Metabolomics by numbers: Acquiring and understanding global metabolite data. Trends Biotech. 2004;22:245–252. doi: 10.1016/j.tibtech.2004.03.007. [DOI] [PubMed] [Google Scholar]
- Haber PS, Apte MV, Moran C, et al. Non-oxidative metabolism of ethanol by rat pancreatic acini. Pancreatol. 2004;4:82–9. doi: 10.1159/000077608. [DOI] [PubMed] [Google Scholar]
- Lee WNP, Byerley LO, Bergner EA, et al. Mass isotopomer analysis: Theoretical and practical considerations. Biol Mass Spectrom. 1991;20:451–458. doi: 10.1002/bms.1200200804. [DOI] [PubMed] [Google Scholar]
- Lee WNP. Stable isotope and mass isotopomer study of fatty acid and cholesterol synthesis: A review of the MIDA approach. In: Heber D, Kritchevsy D, editors. Dietary Fats, Lipids, Hormones and Tumorogenesis: New Horizons in Basic Research. Plenum Publishers; London: 1996. pp. 95–114. [DOI] [PubMed] [Google Scholar]
- Lieber CS. Alcoholic fatty liver: Its pathogenesis and mechanism of progression to inflammation and fibrosis. Alcohol. 2004;34:9–19. doi: 10.1016/j.alcohol.2004.07.008. [DOI] [PubMed] [Google Scholar]
- Maguire G, Lee P, Boros L. Development of tracer-based metabolomics and its implications for the pharmaceutical industry. Intl J Pharmacy and Medicine. 2007;21:217–224. [Google Scholar]
- Maguire G, Lee P, Manheim D, et al. SiDMAP: A metabolomic approach to assess the effects of drug candidates on the dynamic properties of biochemical pathways. Expert Opinion in Drug Discovery. 2006;1:351–359. doi: 10.1517/17460441.1.4.351. [DOI] [PubMed] [Google Scholar]
- Mutch DM, Fauconnot L, Grigorov M, et al. Putting the “Ome” in lipid metabolism. Biotechnology Annual Review. 2006;12:67–84. doi: 10.1016/S1387-2656(06)12003-7. [DOI] [PubMed] [Google Scholar]
- Nakamura MT, Tang AB, Villanueva J, Halsted CH, Phinney SD. Selective reduction of delta 6 and delta 5 desaturase activities but not delta 9 desaturase in micropigs chronically fed ethanol. J Clin Invest. 1994;93:450–4. doi: 10.1172/JCI116981. [DOI] [PMC free article] [PubMed] [Google Scholar]
- Patton GM, Cann S, Brunengraber H, et al. Separation of methyl esters of fatty acids by gas chromatography on capillary columns, including the separation of deuterated from nondeuterated fatty acids. Methods Enzymol. 1981;72:8–20. doi: 10.1016/s0076-6879(81)72004-4. [DOI] [PubMed] [Google Scholar]
- Pawlosky RJ, Salem N., Jr. Alcohol consumption in rhesus monkeys depletes tissues of polyunsaturated fatty acids and alters essential fatty acid metabolism. Alcoholism: Clinical and Experimental Research. 1999;23:311–317. [PubMed] [Google Scholar]
- Tsukamoto H, Reidelberger RD, French SW, et al. Long-term cannulation model for blood sampling and intragastric infusion in the rat. Am J Physiol. 1984;247:R595–9. doi: 10.1152/ajpregu.1984.247.3.R595. [DOI] [PubMed] [Google Scholar]
- Tsukamoto H, French SW, Benson N, et al. Severe and progressive steatosis and focal necrosis in rat liver induced by continuous intragastric infusion of ethanol and low fat diet. Hepatology. 1985;5:224–232. doi: 10.1002/hep.1840050212. [DOI] [PubMed] [Google Scholar]
- Tsukamoto H, Mkrtchyan H, Dynnyk A. Intragastric ethanol infusion model in rodents. In: Nagy LE, editor. Alcohol: Methods and Protocols. Humana Press; 2008. pp. 33–48. [DOI] [PubMed] [Google Scholar]
- Wadke M, Brunengraber H, Lowenstein JM, et al. Fatty acid synthesis by liver perfused with deuterated and tritiated water. Biochem. 1973;12:2619–24. doi: 10.1021/bi00738a011. [DOI] [PubMed] [Google Scholar]
- Weiner H, Coker FG, Vrbanac JJ. Application of metabolic profiling to study the effects of ethanol on metabolism in rats. Alcohol. 1984;1:105–109. doi: 10.1016/0741-8329(84)90064-8. [DOI] [PubMed] [Google Scholar]
- Werner J, Laposata M, Fernández-del Castillo C, et al. Pancreatic injury in rats induced by fatty acid ethyl ester, a nonoxidative metabolite of alcohol. Gastroenterology. 1997;113:286–94. doi: 10.1016/s0016-5085(97)70106-9. [DOI] [PubMed] [Google Scholar]