Abstract
We investigate the non-linear dynamics of superparamagnetic beads moving around the periphery of patterned magnetic disks in the presence of an in-plane rotating magnetic field. Three different dynamical regimes are observed in experiments, including (1) phase-locked motion at low driving frequencies, (2) phase-slipping motion above the first critical frequency fc1, and (3) phase-insulated motion above the second critical frequency fc2. Experiments with Janus particles were used to confirm that the beads move by sliding rather than rolling. The rest of the experiments were conducted on spherical, isotropic magnetic beads, in which automated particle position tracking algorithms were used to analyze the bead dynamics. Experimental results in the phase-locked and phase-slipping regimes correlate well with numerical simulations. Additional assumptions are required to predict the onset of the phase-insulated regime, in which the beads are trapped in closed orbits; however, the origin of the phase-insulated state appears to result from local magnetization defects. These results indicate that these three dynamical states are universal properties of bead motion in non-uniform oscillators.
I. INTRODUCTION
Controlling the transport of micron and sub-micron diameter colloidal beads as carriers in aqueous fluids is of great interest for myriad biological applications. Several techniques have been developed to control bead motion, based on optical tweezers,1–3 electromagnetic tweezers,4,5 dielectrophoresis,6,7 acoustic traps,8,9 and on-chip micromagnets.10–15 In particular, the ability to control large numbers of beads in parallel, by employing an external field and magnetizable features patterned in substrates, shows high potential for remotely organizing single particles and cells on on-chip.
Many applications require the ability to separate colloidal components based on size or some other physical or chemical properties. Hence, there has been great interest in exploiting the non-linear dynamics of bead motion in translating potential energy landscapes. The separation mechanism is typically based on tailoring the balance between the applied force and hydrodynamic resistance for different sized particles. This approach has been studied previously in colloidal suspensions interacting with arrays of optical traps,16,17 or in periodic magnetization patterns exposed to a time-varying magnetic field.10–12,14,18–22 Magnetic separation, in particular, has notable advantages including its biocompatibility, absence of magnetic shielding from the environment, the wide selection of commercially available magnetic beads, and finally its ability to apply strong forces remotely to colloidal particles without significant heating or other deleterious effects.
There have been several prior studies of magnetic bead motion through periodic potential energy landscapes. In one example, micron sized beads have been sorted in a quasi-1D potential energy landscape induced by an array of ferromagnetic disks exposed to a magnetic field rotating in the xz-plane.21–23 In another example, magnetic beads are transported through a 2D energy landscape induced by a hexagonal array of cylindrical magnetic “bubble” domains in uniaxial ferrite garnet films exposed to a conical magnetic field profile.18,24,25
The non-linear dynamics of bead motion through periodic lattices has also been studied both theoretically and experimentally.21,26 Prior theoretical investigations were motivated by the experimental discovery of a third dynamical regime,14 in which magnetic beads were observed to enter into closed orbits, exhibiting effectively zero time-averaged translational motion across the substrate. This “phase-insulated” state is not predicted by the classical dynamics of synchronization behavior in a monochromatic non-uniform oscillator,27 which spurred the development of new theoretical models to understand this dynamical regime for its potential in a high resolution magnetic separation.
Simulations first showed that the inclusion of multiple interacting oscillators was found to adequately predict the phase-insulated state, as well as the onset of quasi-periodic velocity states, resembling a “devil's staircase.”21 These predictions were later confirmed in experiments,26 which showed clear quasi-periodic phase locking behavior, as well as the existence of the phase-insulated state above a critical frequency. However, it is far from clear whether the phase-insulated regime exists just in this previously studied system, or whether these dynamics are universally present in other types of non-linear dynamical systems.
Here, we demonstrate another example of this non-linear dynamic behavior in a system of magnetic beads exposed to an array of patterned disks of soft permalloy (NiFe), which are driven by an in-plane rotating field. Unlike prior studies, in which the magnetic beads experience strongly varying magnetic field profiles during translational motion, we investigate a system in which the magnetic field profile is weakly varying, and in some cases, quasi-static, within the translating reference frame of the bead. Even in this system, we show the existence of phase-locked, phase-slipping, and phase-insulated regimes. We speculate that the origin of the phase-insulated regime is caused by the slight inhomogeneity in the shape or magnetization profile of the disks in a horizontally rotating magnetic field. This rationale is supported by the observation that magnetic beads stick preferentially to specific sites on the magnet, where there may be a defect or other irregularity. Since it is impossible to fabricate perfect magnetization patterns, these results suggest that particles translating through slightly irregular potential energy landscapes will universally experience these three dynamical regimes and provide improved control mechanisms for achieving high resolution separation between different types of beads.14
II. MATERIALS AND METHODS
Experimental work employed commercially available superparamagnetic beads (Dynabeads M-280 streptavidin, Invitrogen™, Cat. No. 142.03), with a mean diameter of 2.8-μm, which were dispersed in an aqueous medium containing sodium dodecyl sulfate (SDS) surfactant and localized by a polydimethylsiloxane (PDMS) well. The magnetic susceptibility of the beads was measured to be χ = 0.7 in the superconducting quantum interference device (SQUID).28 Janus particles were used in order to determine whether the particle underwent sliding or rolling motion. The Janus particles were prepared by creating monolayer of 8-μm superparamagnetic beads (Sphero™, Cat. No. CM-80-10) on a silicon wafer, onto which a 100-nm Au layer was evaporated (Denton DV-502 E-gun Evaporator). After re-suspending the beads in water, the gold layer allowed the rotational motion of the bead to be optically tracked.
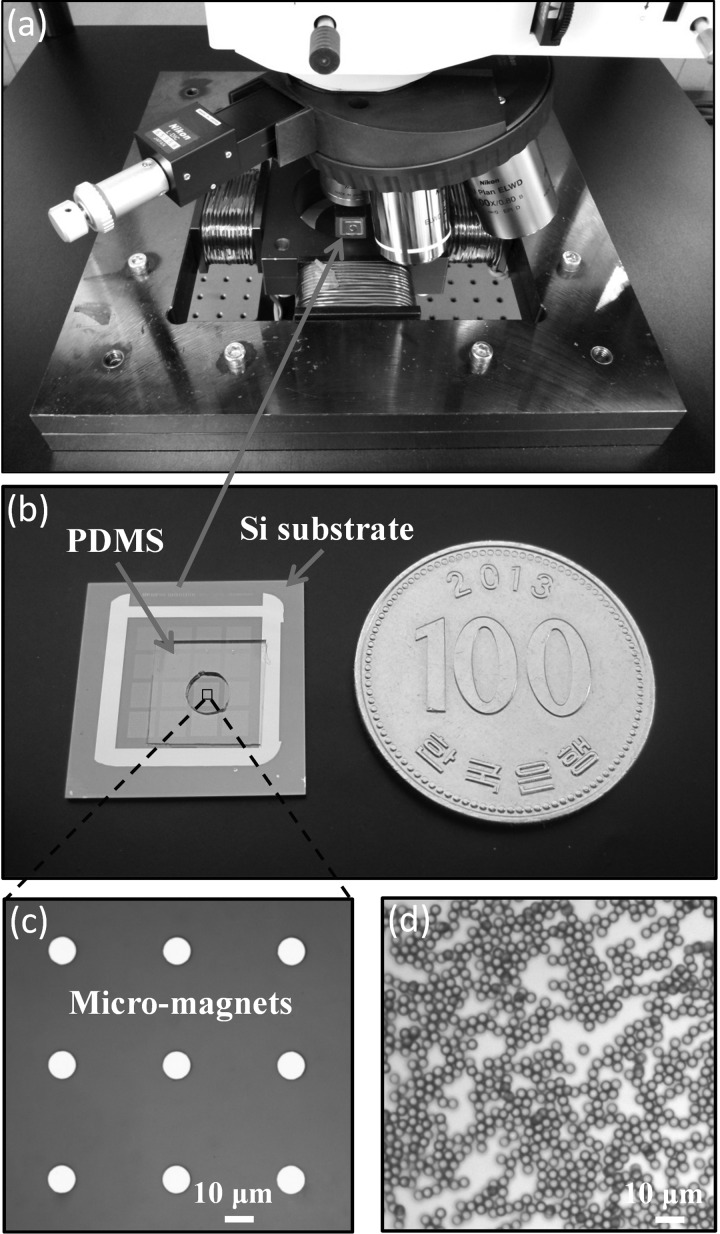
An array of disks was patterned on silicon substrates, using direct current sputtering system of 100 nm thick permalloy (Ni82.6Fe17.4) followed by photolithographic liftoff.12 The patterned substrates were then coated with 500 nm film of Teflon (Dupont™, Grade 601S2-100-6) by spin coating at 3500 rpm for 30 s. As shown in Fig. 1, four solenoid coil magnets were used to produce the in-plane rotating magnetic field controlled by LabVIEW (National Instruments) by supplying two sinusoidal currents with 90° phase difference in x- and y-axis, respectively. The samples were placed at the center of the imaging plane in a microscope (LV-UEPI, Nikon). A Gaussmeter (Lakeshore 450) was positioned under the sample to monitor the phase angle of the rotating field, with the angle in the positive x-direction assumed to be the reference point of 0°. The bead trajectories were recorded with a video camera (Guppy Pro F-031, Allied Vision) with a frame rate up to 123 fps, which was controlled by the software FireCapture 2.1. A Matlab code was used to track the position vector of the bead center relative to the disk center. The angle made between this position vector and the x-axis represents the bead phase angle. The phase lag is defined as the difference between the bead phase angle and the external field angle, which describes how far the bead lags behind the translating potential energy landscape.
FIG. 1.
Experimental setup. (a) Four solenoid coil magnets produce the uniform in-plane field. The studied sample is placed at the center of the field area and below the optical microscope. The field strength is monitored from the Gaussmeter positioned below the sample. (b) Micro-magnet arrays deposited on a Si wafer and the Polydimethylsiloxane (PDMS) well for localizing the experimental solution. (c) Microscopic image of the micro-magnet array. (d) Optical image of Dynabeads M-280 Streptavidin beads (2.8-μm diameter).
III. THEORETICAL MODEL AND SIMULATIONS
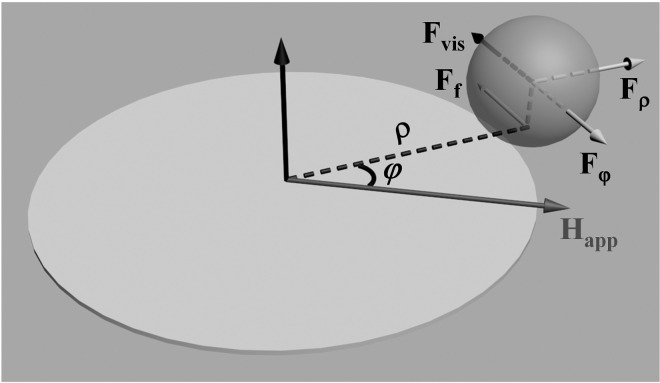
In an externally applied field (Happ), magnetic beads are trapped by the field gradients near the periphery of the micro-magnetic disks. The beads are attracted towards the high field regions, where the magnetostatic potential energy is minimized. The minimum energy locations are shifted around the disks by applying a rotating field in the xy-plane, which causes the magnetic beads to follow the circulating energy minima. The phase lag of the bead relative to the horizontal field axis is denoted as φ, and the radial distance of the bead away from the center of the magnet is denoted as ρ. The forces on the bead are projected along the orthogonal coordinates in the cylindrical coordinate system, where the force tangential to the bead's path is denoted as Fφ, whereas the radial force is Fρ.
The theoretical model is explained in detail elsewhere;12,29 however, in brief, we use semi-analytical approximations to represent the magnetic field of thin disks, which are used to capture the shape-induced demagnetization. Although the approximation comes at the cost of numerical precision, it reduces the computational burden to obtain more feasible trajectory calculations. It is assumed that the permalloy film is magnetically soft (i.e., no hysteresis). Thus the magnetic film can be treated as a surface pole distribution along the exterior of the magnetic film, which means that the volumetric pole density within the interior is ignored. Furthermore, the film is approximated as infinitely flat, which means collapsing the surface pole distribution into a one-dimensional magnetic line pole distribution around the perimeter of thin disks. The resulting magnetostatic potential can be written as
| (1) |
where μ0 is the magnetic permeability of vacuum, stands for the distance between an element of the line pole and the observation point, and represents the line pole density, which varies with time and the outward normal component of the disk perimeter.
We calculate the line pole density at disk perimeter using
| (2) |
where Hout and Hin are fields outside and inside the disk, respectively, and is the thickness of the film. Magnetic beads in uniform magnetic field are approximated as magnetic point dipoles at the particle center with magnetic moment given by
| (3) |
where χp and χf stand for magnetic susceptibilities of the particle (magnetic bead) and the fluid, respectively, and Vp is the volume of the particle. The magnetic force on magnetic beads is approximated as the force of a point dipole in an external field gradient, given by
| (4) |
which is balanced by drag force, given by
| (5) |
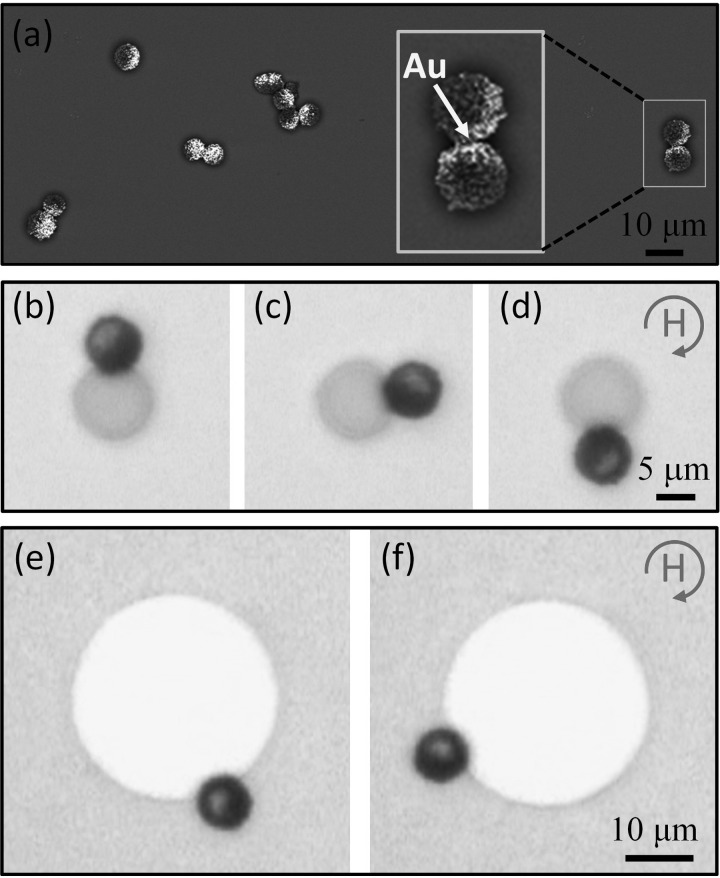
where is the viscosity of water, and is the instantaneous velocity of a particle with radius . In the overdamped limit, the magnetic force is balanced by the viscous fluid damping, Fvis, which is a function of the velocity of the magnetic bead. Other friction forces known to be involved in the transport dynamics include the static and kinetic sliding friction forces between the bead and substrate, Ff, which may induce the bead to roll, as depicted in Fig. 2. However, these other friction forces are difficult to experimentally characterize. Thus, we assumed that the dissipation was produced entirely by a viscous drag force with a best-fitting effective viscosity used to match the experimental trajectories. The rotational motion of the bead was ignored, since the bead was observed to move by sliding rather than rolling (see Fig. 3).
FIG. 2.
Schematics of parameters on a superparamagnetic bead around a disk micro-magnet under an applied in-plane rotating field in clockwise direction.
FIG. 3.
Particle trajectories were simulated with a finite difference time domain analysis, using the force balance from Equations (4) and (5) to determine the instantaneous velocity. Numerical convergence was achieved in simulations by employing a suitably small time step which determines the bead position at a future time point based on the position and velocity at a previous time. A more detailed discussion of the simulation technique is provided in the references.29
IV. RESULTS AND DISCUSSION
By tracking the bright and dark regions of the Janus bead as a function of time, shown in Figs. 3(b)–3(f) and supplementary movie 1, it is clear that the Janus bead motion undergoes phase-locked sliding motion around the disk of 10 and 30 μm diameter (Multimedia view).
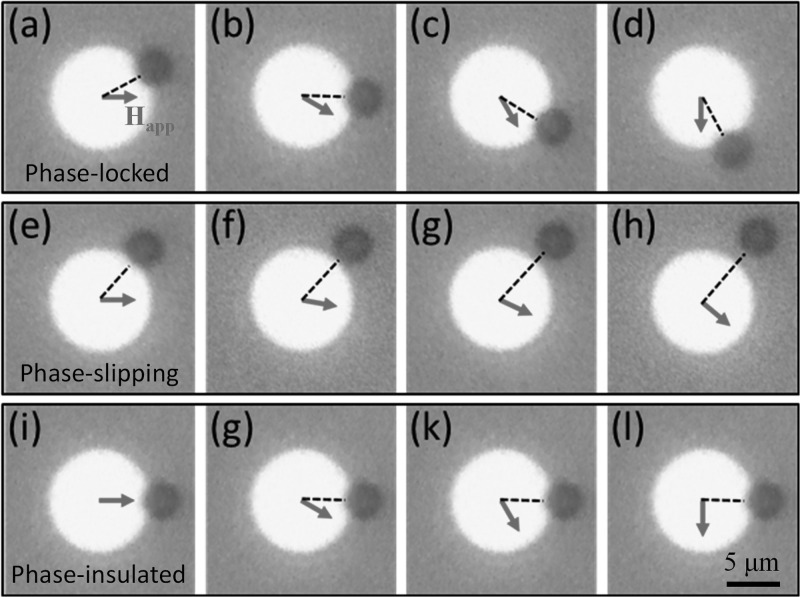
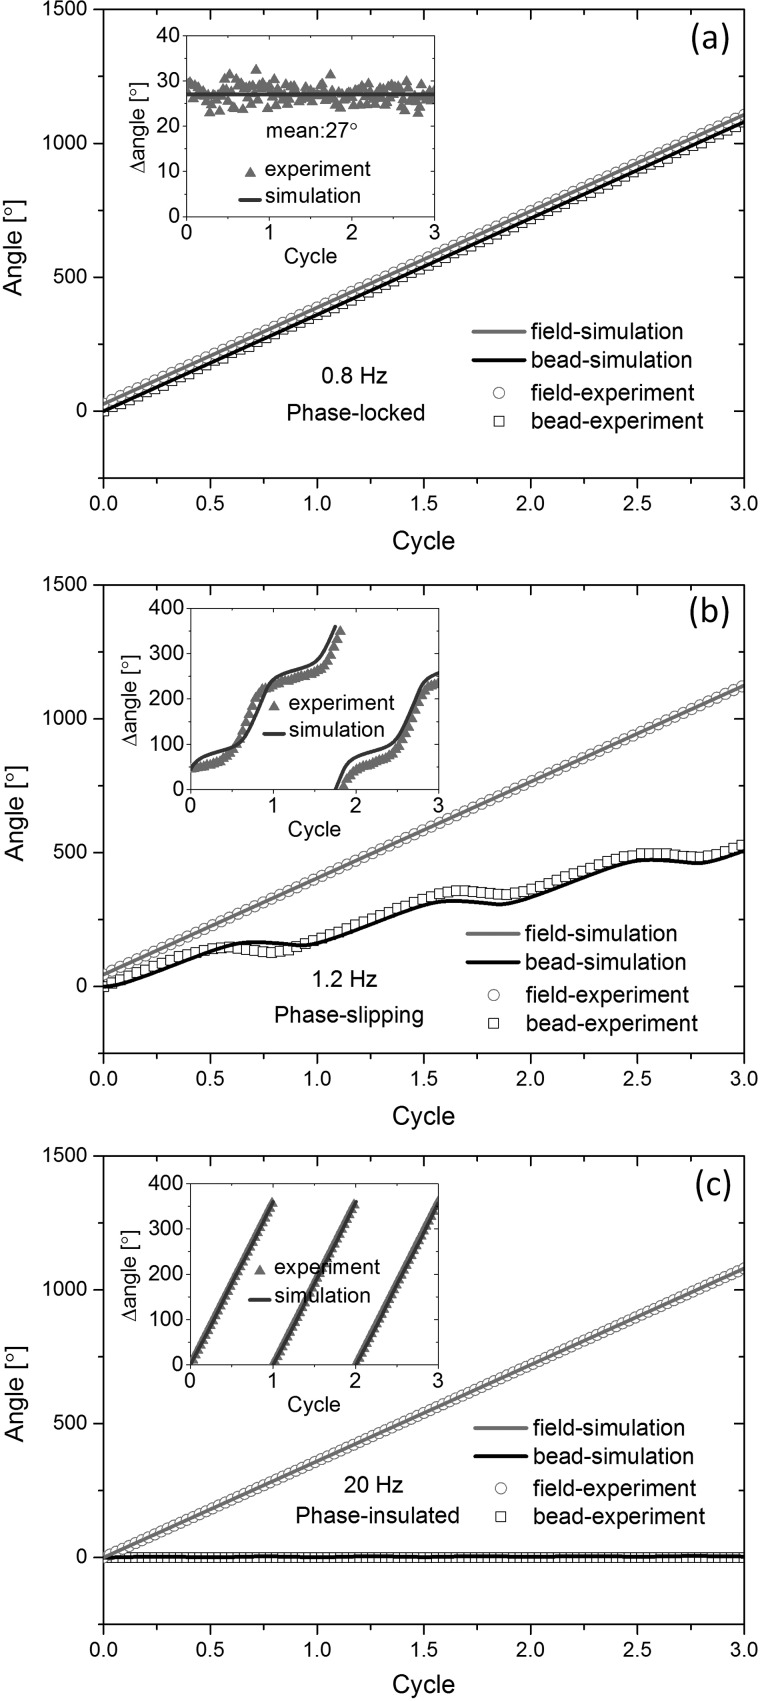
The three regimes of bead motion observed in experiments are shown in Fig. 4 and supplementary movie 2, when exposed to a 2 mT rotating external field applied at different frequencies (Multimedia view). At a driving frequency of 0.8 Hz, which is below the critical frequency fc1, the bead rotates synchronously around the perimeter of the micro-magnet with a fixed phase difference of ∼27° between the instantaneous bead position and the external field direction (see Figs. 4(a)–4(d)). This dynamic mode is known as the “phase-locked” regime, because the bead's phase lag is locked in time. The bead trajectory for the phase-locked regime is also displayed in Fig. 5(a), where the red circles denote the phase angle of the external field, while the black squares denote the bead's phase angle. The bead phase lag, i.e., difference between the field angle and bead position, is shown by the grey triangles in the inset of Fig. 5(a), which is phase-locked at ∼27° for the stated operating conditions.
FIG. 4.
FIG. 5.
(a)–(c) Experimental and simulated phase angles of the Happ, the bead and the phase lag angle (insets) at the three phase regimes as a function of cycle (the initial point of the bead as 0°), under a rotating Happ of 2 mT with different frequencies of 0.8, 1.2, and 20 Hz, respectively.
Phase locked motion results from the balance between the magnetic force and the viscous and frictional drag. As the driving frequency is increased, the higher bead velocity causes it to experience a stronger viscous fluid drag, which increases the bead phase lag. When the bead phase lag reaches the critical condition of 45°,30 the bead can no longer remain in the phase-locked state. The driving frequency associated with this first transition is denoted as fc1.
At a driving frequency of 1.2 Hz, which is above the first critical frequency, fc1, the bead enters the “phase-slipping regime,” which is described as such because the phase difference between the external field direction and the bead position can no longer be constant. Experimental images of the phase-slipping motion are shown in Figs. 4(e)–4(h), and the trajectory is plotted in Fig. 5(b).
Finally, at a driving frequency of 20 Hz, which is above the second critical frequency, fc2, the bead oscillates about a static, fixed position on the perimeter of the magnet. Experimental images of the bead's motion are shown in Figs. 4(i)–4(l), and the trajectory is plotted in Fig. 5(c). This dynamic regime is denoted as the “phase-insulated regime,” because the bead does not follow the external field, and thus behaves similarly to an electrical insulator.
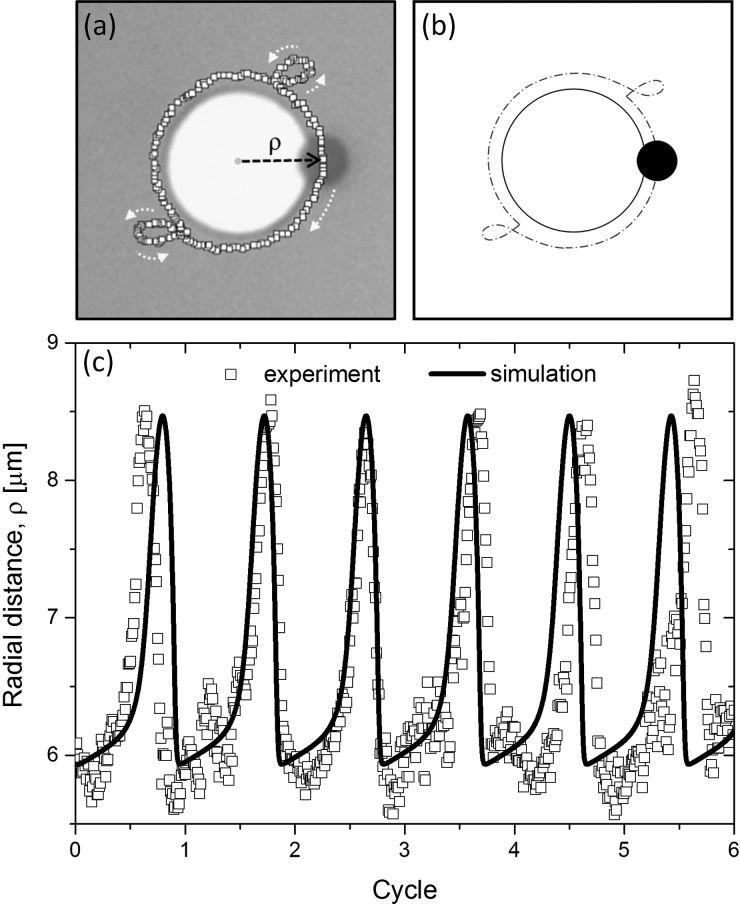
The experimental bead trajectory in the phase-slipping regime in the presence of a 2 mT field, which rotates in the clockwise direction at a frequency of 1.2 Hz, is depicted in Fig. 6(a), where the white circles show the trajectory of the bead as a function of time. Experimental trajectories correspond well with the simulated bead trajectories shown in Fig. 6(b), assuming the volumetric magnetic susceptibility of the bead is 0.7,28 and the relative magnetic permeability of the permalloy patterns is μr = 113.12 Rather than directly evaluating the various forms of friction, we assumed that the dissipation was produced by an effective viscous drag force using a best fitting viscosity of 0.012 mK Pa·s. The radial position of the beads is plotted in Fig. 6(c) as a function of time, where the jumping behaviour is attributed to a repulsive radial force Fρ that occurs at specific time points in the cycle, depending on the instantaneous phase lag of the bead.30 The experimentally observed radial position as a function of time agrees well with the numerically simulated positions, shown in Fig. 6. In the phase-locked and phase-insulated regimes, on the other hand, the radial position maintains a constant value throughout the motion.
FIG. 6.
(a) The experimental bead trajectory in the phase-slipping regime under the rotating Happ of 2 mT with the 1.2 Hz frequency in clockwise direction. ρ represents the radial distance between two centers of the bead and the disk. (b) Corresponding simulated model to Fig. (a). (c) The radial distance ρ as a function of the rotating Happ cycles.
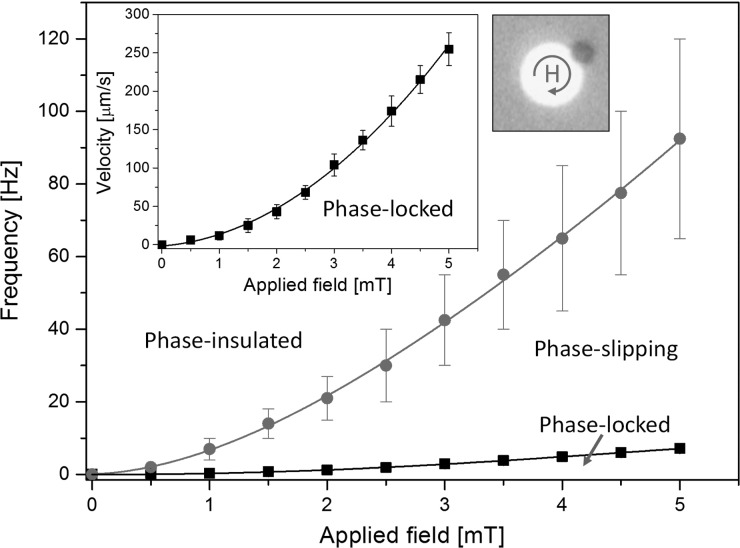
Fig. 7 shows the phase diagram for the frequency and field dependent behaviour of magnetic beads exposed to field strengths ranging from 0 to 5 mT and frequencies ranging from 0 to 120 Hz. All experiments here were averaged for 30 beads to obtain reliable statistics. The critical frequency (fc1) distinguishing the transition between the phase-locked and phase-slipping regime was observed to increase quadratically with the field magnitude, which is expected based on the unsaturated magnetic properties of the beads and film below 5 mT.
FIG. 7.
The inset graph of Fig. 7 displays the maximum velocities (2πρfc1) of the rotating beads for different fields, evaluated by the critical frequencies, fc1, and the measured distance ρ away from the disk center. For the field strength of 5 mT, the beads velocity can be as high as ∼250 μm/s (fc1 = 7.1 Hz). The red line in Fig. 7 depicts the transition between the phase-slipping and phase-insulated regimes, which occurs at critical driving frequencies, fc2. The critical frequency for the 5 mT rotating field was measured to be ∼90 Hz. The criterion for determining phase-insulated motion was based on identifying the minimum frequency for which beads were unable to move during a time period of 10 s. The shape of the second transition curve is similar to the first transition curve, increasing quadratically with the field magnitude.
Our experiments suggest that the phase-insulated regime results from inhomogeneity in the angle-dependent magnetization of the disks. Classical theory of a non-uniform oscillator suggests that if the magnetization strength of the disk is independent of the field angle (i.e., if ), then the particle will never enter the phase-insulated regime except at infinitely high frequencies.27 However, if there is a magnetization defect in the disk pattern (i.e., if ), it can act as a pinning site to trap the bead at a critical point in the cycle, and thereby prevent it from making forward progress around the disk. Evidence for the presence of pinning sites has been observed in our experiments, wherein the magnetic bead becomes trapped at the same location on a given magnet, regardless of the initial conditions and field application protocol. This effect can be observed in supplementary movie 3 and the inset microscope image of Fig. 7, in which the external driving frequency is ramped between 1 Hz and 20 Hz, and the bead becomes trapped at one specific location (Multimedia view). Since it is impossible to fabricate defect-free lithographic patterns, this observation suggests that the phase-insulated regime can be exploited to achieve high resolution separation between different types of beads.
V. CONCLUSION
In summary, we study the non-linear dynamics of beads moving around lithographically patterned NiFe disks. We observe three different dynamical regimes in the presence of an in-plane rotating magnetic field: including a phase-locked at low frequencies, a phase-slipping regime above the first critical frequency fc1, and phase-insulated regime above the second critical frequency fc2. Our experiments with Janus particles demonstrated that bead motion occurs by sliding rather than rolling motion, which allows the system to be modeled with point particle dynamics. The experimental bead trajectories in the phase-slipping regime correspond well with numerical simulations. Moreover, the presence of the phase-insulated regime appears to be caused by defects in the angle-dependent magnetization of the disks. This result lends further support to the expectation that these three dynamical regimes will be present in any physically realizable system for bead transport and suggests that the optimal pathways to tune the frequency of the phase-insulated regime are by breaking symmetry in the shape or adjusting the defect density in the magnets. These results may find use in the development of new systems for separating magnetic beads and cells on-chip. For example, using our half-disk pathway,10–12 different kinds of magnetic beads in the magnetization or scale could be separated due to the different critical frequencies of the bead dynamics.
ACKNOWLEDGMENTS
This work was supported by the DGIST R&D Program of the Ministry of Science, ICT and Technology of Korea (15-HRLA-02). And the authors are thankful for the NIH National Institute of General Medical Sciences - Biotechnology Predoctoral Training Program (T32GM008555) for supporting R.A.N.
References
- 1. Grier D. G., Nature 424, 810 (2003). 10.1038/nature01935 [DOI] [PubMed] [Google Scholar]
- 2. Varanakkottu S. N., George S. D., Baier T., Hardt S., Ewald M., and Biesalski M., Angew. Chem. Int. Ed. 52, 7291 (2013). 10.1002/anie.201302111 [DOI] [PubMed] [Google Scholar]
- 3. Ashkin A., Dziedzic J. M., and Yamane T., Nature 330, 769 (1987). 10.1038/330769a0 [DOI] [PubMed] [Google Scholar]
- 4. Yan J., Skoko D., and Marko J. F., Phys. Rev. E 70, 011905 (2004). 10.1103/PhysRevE.70.011905 [DOI] [PubMed] [Google Scholar]
- 5. Lee H., Purdon A. M., and Westervelt R. M., Appl. Phys. Lett. 85, 1063 (2004). 10.1063/1.1776339 [DOI] [Google Scholar]
- 6. Hughes M. P., Electrophoresis 23, 2569 (2002). [DOI] [PubMed] [Google Scholar]
- 7. Chiou P. Y., Ohta A. T., and Wu M. C., Nature 436, 370 (2005). 10.1038/nature03831 [DOI] [PubMed] [Google Scholar]
- 8. Hertz H. M., J. Appl. Phys. 78, 4845 (1995). 10.1063/1.359770 [DOI] [Google Scholar]
- 9. Islam A. T., Siddique A. H., Ramulu T. S., Reddy V., Eu Y. J., Cho S. H., and Kim C. G., Biomed. Microdevices 14, 1077 (2012). 10.1007/s10544-012-9703-2 [DOI] [PubMed] [Google Scholar]
- 10. Venu R., Lim B., Hu X. H., Jeong I., Ramulu T. S., and Kim C. G., Microfluid. Nanofluid. 14, 277 (2013). 10.1007/s10404-012-1046-z [DOI] [Google Scholar]
- 11. Anandakumar S., Rani V. S., Oh S., Sinha B. L., Takahashi M., and Kim C. G., Biosens. Bioelectron. 26, 1755 (2010). 10.1016/j.bios.2010.08.033 [DOI] [PubMed] [Google Scholar]
- 12. Lim B., Reddy V., Hu X. H., Kim K. W., Jadhav M., Abedini-Nassab R., Noh Y. W., Lim Y. T., Yellen B. B., and Kim C. G., Nat. Commun. 5, 3846 (2014). 10.1038/ncomms4846 [DOI] [PubMed] [Google Scholar]
- 13. Vieira G., Henighan T., Chen A., Hauser A. J., Yang F. Y., Chalmers J. J., and Sooryakumar R., Phys. Rev. Lett. 103, 128101 (2009). 10.1103/PhysRevLett.103.128101 [DOI] [PMC free article] [PubMed] [Google Scholar]
- 14. Yellen B. B., Erb R. M., Son H. S., R. Hewlin, Jr. , Shang H., and Lee G. U., Lab Chip 7, 1681 (2007). 10.1039/b713547e [DOI] [PubMed] [Google Scholar]
- 15. Donolato M., Vavassori P., Gobbi M., Deryabina M., Hansen M. F., Metlushko V., Ilic B., Cantoni M., Petti D., Brivio S., and Bertacco R., Adv. Mater. 22, 2706 (2010). 10.1002/adma.201000146 [DOI] [PubMed] [Google Scholar]
- 16. Pelton M., Ladavac K., and Grier D. G., Phys. Rev. E 70, 031108 (2004). 10.1103/PhysRevE.70.031108 [DOI] [PubMed] [Google Scholar]
- 17. Xiao K. and Grier D. G., Phys. Rev. Lett. 104, 028302 (2010). 10.1103/PhysRevLett.104.028302 [DOI] [PubMed] [Google Scholar]
- 18. Tierno P., Johansen T. H., and Fischer T. M., Phys. Rev. Lett. 99, 038303 (2007). 10.1103/PhysRevLett.99.038303 [DOI] [PubMed] [Google Scholar]
- 19. Henighan T., Chen A., Vieira G., Hauser A. J., Yang F. Y., Chalmers J. J., and Sooryakumar R., Biophys. J. 98, 412 (2010). 10.1016/j.bpj.2009.10.036 [DOI] [PMC free article] [PubMed] [Google Scholar]
- 20. Chen A., Byvank T., Chang W. J., Bharde A., Vieira G., Miller B. L., Chalmers J. J., Bashir R., and Sooryakumar R., Lab Chip 13, 1172 (2013). 10.1039/c2lc41201b [DOI] [PMC free article] [PubMed] [Google Scholar]
- 21. Yellen B. B. and Virgin L. N., Phys. Rev. E 80, 011402 (2009). 10.1103/PhysRevE.80.011402 [DOI] [PubMed] [Google Scholar]
- 22. Tahir M. A., Gao L., Virgin L. N., and Yellen B. B., Phys. Rev. E 84, 011403 (2011). 10.1103/PhysRevE.84.011403 [DOI] [PubMed] [Google Scholar]
- 23. Yellen B. B., Hovorka O., and Friedman G., Proc. Natl. Acad. Sci. U.S.A. 102, 8860 (2005). 10.1073/pnas.0500409102 [DOI] [PMC free article] [PubMed] [Google Scholar]
- 24. Tierno P., Soba A., Johansen T. H., and Sagués F., Appl. Phys. Lett. 93, 214102 (2008). 10.1063/1.3029740 [DOI] [Google Scholar]
- 25. Tierno P., Johansen T. H., and Sagués F., Phys. Rev. E 80, 052401 (2009). 10.1103/PhysRevE.80.052401 [DOI] [PubMed] [Google Scholar]
- 26. Gao L., Gottron N. J. III, Virgin L. N., and Yellen B. B., Lab Chip 10, 2108 (2010). 10.1039/c003836a [DOI] [PubMed] [Google Scholar]
- 27. Strogatz S. H., Nonlinear Dynamics and Chaos with Application to Physics, Biology, Chemistry, and Engineering ( Westview Press, 2000). [Google Scholar]
- 28. Sinha B., Anandakumar S., Oh S., and Kim C. G., Sens. Actuators A 182, 34 (2012). 10.1016/j.sna.2012.05.001 [DOI] [Google Scholar]
- 29. Abedini-Nassab R., Murdoch D. M., Kim C. G., and Yellen B. B., J. Appl. Phys. 115, 244509 (2014). 10.1063/1.4884609 [DOI] [Google Scholar]
- 30. Hu X. H., Lim B., Jeong I., Sandhu A., and Kim C. G., IEEE Trans. Magn. 49, 1 (2013). 10.1109/TMAG.2012.2233551 [DOI] [Google Scholar]


