Abstract
We have simulated the invasion of a polyelectrolyte complex made of a polycation chain and a polyanion chain, by another longer polyanion chain, using the coarse-grained united atom model for the chains and the Langevin dynamics methodology. Our simulations reveal many intricate details of the substitution reaction in terms of conformational changes of the chains and competition between the invading chain and the chain being displaced for the common complementary chain. We show that the invading chain is required to be sufficiently longer than the chain being displaced for effecting the substitution. Yet, having the invading chain to be longer than a certain threshold value does not reduce the substitution time much further. While most of the simulations were carried out in salt-free conditions, we show that presence of salt facilitates the substitution reaction and reduces the substitution time. Analysis of our data shows that the dominant driving force for the substitution process involving polyelectrolytes lies in the release of counterions during the substitution.
I. INTRODUCTION
Aqueous solutions containing oppositely charged macromolecules exhibit rich structural and kinetic behaviors, depending on the concentrations, composition, molecular weights, and charge densities of the polyions, concentration of low molecular weight salts, and temperature. The literature on this subject is extensive1–15 and there are also several excellent reviews describing the phenomenology of solutions of oppositely charged polyelectrolytes.1–3 There are also many simulation and theoretical investigations related to adsorption of polyelectrolytes to oppositely charged solid surfaces and inter-chain interactions.16–34 Basically, in very dilute solutions, the polycations and polyanions spontaneously form complexes. The size of such polyelectrolyte complexes depends on the molecular weights and charge densities of the components, and even the order of mixing of the components. At higher concentrations of the polycations and polyanions, phase separation is of common occurrence and its understanding is presently an actively pursued research topic.15,35
The intense interest in the experimental investigations of polyelectrolyte complexes is stoked by their applications in delivery platforms in the context of drug delivery and gene therapy.2 Typically, a cargo such as DNA (which is negatively charged) is complexed with polycations under suitable experimental conditions and the resulting complexes are then delivered into host sites where the DNA is uncomplexed from its complex. The uncomplexation is presumably by a substitution reaction where a new polymer chain competitively displaces one of the components of the complex. The formation of the complex A-B from A and B and the competitive substitution of A by C are sketched in the cartoon of Fig. 1.
FIG. 1.
Cartoon of the two steps of complexation and substitution.
It is widely recognized that the major component of the driving force for the complexation is the release of counterions which have been adsorbed on the individual polyelectrolyte chains before complexation. This entropic contribution is stronger than even the electrostatic attraction between the polycation and polyanion. Regarding the substitution reaction (second step) in Fig. 1, extensive kinetic studies were conducted some time ago by the Kabanov and Dautzenberg schools,5–10,12–14 with many unexpected findings. For example, smaller polycations would complex first with a longer polyanion before these get displaced ultimately by longer polycations, demonstrating an interplay between kinetics and thermodynamics. Also, the various experimentally investigated systems contained complexes made of many chains, and not just one polycation and one polyanion.
Despite such considerable efforts in the past, the intermolecular forces controlling the complexation (first step in Fig. 1) of two oppositely charged macromolecules and the instability of a complex against an invading molecule remains yet to be fully understood. The objective of the present paper is to address these issues by considering a system of three flexible polyelectrolyte chains (polycation A, polyanion B, and polycation C) which undergo the two steps of Fig. 1. We have employed the Langevin dynamics simulation method with explicit account of counterions, and the solvent being taken as a uniform dielectric continuum. We first address the electric potential around a single polyelectrolyte chain and the radial distribution functions of its segments and counterions. Next, we consider the approach of an oppositely charged flexible chain and determine the nature of the attractive force between the two chains during the complexation process. Finally, we consider the approach of the third chain to the preformed complex and the molecular details of the substitution reaction. Most of the simulations are carried out in salt-free conditions.
We have focused on the underlying force behind the complexation process and the subsequent substitution process. In salt-free environment and for flexible polyelectrolyte chains, we find the force of attraction to be constant during the interpenetrating complexation stage. Simultaneously, each of the two chains in the complex shrinks self-consistently with its complementary chain. An approach by a longer competing chain loosens the complex and the substitution occurs by not completely breaking up the complex but by stepwise displacement of monomers. The time required for successful substitution depends on the length of the invading chain C relative to the chain A being displaced from the complex. We also report that there is a threshold length of the invading chain, beyond which, the substitution time does not shorten much. This effect arises from the release of just enough counterions from the invading chain which correspond to the charges of the resident chain A. Presence of salt is shown to reduce the substitution time.
The rest of the paper is organized as follows. The united atom description for the polyelectrolyte chains and simulation methods are presented in Section II. Simulation results and their discussion are given in Section III, followed by a brief concluding section.
II. MODEL AND SIMULATION METHOD
The flexible polyelectrolyte chains A, B, and C are modeled as freely jointed chains. Each chain has a certain number N of spherical beads carrying either +e or −e charge where e is the fundamental unit charge. The N beads are connected by N − 1 springs. The counterions are also taken as spherical beads with point charge of either +e or −e. When salt is present in the system, it is assumed to be fully dissociated and its cations and anions are taken as spherical beads with point charges just as the counterions. The chains, counterions, and salt ions are placed in a dielectric medium of uniform dielectric constant ϵ and the medium is taken to be a cubic box of volume L3. The various beads of the chains are subjected to excluded volume interaction, bond stretching, and electrostatic interaction. The counterions and salt ions are subjected to electrostatic and excluded volume interactions among themselves and with the polymer beads.
All simulations, in this paper, are carried out using the Langevin dynamics method and with the periodic boundary condition. As details of the simulation method are already presented in our previous papers,17,19,27,28 we give below only the crucial aspects of the simulations. The dynamics of the ith particle (either a bead or an ion) follows the Langevin equation,
| (1) |
where m and ζ are the mass and friction coefficient, respectively, of the ith particle. The position and velocity vectors of the ith particle are, respectively, ri and vi. U is the total potential energy acting on the ith particle. fi is the noise from the heat bath on the ith particle satisfying the fluctuation-dissipation theorem,
| (2) |
with kBT being the Boltzmann constant times the absolute temperature.
For polymer chains, U is a sum of three contributions: (a) excluded volume interaction, (b) bond stretching, and (c) electrostatic interaction. For counterions and salt ions, only the first and third contributions are present.
-
(a)Excluded volume interaction: The non-electrostatic part of the interaction potential between two non-bonded beads is taken as a purely repulsive Lennard-Jones potential,
where ϵLJ is the strength, σ is the hard core distance between two beads, and ϵLJ is used as the unit of energy. The same form of potential is used for the excluded volume interaction between polymer beads, beads and ions, and ions and ions. The value of σ is taken as 1.0l0, 0.8l0, and 0.6l0 for bead-bead, bead-ion, and ion-ion pairs, respectively, where l0 is the equilibrium bond length. l0 is used as the unit of length in the simulation.(3) -
(b)Bond stretching: The potential energy between two consecutive beads in a chain is taken as
where l is the bond length, l0 is the equilibrium bond length, and Kb is the spring constant, which is taken as . In our simulations, fluctuations in bond length are within 10% of l0.(4) -
(c)Electrostatic interaction: The electrostatic interaction between the charged unit i of valence zi and the charged unit j of valence zj, separated by distance rij, is given by the Coulomb law,
where ϵ0 is the permittivity of the vacuum. In our simulations, the strength of the electrostatic interaction between a polymer bead and a counterion is parametrized by the electrostatic strength parameter Γ defined by(5)
where zc is the valency of a counterion (±1), zp is the valency of a polymer bead (±1), and lB is the Bjerrum length,(6) (7)
In the present work, temperature only appears through Γ with the multiplicative combination of T and the dielectric constant ϵ which is specific to the solvent used. For example, the range of Γ is 2.4 < Γ < 3.2 for aqueous solutions (0 °C < T < 100 °C) containing polyelectrolytes with chemical charge separation along the backbone being about 0.25 nm and monovalent counterions. The Coulomb interaction is calculated with the standard Ewald summation.36
In simulating the Langevin dynamics, the mass of a monomer bead is set as the unit mass and that of the counterions is half-unit mass. The friction coefficient ζ is chosen as , where is the time unit in the simulations. In defining the time unit, we have taken m = 1 and σ = l0. The Langevin equation, Eq. (1), is integrated using the velocity-Verlet-finite-differencing scheme. The time step δt is adjusted between 0.007 and 0.0003. When the chains are sufficiently far away from each other we have used δt = 0.007 and when the chains are too close we have used δt = 0.0003. We have chosen such a small time step in order to facilitate the exploration of conformational changes during the rapid complexation process, as was done in our previous studies.17,27,28 We have used three typical sizes of the simulation box: for complexation, for substitution in salt-free conditions, and for substitution in salty conditions. The values of N, Γ, and the simulation box size L are variables in our simulations. Most of the results presented here are for N = 30 or 60 for complexing chains and N of the invading chain in the range of 36 to 120, and for Γ = 2.8. When salt is present, we have studied only the situation of 0.15M monovalent salt. In addition, we have also calculated the potential of mean force as will be discussed in Sec. III.
III. RESULTS AND DISCUSSION
The two steps of complexation and substitution sketched in Fig. 1 are simulated by the following protocol. One polycation chain A of NA beads is first equilibrated with its counterions in a simulation box at a prescribed monomer density and Coulomb strength parameter Γ. In another simulation box, one polyanion chain B of NB beads is equilibrated along with its counterions. The segment and counterion distributions and radial variation of electric potential for individual chains and their radii of gyration are monitored after equilibration. These two equilibrated chains along with their respective counterions are then placed in a new simulation box with a new size so that the total monomer density is the same before and after mixing. When salt is present, the salt ions are introduced randomly into the simulation box. The initial placement of the chains is such that the distance R between their centers of mass (CM) is sufficiently large (about 20 times the radius of gyration of individual chains in isolation). The complexation process is followed by monitoring the interchain potential and the potential of mean force as functions of CM separation distance R. Also, the related structural quantities such as the radius of gyration of the component chains of the complex are monitored.
Once the complexation between A and B is completed, we have translated this complex along with its counterions and a new equilibrated polycation chain C of NC beads along with its counterions into a new simulation box, such that the distance between the CM of the complex and any bead of chain C is longer than 20 bond lengths. As time progresses, the chain C encounters the complex A-B and competes against A for complexing with B. Under favorable conditions to be described below, the substitution of A by C is complete and the required time for substitution depends on the length of C relative to that of A, lengths of A and B, and concentration of added salt. Vivid details of the substitution process are described below. Since some aspects of the first step of complexation was already presented by us27 using the same model and simulation method of the present work, our discussion of the first step is very brief by highlighting only the new features.
A. Isolated polyelectrolyte chain
For a single equilibrated chain of A or B, we have computed its radius of gyration Rg, monomer density distribution ρ(r), counterion density distribution ρc(r), and electric potential ψ(r) at the radial distance r from the CM of the chain. The radius of gyration is defined by
| (8) |
where ri is the position vector of the ith bead and angular brackets denote the average over chain configurations. The distributions of the monomer density and counterion density are defined by
| (9) |
and
| (10) |
where n(r) and nc(r) are the numbers of monomers and counterions, respectively, located in the spherical shell with inner and outer radii of r and r + Δr. We have taken Δr as 1l0 for small r(<20l0) and 4l0 for large r(>20l0). The electric potential at r is given by
| (11) |
where the sum is over all monomers and counterions. This is calculated by the following procedure. First, a spherical shell at radius r with width Δr is constructed. Next, the electric potential is calculated using Eq. (11) by randomly selecting 100 points in this shell and averaging over them. Furthermore, this value for the electric potential is averaged over 45 000 time steps and over 9 independent simulations.
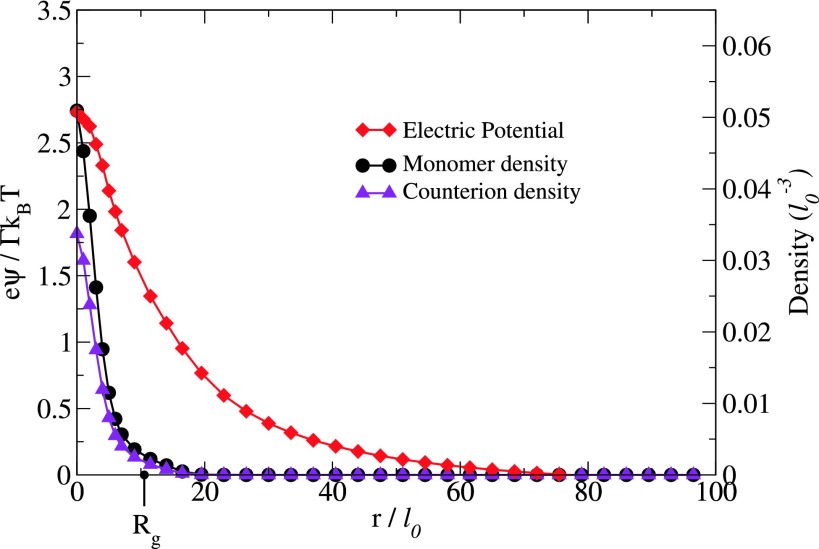
As an illustrative example, the results of ψ(r), ρ(r), ρc(r), and Rg are given in Fig. 2 for N = 60, Γ = 2.8, and L = 280l0.
FIG. 2.
Radial dependence of the electric potential ψ(r), monomer density ρ(r), and counterion density ρc(r) from the center of a single chain for N = 60, Γ = 2.8 and L = 280l0. The radius of gyration Rg is 10l0. The electric potential extends up to eight times Rg.
The radius of gyration Rg is 10l0, consistent with our earlier results.19,22 It is clear from Fig. 2 that most of the polymer beads and counterions are within the distance of the radius of gyration from the CM. Furthermore, all polymer beads are within a radius of 2Rg from the CM. In contrast to the distributions of monomers and counterions, the electric potential is naturally long ranged and extends up to eight times Rg for the conditions of the present simulation. There are at present no analytical formulas to describe ψ(r) given in Fig. 2. Such long ranged potentials ensure the mutual encounter between the oppositely charged chains. Furthermore, ψ(r) of Fig. 2 gets significantly modified by the approach of an oppositely charged chain as discussed next.
B. Complexation between A and B
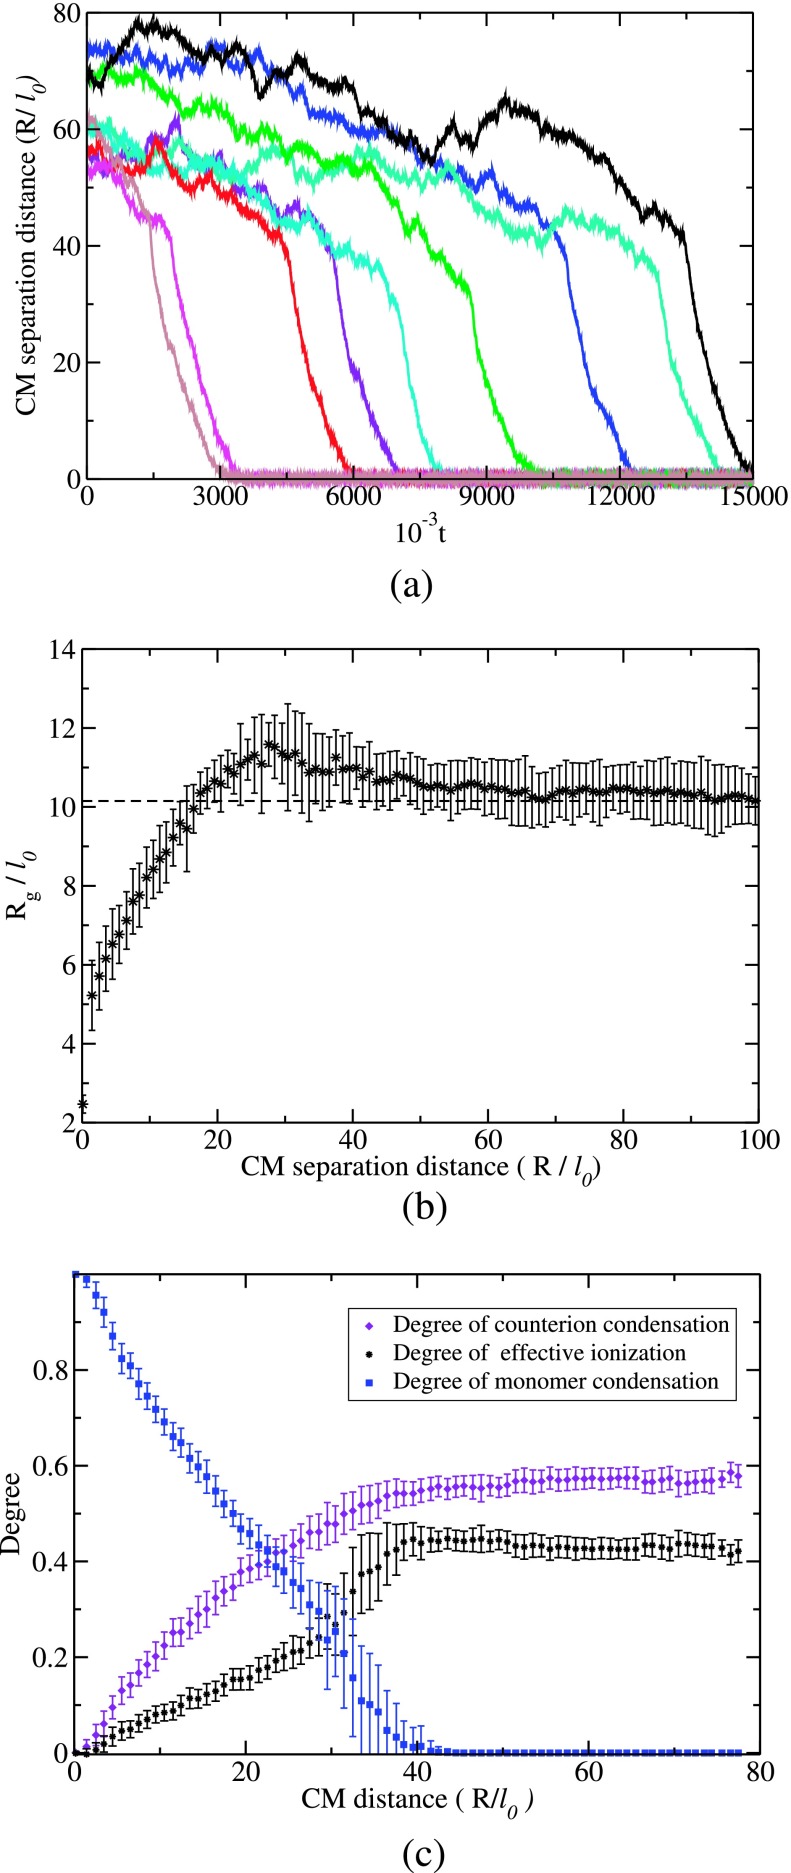
After the initial placement of one polycation (A) chain and one polyanion (B) chain with their CM positions separated by 10 times Rg, the chains undergo Langevin dynamics over time. To begin with, the chains undergo diffusion until each chain is subjected to the electric force from the other chain. Now, the relative motion of the chains is due to a combination of diffusion and drift. This process continues until the CM separation distance is about 4Rg, at which the chains rapidly collapse into each other. Typical trajectories are presented in Fig. 3(a) where the CM separation distance is plotted against time for NA = 60, NB = 60, and Γ = 2.8. The data on positions and velocities of all beads and counterions are stored at every 1000 time steps from which physical quantities such as Rg, degree of ionization, and electric potential of a chain in the complex are computed. The radius of gyration of the A chain is given in Fig. 3(b) as a function of the CM separation distance R. The behavior of the B chain is the same as that of A in Fig. 3(b), due to the same length for A and B and the beads carrying point-like charges. Once the chains are in contact, each chain shrinks in its size due to the attractive potential created by the beads of the other chain. Both chains collapse together equivalently and self-consistently. It must be remarked that there is a slight temporary increase in Rg before the drastic chain collapse takes place. We have also monitored the extent of counterion adsorbed on the chain backbone during the course of complexation. As described previously,19,22 we count the number nc of counterions inside a worm-like tube around the chain backbone of radius rc. For distances less than rc, the Coulomb energy of attraction between two monovalent charges is higher than the kinetic energy of one charge. The effective degree of counterion adsorption is
| (12) |
where 〈nc〉 is the number of counterions adsorbed on the chain averaged over chain configurations at various CM separation distances. Analogously, we have monitored the number np of beads of the complementary chain inside the tube of radius rc around each chain backbone. The average degree of binding between the polymers is
| (13) |
Therefore, the average degree of ionization of a chain follows as
| (14) |
As the chains undergo complexation, counterions are displaced by polymer segments. The dependencies of αc, αp, and f on the CM separation distance are given in Fig. 3(c). Before the complexation begins, f is about 0.4 for N = 60, Γ = 2.8, and L = 280l0. As the complexation proceeds, the counterions are progressively released as more and more beads of oppositely charged chains bind together. All of these results are consistent with previous simulations.27 In fact, the increase in translational entropy accompanying the release of counterions is the dominant driving force for aqueous assembly of oppositely charged chains even more than the electrostatic attraction.27
FIG. 3.
Complexation process. (a) Typical trajectories of approach of A and B to form A-B complex, where the CM separation distance between A and B chains is plotted against time t in units of τ0. (b) Shrinkage of Rg of a chain during its complexation with its counterpart. (c) Decrease in the effective degree of ionization of A as complexation proceeds (as CM distance between A and B decreases). In this process, the adsorbed counterions are released due to pairing among the beads of A and B.
Based on the details of positions of beads of both chains and all counterions in the system, the electric potential ψA(R) at the CM of the A chain is calculated when the CM separation distance between A and B chains is R, according to
| (15) |
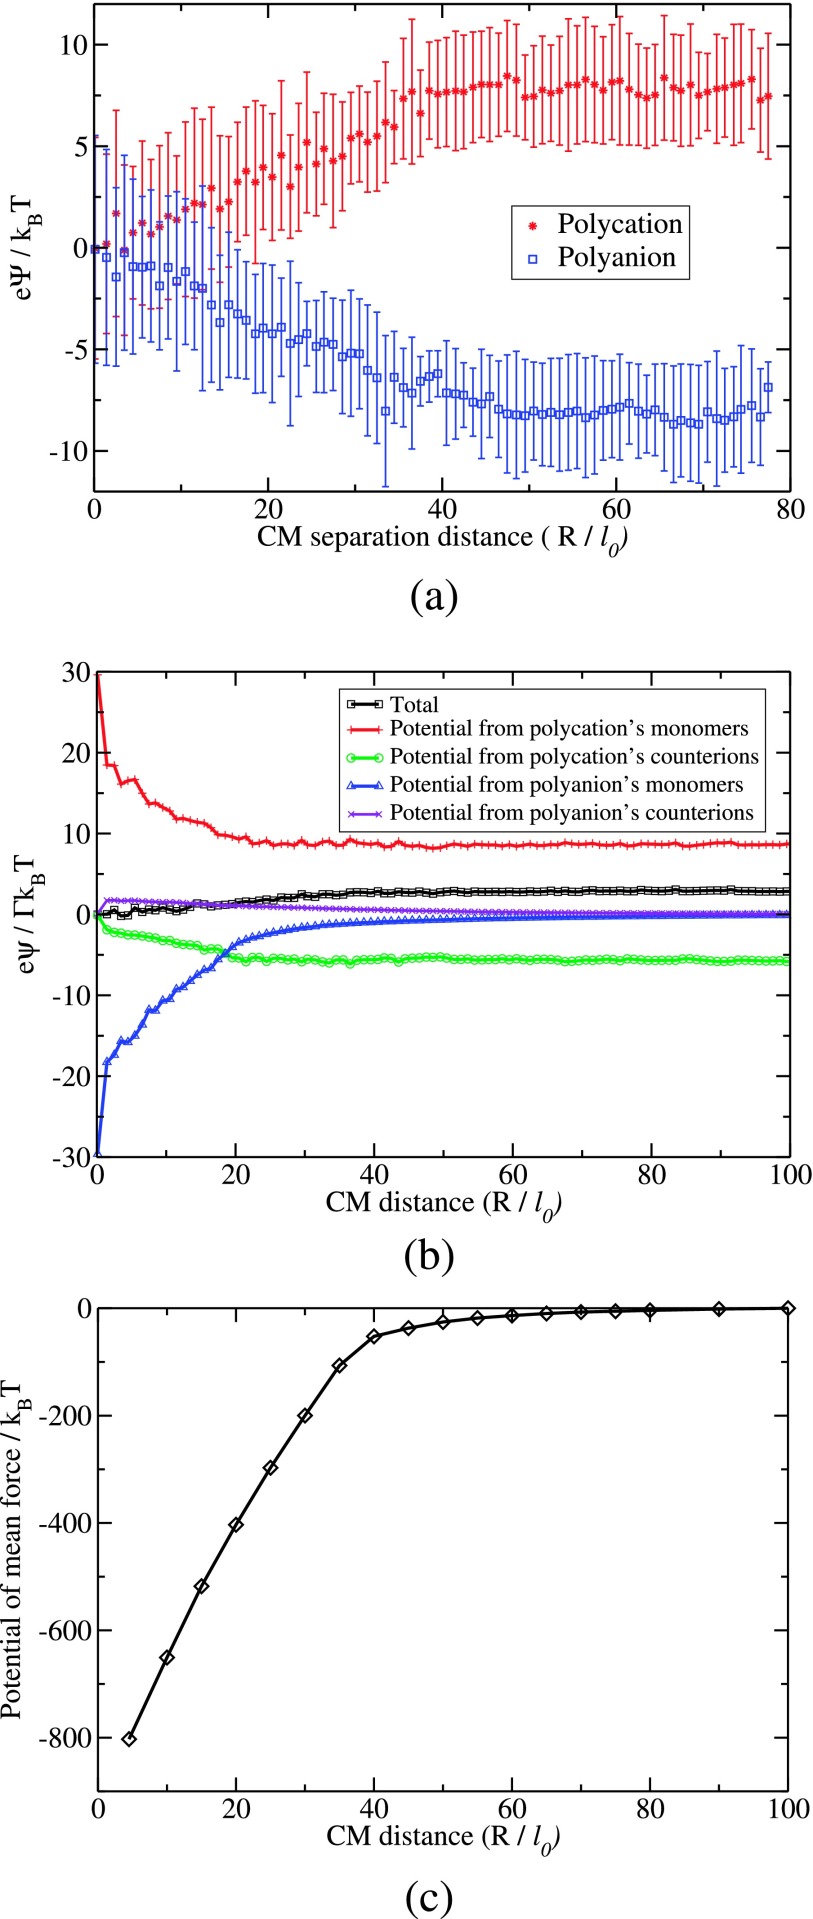
where rCM,A is the CM position vector of chain A, ri is the position vector of the ith charged unit. There are 4N charged units (N beads of A with zi = + 1, N counterions of A with zi = − 1, N beads of B with zi = − 1, and N counterions of B with zi = + 1). Analogously, the electric potential ψB(R) at the CM position of the B chain is calculated. The dependencies of the electric potentials acting on the CM positions of the chains due to all charged units in the system are given in Fig. 4(a) as a function of the CM separation distance R between the two chains. The data in this figure are for N = 60, Γ = 2.8, and L = 280l0. Within the error bars given in Fig. 4(a), ψA(R), and ψB(R) are equivalent, except for the sign.
FIG. 4.
(a) Plot of electric potential at the CM of A (top) and CM of B (bottom) as a function of the CM separation distance between A and B. (b) Contributions from A’s monomers and counterions and B’s monomers and counterions to the net result of the electric potential at the CM of A as given in (a). (c) Potential of mean force as a function of CM separation distance between the complexing chains. (NA = 60, NB = 60, Γ = 2.8, and L = 280l0; no salt.)
The electric potential on a chain is essentially constant until it approaches the other chain at the CM separation distance of about 4Rg. For interchain distances shorter than 4Rg, the potential decreases essentially linearly for the present simulation conditions. Therefore, there is a constant force of attraction between the two chains mediated by their counterions. Specifically, the electric potential ψA on A arises from all four contributing factors: monomers of A, counterions of A, monomers of B, and counterions of B. These contributions are presented in Fig. 4(b) for N = 60, Γ = 2.8, and L = 280l0. At larger values of R(>40l0), ψA is essentially due to the monomers and counterions of A. At shorter interchain distances, intrachain repulsion becomes stronger due to the shrinkage of the chain, but this is mitigated by the interchain attraction. For very short interchain distances, the counterions play a minor role as they have already been released out of the complex. Thus, the constant force of attraction between the chains arises due to a delicate balance between various polyion-polyion and polyion-counterion interactions.
As an additional check on the constant force of attraction between the two chains, we have calculated the potential of mean force between the chains.20 First, at a given CM separation distance r, we have summed up forces on all beads of each chain arising from both electrostatic and Lennard-Jones interactions. Then, we have projected the net force on a chain on the distance vector connecting the centers of mass of the chains. The net force F(r) is the vectorial sum of the projected forces from the two chains. This net force is then used in calculating the potential of mean force according to
| (16) |
where we have chosen the reference point of the integral as the lower of 10Rg and half of the linear size of the simulation box, instead of infinity. The result of this calculation is given in Fig. 4(c) for N = 60, Γ = 2.8, and L = 280l0. The linear dependence of the potential of mean force on the separation distance is apparent, consistent with the result of Fig. 4(b) where only electrostatic potential is considered. It must be however remarked that the constant inter-chain force is not universal. Our simulations show that the constant force regime weakens for the electrostatic strength parameter Γ larger than 3 and if additional salt is present in the system.
C. Substitution of a component in A-B complex
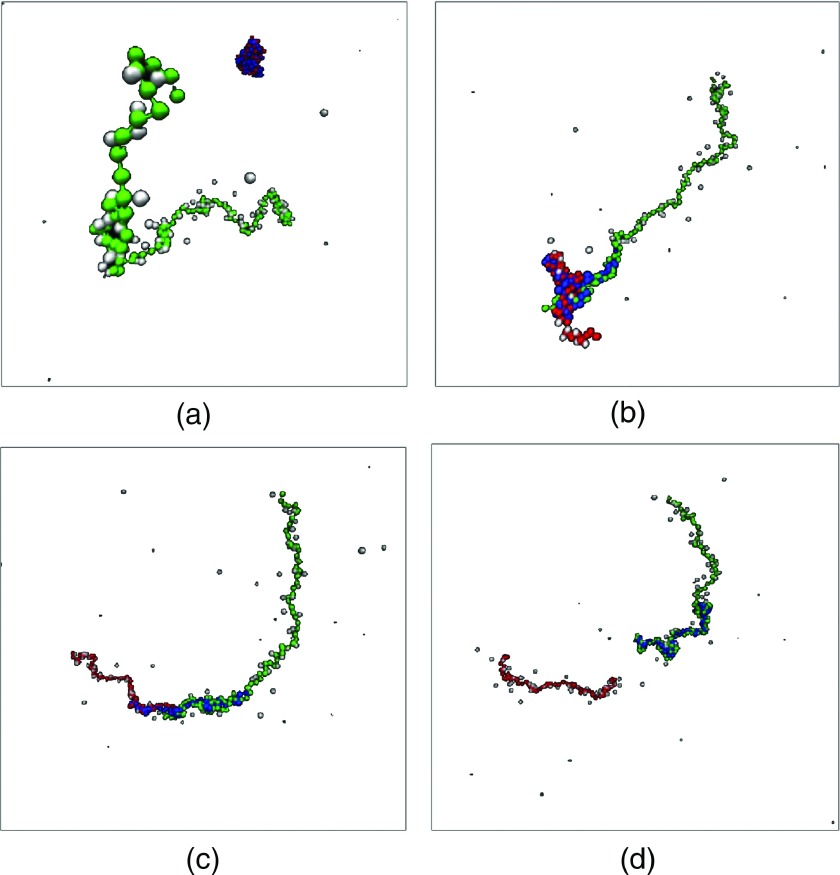
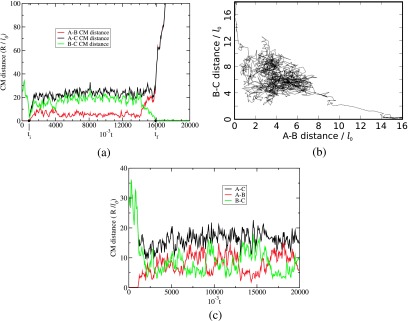
We have monitored the interaction between a polycation chain C of length NCl0 and an already formed A-B complex from a polycation chain of length NAl0 and a polyanion chain B of length NBl0. As already mentioned, the chain C first undergoes diffusion and drift towards the complex and once any one of the beads of C is in the vicinity of A-B, the substitution reaction begins. If NC is sufficiently larger than NA, the substitution reaction (the second step in Fig. 1) proceeds to completion. Typical snapshots during the substitution reaction, after a bead of C has contacted A-B, are given in Fig. 5 for NA = 60 = NB and NC = 120 for t = 1, 110, 2200, and 3200 at Γ = 2.8 and L = 320l0. No added salt is present. We have monitored the duration τ of the substitution as the time elapsed between the state of a C bead attaching to the complex and the state when all A beads are detached from the complex. During the substitution process, the beads of A, B, and C exhibit rich dynamics. We summarize the various details behind the substitution process by plotting the time-evolution of the CM separation distances of the three chain pairs: A-B, B-C, and C-A. This plot is given in Fig. 6(a) for NA = 30, NB = 30, NC = 42, L = 320l0, and Γ = 2.8. The initiation and end of the substitution reaction are marked as ti and tf, respectively, and τ = tf − ti. The average distance between the B and C chains is larger than that between A and B chains for most of the time. Of course, at the end of the reaction, the A-B distance grows towards infinity. Also, due to electrostatic repulsion between A and C, the A-C distance is always larger than the other two distances during the substitution. As another representation of the exchange process, we have presented a typical trajectory of the substitution reaction in Fig. 6(b) as a plot of B-C distance versus A-B distance for NA = 30, NB = 30, NC = 120, Γ = 2.8, and L = 320l0. In this reaction coordinate scheme, the substitution begins at the top left and ends at bottom right. In the basin, competitive exchange between C monomers and A monomers by the B monomers continues to occur until the reaction proceeds to completion. If the conditions are unsuited for substitution, the three-chain complex continues to rattle around in the basin without the reaction ever reaching completion. This is illustrated in Fig. 6(c), where NA = 60, NB = 60, and NC = 60 for Γ = 2.8 and L = 320l0. Since the chain lengths of the competitors are the same (NA = 60, NC = 60), there is continuous swapping of beads of A and C by the beads of B. When the length of the invading chain C is the same as that of the resident chain A, the mutual exchange of A and C beads is endless and the substitution of A in A-B by C never occurs.
FIG. 5.
Snapshots of the substitution reaction, where a C chain (green) substitutes an A chain (red) in the A-B complex (B is blue) at t = 1, 110, 2200, and 3200 in units of τ0. NA = 60, NB = 60, NC = 120, Γ = 2.8, L = 320l0, and no salt.
FIG. 6.
(a) Illustration of a typical successful substitution trajectory. The three CM distances among the three chains are plotted against time. A-B is the initial complex and B-C is the final complex. The substitution begins at ti and ends at tf. The substitution time τ is tf − ti. NA = 30, NB = 30, NC = 120, Γ = 2.8, L = 320l0, and no salt. (b) Reaction coordinate representation of substitution reaction for NA = 30, NB = 30, NC = 42, L = 320l0, Γ = 2.8, and no salt. (c) Illustration of a typical unsuccessful substitution trajectory. The three CM distances among the three chains are plotted against time. A-B is the initial complex and C is the invading chain. NA = 60, NB = 60, NC = 60, L = 320l0, Γ = 2.8, and no salt.
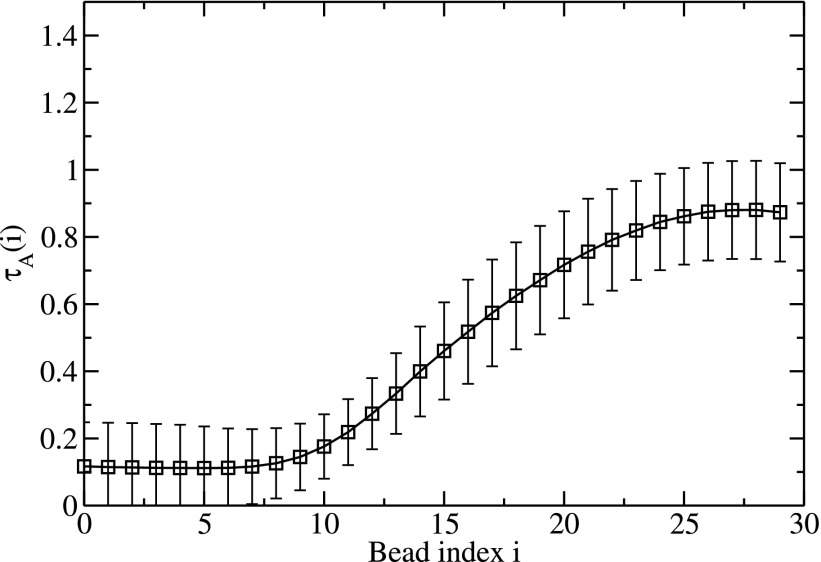
We have analyzed the data to obtain the probability of a particular monomer of C to contact the A-B complex and its role on τ. Also, we have analyzed which monomers among the B chain are prone for eventual complexation with the invading chain. It turns out that all monomers of chain C contact the complex randomly with essentially equal probability. Moreover, the substitution time is essentially independent of which C bead makes the initial contact with the complex. However, the transfer of B monomers from A to C is cooperative. We find that the beads at the either end of the B chain predominantly initiate the transfer from A to C. By labeling the first B bead located on the starting end as bead 0 (and the last bead at the opposite end as bead 29, for NB = 30), we have counted the fraction of time τA(i) spent by the ith bead of B on chain A during the whole duration τ of substitution. This is plotted in Fig. 7 for NA = 30, NB = 30, NC = 42, Γ = 2.8, and L = 320l0, with averages constructed over 60 independent simulations. As seen from this figure, the time for exchange increases progressively as the B chain rips out of A from one of B’s ends and merges with C in essentially a sequential manner.
FIG. 7.
Cooperativity of B monomers during substitution of A by C. The fraction of time spent by the ith bead of B chain on the A chain during substitution versus the bead index i.
D. Substitution time
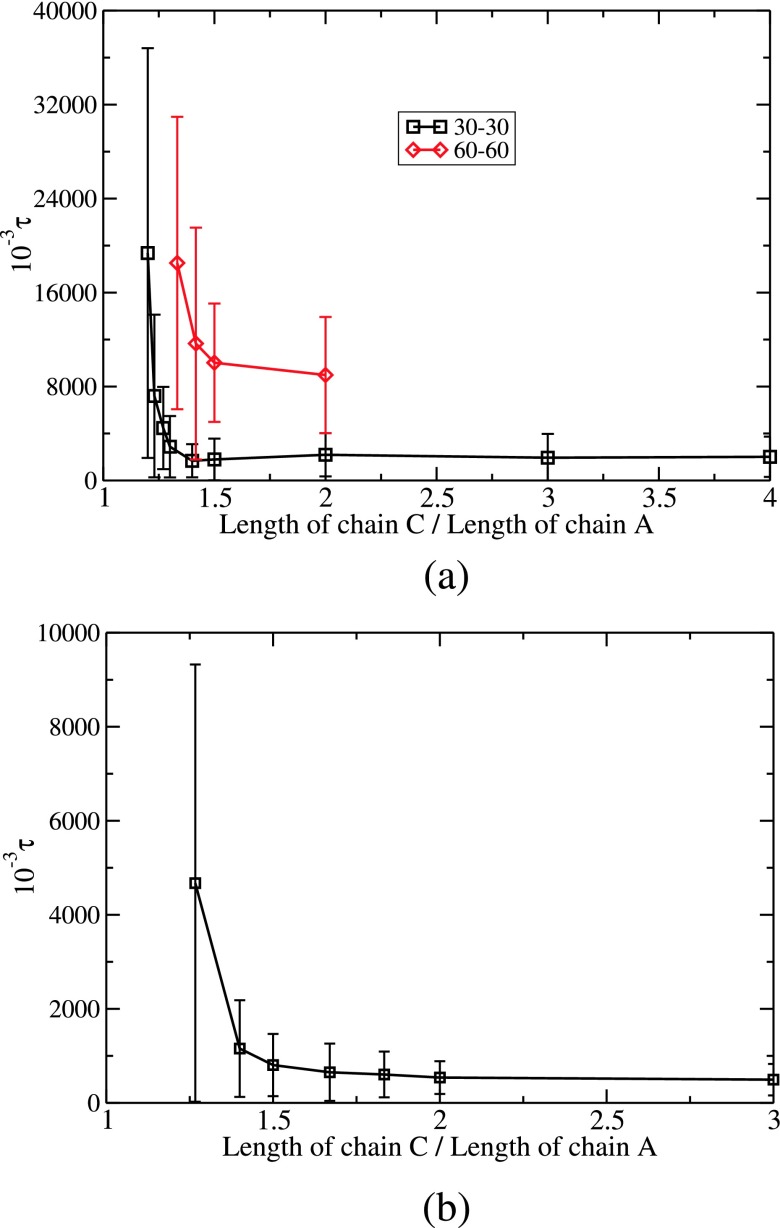
The substitution time required by a chain C of length NCl0 to displace a chain of A of length NAl0 from an A-B complex (NA = NB) depends on NA, NC, and the presence of simple electrolyte salts. The substitution times for different combinations are shown in Fig. 8, where τ is plotted against the ratio (NC/NA) of the length of the invading chain to that of the chain being substituted.
FIG. 8.
(a) Plot of substitution time τ versus the ratio of the length of the invading chain to that of the chain being displaced for 30:30 A-B complex (bottom) and 60:60 A-B complex (top); no salt (Γ = 2.8, L = 320l0). (b) Dependence of τ on NC/NA for NA = 30 = NB with 0.15M monovalent salt (Γ = 2.8, L = 50l0).
First, we discuss the invasion of one A-B complex, made from one A chain of NA = 30 and one B chain of NB = 30, by one C chain with NC in the range between 36 and 120. For NC ≃ NA, the substitution time is expected to diverge to infinity as seen in Fig. 6(c). When NA = 30, we have found that C chains shorter than NC = 36 take very long time for substitution in our simulations. For NC > 36, we show in Fig. 8(a) that the substitution time decreases dramatically as the length of C chain increases from 36 to 42. Beyond this value of NC(=42), τ is remarkably insensitive to the length of the C chain. Thus there is a threshold value of NC for effectively executing the substitution reaction and it is unnecessary to make the invading chain longer beyond this threshold value. The error bars are based on 60 independent simulation runs. As the value of NC is closer to NA, the error bar gets bigger as expected.
Next, we consider the invasion of one A-B complex made with twice longer chains (NA = 60, NB = 60) than in the above discussed complex. The lengths of the invading C chain are NC = 80, 85, 90, and 120. The dependence of τ on the ratio NC/NA is included in Fig. 8(a). Exactly, the same trend as observed for the 30:30 A-B complex is seen for the 60:60 A-B complex as well, with the threshold value of NC/NA about 1.5. In other words, only about 50% longer chain of C is adequate to fully substitute an A chain. As is evident from Fig. 8(a), the time needed to make the substitution in a 60:60 A-B complex is longer than in a 30:30 A-B complex for any given NC/NA ratio.
The presence of added salt significantly reduces the substitution time, in agreement with experimental observations.13,14 Our simulation results for the monovalent salt concentration of 0.15M are shown in Fig. 8(b), where τ is plotted against NC/NA for NA = 30, NB = 30, Γ = 2.8, and L = 50l0. Here NC is in the range of 39 to 90. By comparing the graphs in Figs. 8(a) and 8(b), we observe that τ is substantially shorter in the presence of salt. Again, even in the presence of salt, there exists a threshold value of NC (about 1.5 times NA) beyond which the value of NC does not affect τ much.
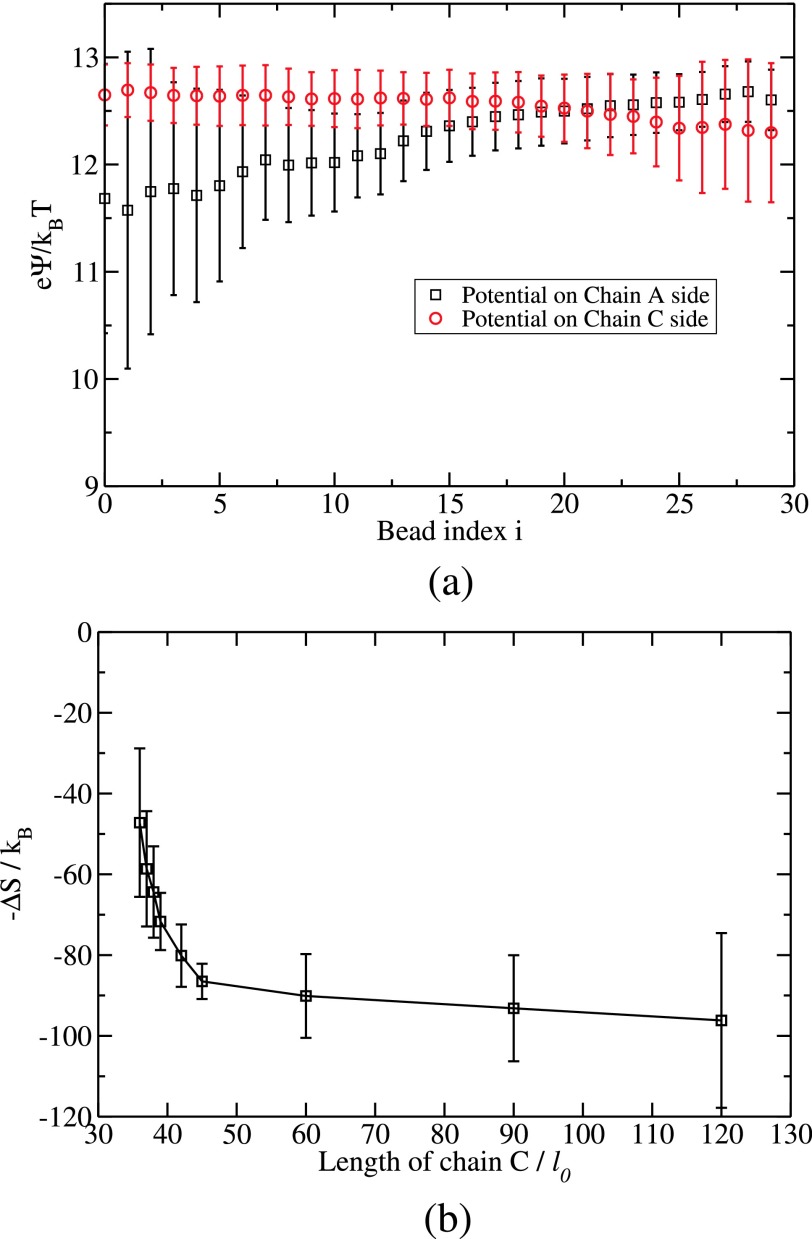
In order to get an insight into why only a threshold value of C chain length is sufficient to successfully displace the A chain in the A-B complex, we have calculated the local change in electric potential during the substitution. Let ψiA be the electric potential of the ith bead of B when it is binding with a bead of the A chain. When the ith bead of B jumps out of A and binds with a bead of C, let the electric potential be ψiC. The potential difference arising from electrostatics alone for this jump of the ith bead of B is ψi = ψiC − ψiA. Since the chain C is longer than the chain A, one would anticipate that the beads of B would fall into the more attractive well of C away from the attractive well of A in a monotonic fashion. However, this naive expectation is not borne out in our simulations. Using the same nomenclature of index labeling in Fig. 7, the local electric potentials ψiA and ψiC are plotted in Fig. 9(a) as a function of the bead label i for NA = 30, NB = 30, NC = 42, L = 320l0, and Γ = 2.8. During the early stages of substitution, there is a favorable gain in electrostatic potential energy (the gain is positive in Fig. 9(a), because the B chain is negatively charged) as the B beads jump from the A chain to the C chain. During the early stages of substitution, the B beads jump into more favorable local potential from the C chain in comparison with that from the A chain (ψiC > ψiA and B is negatively charged). Therefore, the swapping of B with C away from A is a favorable process based on electrostatics alone during the early stage. However, at a later stage (i ≥ 20 for NB = 30), the exchange becomes unfavorable as seen in Fig. 9(a). Now, ψiA is greater than ψiC, making the last stage of the substitution unfavorable based on electrostatic interaction alone. Thus, Fig. 9(a) shows that the electrostatic potential difference between chain C and chain A initiates the substitution but not enough to complete it.
FIG. 9.
(a) Plot of local potential on the ith bead of B from chain A, ψA(i) (black square), and that from chain C, ψC(i) (red circle), versus bead index i. Electrostatics initiates the substitution, but does not finish it. (b) Free energy contribution from the translational entropy of released counterions versus the length of the invading chain.
Towards identifying the additional driving force necessary for completing the substitution process, we have monitored the counterions and the translational entropy of the released counterions during the substitution. We have counted the number of counterions in the simulation box (outside the worm-like tubes around the backbones of the chains) before the substitution begins and after the substitution ends. Let these numbers be Δn1 and Δn2, respectively. Assuming ideal behavior, the total entropy gain due to the released counterions accompanying the substitution reaction is
| (17) |
where V is the volume of the simulation box and Vc is the volume of a counterion taken as . Taking the values of Δn1 and Δn2 from the simulations, for various values of NC, the free energy contribution −ΔS/kB arising from counterion release is plotted in Fig. 9(b) against the length of chain C. Here, the complex is made from NA = 30 and NB = 30 and NC is in the range from 36 to 120. Also, Γ = 2.8 and L = 320l0. As seen in Fig. 9(b), the entropic contribution from the released counterions is very significant (about 80kBT for NC = 42) in comparison with the net gain in energy due to electrostatics (about ≤10kBT for NC = 42, as seen in Fig. 9(a)). Furthermore, the entropic gain increases precipitously as the chain length of C increases from 36 to 42 and beyond NC ≃ 42, it becomes only weakly dependent on NC. This is due to the fact that the counterions adsorbed on the part of the C chain that is superfluous to the stoichiometric length needed to displace the A chain are not released into the background. The threshold value of NC seen in Fig. 9(b) is consistent with the results of Fig. 8(a). As demonstrated in our previous work27 changes in chain conformational entropy are insignificant in comparison with electrostatic and counterion entropy contributions. Combination of the results given in Figs. 9(a) and 9(b) leads to the conclusion that the substitution reaction and the existence of a sufficient length of the invading chain relative to the length of the chain being displaced are dominantly controlled by the release of counterions.
IV. SUMMARY
We have performed Langevin dynamics simulations of the substitution process where a polyelectrolyte chain A, that is already complexed with its complementary polyelectrolyte chain B, is competitively displaced by an invading chain C which is also complementary to B. Towards a fundamental understanding of this ubiquitous phenomenon relevant to many experimental situations involving polyelectrolyte complexes and gene therapy, we have monitored various forces involved in this process by explicitly accounting for the counterions, chain conformations, and local electric potentials. Specifically, we have addressed (1) the electric potential around an isolated flexible polyelectrolyte chain, (2) its modification by the approach of an oppositely charged flexible polyelectrolyte and the accompanying changes in chain conformations and sizes, and (3) invasion by the third chain and the nature of competition between two similarly charged chains for their single complementary chain. Most of our simulations are performed without any added salt.
The range of the electric potential around a flexible polyelectrolyte chain extends up to distances of an order of magnitude larger than its radius of gyration. This potential is significantly modified when a chain of opposite charge approaches within a distance of about four times the radius of gyration. Both the Langevin dynamics simulations and potential of mean force calculations show that the attraction between two interpenetrating oppositely charged polyelectrolytes is under a constant force for the simulation parameters in the present study. This remarkable result is found to be arising from a delicate combination of interaction between A-A monomers, A-B monomers, B-B monomers, and interactions among all counterions in the system and the polymer segments. Concomitant with the presence of constant force of attraction, counterions of both complexing chains are released and each chain collapses into the other equivalently and self-consistently.
Upon the invasion by C, and if C is longer than A, the B segments begin to transfer from A to C in a cooperative and sequential manner essentially from one end to the other. On the other hand, the substitution efficiency is relatively insensitive to which segment of the invading chain C makes the first contact with the A-B complex. We find that if the lengths of A and C are comparable, the substitution does not proceed to completion and the system is frustrated into a three-chain complex with continuous swapping between segments of A-B pairs and B-C pairs. On the other hand if the invading chain is longer than the chain being displaced, the substitution proceeds towards completion and we have monitored the substitution time as a function of the ratio NC/NA of the length of the invading chain to that of the resident chain. As this ratio increases, the substitution time decreases precipitously until a threshold value of about 1.5 for NC/NA. Beyond this threshold value, the substitution time becomes remarkably insensitive to the length of the invading chain. We also find that the presence of salt facilitates the substitution reaction and significantly reduces the substitution time. By considering electrical potential differences and translational entropy of counterions during the substitution process, we conclude that the electrostatic interaction is sufficient to initiate the substitution but not enough to complete the process and that the entropic gain from the counterion release is necessary for the completion of the substitution reaction. We also find that the occurrence of the threshold length of the invading chain, beyond which the substitution time is insensitive to NC, originates from the counterion release. Once the monomers of A complexed with B are replaced by those from C, the rest of the monomers of C do not release their adsorbed counterions thus not contributing any more to the driving force for the complexation process.
It would be desirable to extend the present simulations to tens of chains, instead of just the three chain system presented here, in order to make quantitative connections to experimental observations which typically involve many more chains in the complex formation and substitution.
Acknowledgments
Acknowledgement is made to the National Institutes of Health (Grant No. R01HG002776-11), National Science Foundation (Grant No. DMR 1504265), and AFOSR (Grant No. FA9550-14-1-0164).
REFERENCES
- 1.Kabanov V. A. and Papisov I. M., Polym. Sci. U.S.S.R. 21, 261 (1979). 10.1016/0032-3950(79)90245-4 [DOI] [Google Scholar]
- 2.Dubin P., Bock J., Davis R., Schulz D. N., and Thies C., Macromolecular Complexes in Chemistry and Biology (Springer-Verlag, 1994). [Google Scholar]
- 3.Thünemann A. F., Müller M., Dautzenberg H., Joanny J. F., and Löwen H., Adv. Polym. Sci. 166, 113 (2004). 10.1007/b11350 [DOI] [Google Scholar]
- 4.Sanada K. J., Tsuchida E., and Osada Y., J. Polym. Sci., Part A-1: Polym. Chem. 10, 3997 (1972). 10.1002/pol.1972.170101124 [DOI] [Google Scholar]
- 5.Papisov I. M., Baranovskii V. Yu., Sergieva Ye. I., Antipina A. D., and Kabanov V. A., Vysokomol. Soedin. A16, 1133 (1974). [Google Scholar]
- 6.Izumrudov V. A., Bronich T. K., Novikova M. B., Zezin A. B., and Kabanov V. A., Polym. Sci. U.S.S.R. 24, 367 (1982). 10.1016/0032-3950(82)90184-8 [DOI] [Google Scholar]
- 7.Kabanov V. A., Zezin A. B., Izumrudov V. A., Bronich T. K., and Bakeev K. N., Makromol. Chem., Suppl. 13, 137 (1985). 10.1002/macp.1985.020131985111 [DOI] [Google Scholar]
- 8.Kabanov V. A., Makromol. Chem., Macromol. Symp. 1, 101 (1986). 10.1002/masy.19860010110 [DOI] [Google Scholar]
- 9.Bakeev K. N., Izumrudov V. A., Kuchanov S. I., Zezin A. B., and Kabanov V. A., Macromolecules 25, 4249 (1992). 10.1021/ma00043a003 [DOI] [Google Scholar]
- 10.Izumrudov V. A., Kargov S. I., Zhiryakova M. V., Zezin A. B., and Kabanov V. A., Biopolymers 35, 523 (1995). 10.1002/bip.360350511 [DOI] [Google Scholar]
- 11.Störkle D., Duschner S., Heimann N., Maskos M., and Schmidt M., Macromolecules 40, 7998 (2007). 10.1021/ma0711689 [DOI] [Google Scholar]
- 12.Li Y., Bronich T. K., Chelushkin P. S., and Kabanov V. A., Macromolecules 41, 5863 (2008). 10.1021/ma702671w [DOI] [Google Scholar]
- 13.Karibyants N. and Dautzenberg H., Langmuir 14, 4427 (1998). 10.1021/la980301a [DOI] [Google Scholar]
- 14.Zintchenko A., Rother G., and Dautzenberg H., Langmuir 19, 2507 (2003). 10.1021/la0265427 [DOI] [Google Scholar]
- 15.Chollakup R., Smitthipong W., Eisenbach C. D., and Tirrell M., Macromolecules 43, 2518 (2010). 10.1021/ma902144k [DOI] [Google Scholar]
- 16.Srivastava D. and Muthukumar M., Macromolecules 27, 1461 (1994). 10.1021/ma00084a028 [DOI] [Google Scholar]
- 17.Liu S. and Muthukumar M., J. Chem. Phys. 109, 1522 (1998). 10.1063/1.476703 [DOI] [Google Scholar]
- 18.Jusufi A., Likos C. N., and Löwen H., J. Chem. Phys. 116, 11011 (2002). 10.1063/1.1480007 [DOI] [Google Scholar]
- 19.Liu S. and Muthukumar M., J. Chem. Phys. 116, 9975 (2002). 10.1063/1.1476930 [DOI] [Google Scholar]
- 20.Likos C. N., Jusufi A., and Löwen H., Phys. Rev. Lett. 88, 018301 (2002). 10.1103/physrevlett.88.018301 [DOI] [PubMed] [Google Scholar]
- 21.Hayashi Y., Ullner M., and Linse P., J. Chem. Phys. 116, 6836 (2002). 10.1063/1.1460859 [DOI] [Google Scholar]
- 22.Liu S., Ghosh K., and Muthukumar M., J. Chem. Phys. 119, 1813 (2003). 10.1063/1.1580109 [DOI] [Google Scholar]
- 23.Hayashi Y., Ullner M., and Linse P., J. Phys. Chem. B 107, 8198 (2003). 10.1021/jp022491a [DOI] [Google Scholar]
- 24.Hayashi Y., Ullner M., and Linse P., J. Phys. Chem. B 108, 15266 (2004). 10.1021/jp048267y [DOI] [Google Scholar]
- 25.Konieczyny M., Likos C. N., and Löwen H., J. Chem. Phys. 121, 4913 (2004). 10.1063/1.1781111 [DOI] [PubMed] [Google Scholar]
- 26.Panchagnula V., Jeon J., and Dobrynin A. V., Phys. Rev. Lett. 93, 037801 (2004). 10.1103/PhysRevLett.93.037801 [DOI] [PubMed] [Google Scholar]
- 27.Ou Z. and Muthukumar M., J. Chem. Phys. 123, 074905 (2005). 10.1063/1.1940054 [DOI] [PubMed] [Google Scholar]
- 28.Ou Z. and Muthukumar M., J. Chem. Phys. 124, 154902 (2006). 10.1063/1.2178803 [DOI] [PubMed] [Google Scholar]
- 29.Jeon J., Panchagnula V., Pan J., and Dobrynin A. V., Langmuir 22, 4629 (2006). 10.1021/la053444n [DOI] [PubMed] [Google Scholar]
- 30.Sandberg D. J. and Dobrynin A. V., Langmuir 23, 12716 (2007). 10.1021/la702203c [DOI] [PubMed] [Google Scholar]
- 31.von Goeler F. and Muthukumar M., J. Chem. Phys. 100, 7796 (1994). 10.1063/1.466822 [DOI] [Google Scholar]
- 32.Chertsvy A. G., Kolomeisky A. B., and Kornyshev A. A., J. Phys. Chem. B 112, 4741 (2008). 10.1021/jp076432e [DOI] [PubMed] [Google Scholar]
- 33.Cherstvy A. G., J. Phys. Chem. B 113, 4242 (2009). 10.1021/jp810009s [DOI] [PubMed] [Google Scholar]
- 34.Winkler R. G. and Chertsvy G., Adv. Polym. Sci. 255, 1 (2014). 10.1007/12_2012_183 [DOI] [Google Scholar]
- 35.Michaeli I., Overbook J. Th. G., and Voorn M. J., J. Polym. Sci. 23, 443 (1957). 10.1002/pol.1957.1202310337 [DOI] [Google Scholar]
- 36.Ewald P., Ann. Phys. 64, 253 (1921). 10.1002/andp.19213690304 [DOI] [Google Scholar]


