

Abstract
Objective:
Duchenne muscular dystrophy (DMD) is a lethal disease. The outcome measures used in numerous therapeutic trials include skeletal muscle biopsy. We studied the natural history of DMD from the standpoint of muscle histology with the aim of providing a reproducible tool for use in evaluating and comparing any histologic changes occurring in patients with DMD undergoing treatment and hence be able to determine how therapy modulates the histologic evolution of the disease.
Methods:
Three independent operators analyzed 56 muscle biopsies from 40 patients not treated with steroids, aged 1 to 10 years and 16 individuals treated with steroids, aged 7 to 10 years. We analyzed morphologic measures, normalized every measure for the average number of fibers observed for each year of age, and calculated intraclass correlation coefficients.
Results:
The average proportion of connective tissue in patients not treated with steroids was 16.98% from ages 1 to 6 years and 30% from ages 7 to 10 years (p < 0.0001). The average proportion in patients treated with steroids was 24.90%. Muscle fiber area mirrored that of connective tissue in both groups.
Conclusions:
Having provided a reproducible tool for evaluation and comparison of histologic changes occurring in patients undergoing clinical trials, it was observed that at ages 6 to 7 years, fibrotic tissue rapidly peaks to 29.85%; this is a crucial moment when muscle tissue loses its self-regeneration ability, veering toward fibrotic degeneration. These data should be considered when deciding the most suitable time to begin therapy.
Duchenne muscular dystrophy (DMD) is the most common muscular dystrophy in childhood, affecting 1 in 5,000 male births.1 Currently, no resolutive treatments are available for DMD. Glucocorticoids are considered the standard of care2; however, other approaches have been tried and some trials are ongoing. One of the main outcome measures used in some clinical trials is the restoration of dystrophin (e.g., ataluren, exon skipping drugs),1,3–6 while other trials focus on modulating the cascade of morphologic events related to the lack of dystrophin (e.g., histone deacetylase inhibitors, phosphodiesterase type 5A inhibitors, synthetic analogs of coenzyme Q10).4,6–8 Recently, the European Medicines Agency's Committee for Medicinal Products for Human Use recommended conditional marketing authorization for Translarna (ataluren) for patients with DMD and nonsense mutations in the dystrophin gene.3,4,9
In addition to clinical outcome measures, some trials include skeletal muscle biopsy as a primary or secondary outcome measure.4 Muscle biopsy facilitates monitoring of treated patients in terms of both dystrophin immunohistochemical expression and morphologic evaluation; moreover, it allows comparison of age-matched treated and untreated patients regarding muscle morphology in order to determine the effects of therapy on the histologic natural history of the disease. Lastly, a systematic study of the histologic natural history of DMD is virtually absent from the literature, except for a few isolated or anecdotal reports.10,11 We therefore studied the natural history of DMD from the standpoint of muscle histology with the aim of providing a reproducible tool for evaluation and comparison of histologic changes occurring in patients with DMD treated with steroids.
METHODS
Patients.
We evaluated 2 series of biopsies obtained from patients with DMD, some of them treated and some of them not treated with steroids. All patients had a diagnosis of DMD (confirmed with genetic testing). Patients with Becker muscular dystrophy were not included.
After considering the number and size of available samples for each age, we decided to analyze 56 muscle biopsies (45 brachial biceps and 11 quadriceps femoral muscles) from 40 patients not treated with steroids, aged 1 to 10 years and from 16 individuals treated with steroids, aged 7 to 10 years. Thus, we analyzed 4 samples for each year of age in both groups, ensuring analytical accuracy for each selected age. We also obtained muscle biopsies from 20 healthy subjects, aged 1 to 10 years (i.e., controls), who underwent orthopedic surgery for traumatic injuries.
Standard protocol approvals, registrations, and patient consents.
All muscle biopsies were from the following: Bank of muscle tissue, peripheral nerve tissue, DNA and cell culture of the UOD Malattie Neuromuscolari, IRCCS Ca' Granda Ospedale Maggiore Policlinico, Milano; Bank of cells, tissues and DNA from patients with neuromuscular diseases, Fondazione IRCCS Istituto Neurologico C. Besta, Milano; Laboratory of Molecular Medicine for Muscular and Neurodegenerative Diseases, Bambino Gesù Children's Hospital, Rome; and Department of Neurosciences Rita Levi Montalcini, University of Turin.
The ethical committee approved the protocol for these studies, in agreement with Italian law and Biobank rules (Telethon Network for Genetics Biobanks and Eurobiobank).
Procedures.
Muscle tissue specimens were frozen in isopentane-cooled liquid nitrogen and the cryosections obtained were processed according to standard histologic techniques. Dystrophin was evaluated as described.12,13 We evaluated the following morphologic measures: fibrotic tissue, necrotic, regenerating and hypercontracted fibers, internal nuclei, cellular reactions, fiber size variability, and muscle fiber area (MFA).
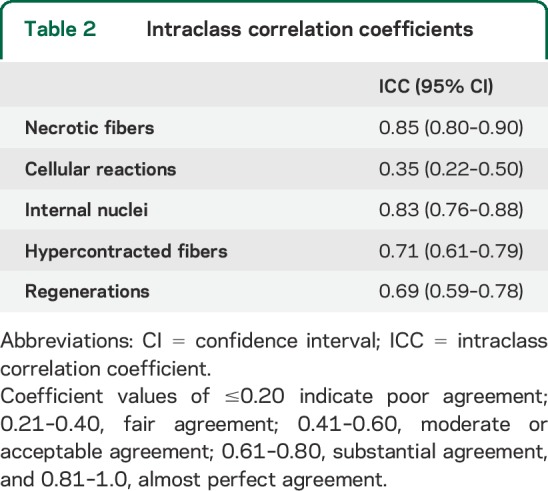
Three operators, each blinded to specimen type and identity, evaluated each specimen using an optical microscope (Leica DC200 equipped with camera and IM50 image analyzer software) at 25× magnification for cell counting using a 0.24 × 0.24 mm square grid. Each operator observed a muscle area of 100 mm2 for each patient, choosing 4 random areas on the same cryostatic section (12 grids for each biopsy). In each selected field, we counted the number of necrotic, regenerating, and hypercontracted fibers, as well as the number of fibers with internal nuclei and cellular inflammatory reactions (table 1). Mean values were calculated for all the measures for each age (4 biopsies analyzed for each age). The final value represents the mean of the mean values obtained by each operator. Values were expressed as a percentage of the total number of fibers in each microscopic grid field. We used intraclass correlation coefficients (ICCs) to assess the reliability of each morphologic measure and the agreement between operators14 (table 2).
Table 1.
Comparison of the morphologic measures in patients not treated vs treated with steroids, aged 7 to 10 years

Table 2.
Intraclass correlation coefficients
For evaluation of fiber size variability, we used a scale ranging from + (minimal variability of fiber size) to +++++ (greatest variability), as described in an earlier article.15 To quantify the extent of fibrotic tissue, i.e., the quantity of both perimysial and endomysial tissue, we analyzed 4 digitized nonoverlapping consecutive images for each biopsy section using an optical microscope (Leica DC200) at 25× magnification with IM50 software. Then we processed the images with ImageJ 1.46r (NIH, downloadable at http://rsbweb.nih.gov/ij/download.html) to obtain measurements of total fibrosis by color subtraction, which were then expressed in percentage area, as described previously (figure 1).16 ImageJ is a widely available, free image analysis software used to measure tissue areas and volumes with highly reliable results.17,18 MFA is the area occupied by normal, nonnecrotic muscular tissue. To calculate the percentage of MFA, the same images were analyzed, with the same ImageJ software, to quantify the area occupied by necrotic fibers. Then, the percentage of necrotic and fibrotic tissue was subtracted from the total area of each image. Average MFA values were calculated for each patient and each age. Student t test was used for data analysis.
Figure 1. Connective tissue assessment (perimysial and endomysial).

(A and C) Hematoxylin & eosin staining. (B and D) Color subtraction of A and C using ImageJ 1.46r software to measure total fibrosis. Leica DC200 optical microscope, 25× magnification.
RESULTS
Control muscle samples.
All specimens had normal muscle architecture with homogeneous fiber size, no necrotic muscle fibers, and less than 2% internalized nuclei and/or splitting fibers. We did not detect any regenerative fibers. The percentage of connective tissue was 3% or less in every patient, and fiber size variability was normally related to fiber type. Dystrophin was normally localized at the sarcolemma.
DMD muscle samples.
We detected no morphologic differences between biceps and quadriceps muscles for any of the analyzed measures. All samples showed variable, but increased perimysial and endomysial connective tissue, frequent fibrotic substitution of single fibers and/or entire fascicles, and several prenecrotic (hyperchromic/hypercontracted) and several necrotic fibers, the latter sometimes with macrophagic infiltrations. Dystrophin was absent in all specimens. Scattered revertant fibers were detected in a few specimens in a range from 0.02% to 6% in agreement with the usual representation of revertant fibers seen in the DMD population.19–21 No correlations between presence of revertant fibers, clinical severity, and disease progression have been reported so far.22,23 We observed regenerative fibers, often located in small groups, splitting fibers, centrally located nuclei, and also fiber size variability due to the presence of both hypertrophic and hypotrophic fibers. The alterations described were present in all specimens, sometimes with major quantitative differences depending on patient age.
Patients not treated with steroids (40 patients).
Connective tissue.
We observed increased connective tissue, up to 16.50% (SD 7.84) as early as 1 year of age (3% in healthy patients of the same age), which increased only slightly until the age of 6 years. However, we observed a more consistent and rapid increase in fibrotic tissue between 6 and 7 years of age. Indeed, at age 7 years, the proportion rises to 29.85% (SD 7.75), an increase of more than 10% in only 1 year. Between the ages of 7 and 10 years, the increase resumed a slowly progressive trend (figure 2). Thus, our cohort can be separated into 2 groups corresponding to 2 age ranges: 1–6 years and 7–10 years. Average connective tissue percentages were 16.98% (SD 4.90) and 30% (SD 8.65), respectively (p < 0.0001).
Figure 2. Connective tissue and MFA evaluation in untreated and treated patients.

(A) Connective tissue in patients not treated with steroids (40 patients) shows a more consistent and rapid increase in fibrotic tissue between 6 and 7 years of age. At the age of 7, the proportion rises to 29.85% (SD 7.75) corresponding to an increase of more than 10% in 1 year. Connective tissue in patients treated with steroids (16 patients aged 7–10 years) ranged from 22.38% (SD 8.5) to 29.85% (SD 6.49) with increasing age. (B) MFA in the steroid-free group (40 patients). The values remained quite stable between 1 and 6 years of age (range from 79.14% [SD 0.05] to 85.04% [SD 0.06]), but a reduction was evident in patients older than 7 years (values between 69.84% [SD 0.1] and 74.47% [SD 0.05]). In the steroid-treated group (16 patients aged 7–10 years), MFA values ranged between 68.44% (SD 0.08) and 77.09% (SD 0.13).
Necrotic fibers.
The percentage of necrotic fibers rapidly increased from 1 to 3 years of age (from 0.38% [SD 0.26] to 2.95% [SD 2.11]) then the values remained quite stable (range: 1.51% [SD 1.28] and 1.81% [SD 0.61]) except for a slight reduction at the age of 6 years (0.93% [SD 0.63]).
Regenerative fibers.
We observed a mildly progressive increase in regenerative fibers between 1 and 6 years (0.56% [SD 0.37] to 1.36% [SD 1.6]) and between 8 and 9 years of age (2.6% [SD1.86] and 1.96% [SD 1.58]), a decreasing trend being evident at 7 (0.8% [SD 0.3]) and 10 years of age (0.42% [SD 0.37]). For fibers with central nuclei, we observed a progressive increase in their number from 1.31% (SD 0.64) to 8.90% (SD 3) between 1 and 10 years of age. The percentage of hypercontracted fibers was quite low and stable for all ages.
Conversely, cellular infiltrates were scattered, in small amounts, in some samples without any observable correlation with age and/or number of necrotic fibers (figure 3).
Figure 3. Evaluation of morphologic measures in patients without and with steroids.

(A) Necrotic fibers, regenerating fibers, internal nuclei, hypercontracted fibers, and cellular reactions in patients not treated with steroids (40 patients). (B) Necrotic fibers, regenerating fibers, internal nuclei, hypercontracted fibers, and cellular reactions in patients treated with steroids (16 patients).
MFA.
MFA values remained quite stable between 1 and 6 years of age (range: 79.14% [SD 0.05] to 85.04% [SD 0.06]), then we observed a reduction in patients older than 7 years (range: 69.84% [SD 0.1] to 74.47% [SD 0.05]). The average MFA percentage for ages 1–6 years and ages 7–10 years was 82.3% (SD 2.26) and 70.49% (SD 3.54), respectively (p < 0.0001) (figure 2). Fiber size variability increased progressively with age.
Steroid-treated group (16 patients).
The amount of connective tissue increased with age, between 22.38% (SD 8.5) and 29.85% (SD 6.49) (figure 2), whereas necrotic fibers were quite stable for all ages examined (range: 2.16% [SD 1.06] to 3.16% [SD 2.44]). MFA values ranged between 68.44% (SD 0.08) and 77.09% (SD 0.13) (figure 2).
Regenerative fibers remained quite stable, between 0.74% (SD 0.68) and 1.34% (SD 2.45) for all ages examined.
The percentage of fibers with internal nuclei increased from 5.19% (SD 1.31) at age 6 years to 7.35% (SD 5.66) at age 7 years, and a slight reduction was observed at the ages of 9 and 10 years (6.43% [SD 3.80] to 6.32% [SD 2.27]).
We observed a 0.25% (SD 0.22) to 0.75% (SD 1.23) proportion of hypercontracted fibers, whereas inflammatory cell reactions remained below 0.37% (SD 0.25) in all the ages examined (figure 3). Fiber size variability increased with age.
The ICC index showed a medium to high agreement for all examined measures, except for the inflammatory reaction in which the ICC test was compromised because of the extremely low number of infiltrates per biopsy (table 2).
DISCUSSION
We studied the evolution of muscle alterations in a large cohort of both steroid-treated and untreated patients with DMD to characterize the human histologic natural history model of DMD. We focused on the age-related changes in several morphologic measures. To reduce possible errors caused by interindividual variability, we analyzed 4 patients for each year of age and validated the results using the ICC.
Our most interesting result is quantification of connective tissue in the patient samples. Previous reports10 distinguished between perimysial and endomysial tissue. We considered connective tissue as a whole, because both perimysium and endomysium contribute to the formation and maintenance of the normal muscle environment.16 The steroid-free group of muscle biopsies had increasing connective tissue as early as age 1 year (16.50%) compared with healthy control subjects (3%), dating the beginning of skeletal muscle degeneration back to intrauterine life.24,25 The amount of connective tissue—expressing the fibrotic substitution of muscle tissue—remains stable until 6 years of age (13.94%–19.47%), probably because muscle homeostasis is still able to support the rapid degenerative–regenerative turnover until that age.26–30 Between 6 and 7 years of age, fibrotic tissue rapidly peaks to 29.85% (more than a 10% increase), then it resumes a mild but progressive increase (27.42%–32.75%) until the age of 10 years. Grouping our samples in 2 age ranges, the first from 1 to 6 and the second from 7 to 10 years of age, we calculated an average connective tissue amount of 16.65% (SD 1.59) for the former and 30% (SD 2.18) for the latter. These data correlate with MFA values: we observed that the average percentage of muscular tissue for ages 1–6 years and 7–10 years was 82.07% and 70.26%, respectively. Our findings point to the age of 6–7 years as a crucial time period in which muscle tissue loses the ability to self-regenerate, veering toward fibrotic degeneration. In view of these results, it is probably no coincidence that patients undergoing steroid treatment, usually starting at age 5 years (in our group between 5 and 6 years of age), show lower amounts of connective tissue and higher MFA values when compared to aged-matched patients not treated with steroids (table 1 and figure 2). Indeed, even though connective tissue is seen to increase even in patients treated with steroids, it is still reasonable to think that fibrotic degeneration is slowed down by the treatment, which would account for the clinical improvements observed.31,32
For necrotic fibers, our results are in agreement with previous studies reporting no significant trends during the evolution of the disease.10 It should be noted that patients treated with steroids had a greater proportion of necrotic fibers. We believe that the increase in necrotic component may be due to the suppression of inflammatory response by the steroids, which somehow preserves the necrotic fibers and modifies the muscular environment also linked to cytokine production.26–30
Regenerating fibers are interesting to analyze because these fibers are central to the muscle repair process. Our results show a progressively increasing quantity of regenerating fibers from 1 to 6 years of age (0.56%–1.36%) followed by a variable trend from 7 to 10 years of age (figure 3). We observed a substantially stable number of regenerating fibers in patients treated with steroids. In the 2 groups, the amount of necrotic fibers was always higher compared to regenerating fibers (according to age groups), as expected (table 1 and figure 3).
The percentage of fibers with central nuclei (i.e., muscle cells that had previously undergone a regenerative process) progressively increased with age, showing no differences between treated and untreated patients.
Hypercontracted fibers and cellular infiltrates did not correlate to age in either DMD group (table 1 and figure 3). This is not in agreement with previous studies, which showed a higher number of hypercontracted fibers at younger ages.10
We were able to make some correlations between morphologic and clinical disease evolution in the first decade of life, but we must consider that even though the clinical progression is well known,33 the morphologic evolution history is still not well elucidated.
It is not easy to recognize DMD in the first 2 years of life because the only clues are nonspecific preclinical signs such as a lower position on the growth curve.34 Indeed, more consistent and almost pathognomonic symptoms such as gait abnormalities and/or difficulties in climbing stairs and running only become evident around the age of 3 years. Between 3 and 6 years of age, almost all patients develop a hyperlordotic and waddling gait, Gower sign, scapular winging, hypertrophic calves, and contractures. Six-Minute Walk Test distance starts to decrease around 7 years of age.35
Respiratory impairment usually starts at approximately 8 to 9 years of age and ambulation ability is lost at around the age of 13 years.33 Creatine kinase levels are already increased in the first year of life and progressively increase until the age of 6 years, at which time the levels start to decrease because of progressive muscle consumption.36
Clinical and laboratory data correlate with our morphologic observations and confirm that, around the age of 6 to 7 years, the well-known dramatic progression of weakness is mainly activated due to irreversible fibrotic muscle degeneration along with other epigenetic factors still under identification. As observed, when started before this crucial point is reached, steroid treatment helps delay the loss of motor skills.
Identification of a crucial moment for muscle tissue preservation is essential to establish the most correct recruitment age for participation in clinical trials. Indeed, we recommend considering the age of 6 years as a cutoff point and recommend starting treatment before skeletal muscle loses the ability to self-regenerate and shifts toward fibrotic degeneration. Elucidating what causes this sudden, unexpected change in muscle homeostasis is beyond the scope of this study. Investigators should consider exploring the possible role of epigenetic pathways regulating muscle homeostasis, which may involve various cytokines, as well as growth factors and differentiation factors.26–30,37
Our data regarding quantification of connective tissue in patients treated with steroids aged 6 to 10 years could be used as a morphologic measure for evaluation of the therapeutic efficacy in clinical trials using morphologic evaluation as an outcome measure. It is hoped that comparisons between connective tissue amount trends in treated patients and our data will shed more light on treatment efficacy.
This study is based on a cross-sectional retrospective design; a longitudinal study design would have been a better model to conduct the analyses on a larger patient cohort. However, the main drawback to a longitudinal study is of an ethical nature, since it would imply performing repeated muscle biopsies on the same child.
Muscle MRI is a developing tool, and even though it gives no information about the evolution/progression of certain morphologic measures (number of necrotic or hypercontracted fibers, exact localization of connective tissue inside the muscular fascicles), we anticipate that it will permit the longitudinal assessment of muscle tissue to be performed without the need for invasive procedures.38,39 We believe that MRI and muscle biopsies can be complementary for the definition of progressive muscle alterations over time.
We think that this morphologic model for the systematic study of DMD skeletal muscle is a useful tool to help define the correct recruitment age for clinical trials and facilitate the interpretation of the results of current and previous studies by comparing the posttherapy conditions of the muscles with those predicted by the natural histologic history of the disease.
ACKNOWLEDGMENT
The authors thank Valentina D'Oria, biologist, for her laboratory assistance. The authors also thank Associazione Amici del Centro Dino Ferrari, the Biobank of skeletal muscle, peripheral nerve, DNA and cell cultures and The cells, tissues and DNA from patients with neuromuscular diseases biobank—members of the Telethon Network of Genetic Biobanks (Project GTB12001)—and the Eurobiobank Network for providing us with some specimens. The authors thank Dr. Patrizia Quattrocchi and Spaziolingue agency for the English revision of the manuscript.
GLOSSARY
- DMD
Duchenne muscular dystrophy
- ICC
intraclass correlation coefficient
- MFA
muscle fiber area
AUTHOR CONTRIBUTIONS
L.P., S.T., and L.V. designed and executed the experiments. A.D., F.M., and M. Mora performed the molecular genetic diagnosis. L.M., T.M., and S.P. provided patient samples. L.P. and S.T. wrote the first draft. G.P.C and E.B. advised on experiment design and execution. M. Moggio and M.S. coordinated data analysis and collection and edited the manuscript. C.F. advised on statistical data analyses.
STUDY FUNDING
No targeted funding reported.
DISCLOSURE
The authors report no disclosures relevant to the manuscript. Go to Neurology.org for full disclosures.
REFERENCES
- 1.Mendell JR, Rodino-Klapac LR, Sahenk Z, et al. Eteplirsen for the treatment of Duchenne muscular dystrophy. Ann Neurol 2013;74:637–647. [DOI] [PubMed] [Google Scholar]
- 2.Hoffman EP, Reeves E, Damsker J, et al. Novel approaches to corticosteroid treatment in Duchenne muscular dystrophy. Phys Med Rehabil Clin N Am 2012;23:821–828. [DOI] [PMC free article] [PubMed] [Google Scholar]
- 3.Finkel RS, Flanigan KM, Wong B, et al. Phase 2a study of ataluren-mediated dystrophin production in patients with nonsense mutation Duchenne muscular dystrophy. PLoS One 2013;8 e81302. [DOI] [PMC free article] [PubMed] [Google Scholar]
- 4.ClinicalTrials.gov. Available at: www.Clinicaltrials.gov. Accessed February 20, 2015.
- 5.Goemans NM, Tulinius M, van den Akker JT, et al. Systemic administration of PRO051 in Duchenne's muscular dystrophy. N Engl J Med 2011;364:1513–1522. [DOI] [PubMed] [Google Scholar]
- 6.Govoni A, Magri F, Brajkovic S, et al. Ongoing therapeutic trials and outcome measures for Duchenne muscular dystrophy. Cell Mol Life Sci 2013;70:4585–4602. [DOI] [PMC free article] [PubMed] [Google Scholar]
- 7.Buyse GM, Van der Mieren G, Erb M, et al. Long-term blinded placebo-controlled study of SNT-MC17/idebenone in the dystrophin deficient mdx mouse: cardiac protection and improved exercise performance. Eur Heart J 2009;30:116–124. [DOI] [PMC free article] [PubMed] [Google Scholar]
- 8.Buyse GM, Goemans N, van den Hauwe M, et al. Idebenone as a novel, therapeutic approach for Duchenne muscular dystrophy: results from a 12 month, double-blind, randomized placebo-controlled trial. Neuromuscul Disord 2011;21:396–405. [DOI] [PubMed] [Google Scholar]
- 9.European Medicines Agency. Available at: www.ema.europa.eu. Accessed February 20, 2015.
- 10.Desguerre I, Mayer M, Leturcq F, et al. Endomysial fibrosis in Duchenne muscular dystrophy: a marker of poor outcome associated with macrophage alternative activation. J Neuropathol Exp Neurol 2009;68:762–773. [DOI] [PubMed] [Google Scholar]
- 11.Bell CB, Conen PE. Histopathological changes in Duchenne muscular dystrophy. J Neurol Sci 1968;7:529–540. [DOI] [PubMed] [Google Scholar]
- 12.Dubowitz V, Sewry CA, Lane RJM. Muscle Biopsy: A Practical Approach, 3rd ed Philadelphia: Saunders Elsevier; 2007. [Google Scholar]
- 13.Prelle A, Comi GP, Tancredi L, et al. Sarcoglycan deficiency in large Italian population of myopathic patients. Acta Neuropathol 1998;96:509–514. [DOI] [PubMed] [Google Scholar]
- 14.Hankinson SE, Manson JE, Spiegelman D, et al. Reproducibility of plasma hormone levels in postmenopausal women over a two to three year period. Cancer Epidemiol Biomarkers Prev 1995;4:649–654. [PubMed] [Google Scholar]
- 15.Gabellini D, D'Antona G, Moggio M, et al. Facioscapulohumeral muscular dystrophy in mice overexpressing FRG1. Nature 2006;439:973–977. [DOI] [PubMed] [Google Scholar]
- 16.Mendel J, Sahenk Z, Malik1 V, et al. A phase 1/2a follistatin gene therapy trial for Becker muscular dystrophy. Mol Ther 2015;23:192–201. [DOI] [PMC free article] [PubMed] [Google Scholar]
- 17.Collins TJ. ImageJ for microscopy. Biotechniques 2007;43(1 suppl):25–30. [DOI] [PubMed] [Google Scholar]
- 18.Fortin M, Battié MC. Quantitative paraspinal muscle measurements: inter-software reliability and agreement using OsiriX and ImageJ. Phys Ther 2012;92:853–864. [DOI] [PubMed] [Google Scholar]
- 19.Klein CJ, Coovert DD, Bulman DE, Ray PN, Mendell JR, Burghes AH. Somatic reversion/suppression in Duchenne muscular dystrophy (DMD): evidence supporting a frame-restoring mechanism in rare dystrophin-positive fibers. Am J Hum Genet 1992;50:950–959. [PMC free article] [PubMed] [Google Scholar]
- 20.Thanh LT, Nguyen TM, Helliwell TR, Morris GE. Characterization of revertant muscle fibers in Duchenne muscular dystrophy, using exon-specific monoclonal antibodies against dystrophin. Am J Hum Genet 1995;56:725–731. [PMC free article] [PubMed] [Google Scholar]
- 21.Uchino M, Tokunaga M, Mita S, et al. PCR and immunocytochemical analyses of dystrophin-positive fibers in Duchenne muscular dystrophy. J Neurol Sci 1995;129:44–50. [DOI] [PubMed] [Google Scholar]
- 22.Fanin M, Danieli GA, Vitiello L, Senter L, Angelini C. Prevalence of dystrophin positive fibers in 85 Duchenne muscular dystrophy patients. Neuromuscul Disord 1992;2:41–45. [DOI] [PubMed] [Google Scholar]
- 23.Arechavala-Gomeza V, Kinali M, Feng L, et al. Revertant fibres and dystrophin traces in Duchenne muscular dystrophy: implication for clinical trials. Neuromuscul Disord 2010;20:295–301. [DOI] [PubMed] [Google Scholar]
- 24.Emery AE. Muscle histology and creatine kinase levels in the foetus in Duchenne muscular dystrophy. Nature 1977;266:472–473. [DOI] [PubMed] [Google Scholar]
- 25.Toop J, Emery AE. Muscle histology in fetuses at risk for Duchenne muscular dystrophy. Clin Genet 1974;5:230–233. [DOI] [PubMed] [Google Scholar]
- 26.Giordani L, Puri PL. Epigenetic control of skeletal muscle regeneration integrating genetic determinants and environmental changes. FEBS J 2013;280:4014–4025. [DOI] [PMC free article] [PubMed] [Google Scholar]
- 27.Sartorelli V, Juan AH. Sculpting chromatin beyond the double helix: epigenetic control of skeletal myogenesis. Curr Top Dev Biol 2011;96:57–83. [DOI] [PMC free article] [PubMed] [Google Scholar]
- 28.Bharathy N, Ling BM, Taneja R. Epigenetic regulation of skeletal muscle development and differentiation. Subcell Biochem 2013;61:139–150. [DOI] [PubMed] [Google Scholar]
- 29.Palacios D, Mozzetta C, Consalvi S, et al. TNF/p38α/polycomb signalling to Pax7 locus in satellite cells links inflammation to the epigenetic control of muscle regeneration. Cell Stem Cell 2010;7:455–469. [DOI] [PMC free article] [PubMed] [Google Scholar]
- 30.Dilworth FJ, Blais A. Epigenetic regulation of satellite cell activation during muscle regeneration. Stem Cell Res Ther 2011;2:18. [DOI] [PMC free article] [PubMed] [Google Scholar]
- 31.Biggar WD, Harris VA, Eliasoph L, Alman B. Long-term benefits of deflazacort treatment for boys with Duchenne muscular dystrophy in their second decade. Neuromuscul Disord 2006;16:249–255. [DOI] [PubMed] [Google Scholar]
- 32.Bushby K, Muntoni F, Urtizberea A, Huges R, Griggs R. Report on the 124th ENMC International Workshop. Treatment of Duchenne muscular dystrophy; defining the gold standards of management in the use of corticosteroids. Neuromuscul Disord 2004;14:526–534. [DOI] [PubMed] [Google Scholar]
- 33.Engel AG. Myology, 3rd ed New York: McGraw-Hill; 2004. [Google Scholar]
- 34.Eiholzer U, Boltshauser E, Frey D, Molinari L, Zachmann M. Short stature: a common feature in Duchenne muscular dystrophy. Eur J Pediatr 1988;147:602–605. [DOI] [PubMed] [Google Scholar]
- 35.McDonald CM, Henricson EK, Abresch RT, et al. The 6-Minute Walk Test and other endpoints in Duchenne muscular dystrophy: longitudinal natural history observations over 48 weeks from a multicenter study. Muscle Nerve 2013;48:343–356. [DOI] [PMC free article] [PubMed] [Google Scholar]
- 36.Zatz M, Rapaport D, Vainzof M, et al. Serum creatine-kinase (CK) and pyruvate-kinase (PK) activities in Duchenne (DMD) as compared with Becker (BMD) muscular dystrophy. J Neurol Sci 1991;102:190–196. [DOI] [PubMed] [Google Scholar]
- 37.Mozzetta C, Consalvi S, Saccone V, et al. Fibroadipogenic progenitors mediate the ability of HDAC inhibitors to promote regeneration in dystrophic muscles of young, but not old Mdx mice. EMBO Mol Med 2013;5:626–639. [DOI] [PMC free article] [PubMed] [Google Scholar]
- 38.Finanger EL, Russman B, Forbes SC, Rooney WD, Walter GA, Vandenborne K. Use of skeletal muscle MRI in diagnosis and monitoring disease progression in Duchenne muscular dystrophy. Phys Med Rehabil Clin N Am 2012;23:1–10. [DOI] [PMC free article] [PubMed] [Google Scholar]
- 39.Hollingsworth KG, Garrood P, Eagle M, Bushby K, Straub V. Magnetic resonance imaging in Duchenne muscular dystrophy: longitudinal assessment of natural history over 18 months. Muscle Nerve 2013;48:586–588. [DOI] [PubMed] [Google Scholar]