

Abstract
Objectives
Transthoracic echocardiography (TTE) is the mainstay of clinical practice for evaluating right ventricular (RV) size and function, but its accuracy in patients with pulmonary hypertension (PH) has not been well validated.
Methods
Magnetic resonance imaging (MRI) and TTE images were retrospectively reviewed in 40 consecutive patients with PH. Right and left ventricular (LV) volumes and ejection fractions (EFs) were calculated by MRI. TTE areas and indices of RVEF were compared.
Results
The average age was 42 ± 12 years with a majority of women (85%). There was a wide range of mean pulmonary arterial pressure (27 to 81 mmHg), and RV end diastolic volumes (111 to 576 mL), RVEFs (8 to 67 %), and LVEFs (26 to 72%) by MRI. There was a strong association between TTE and MRI derived parameters: RV end-diastolic area (RVEDA, TTE) and RV end-diastolic volume (RVEDV, MRI), R2 = 0.78, p<0.001; fractional area change (RVFAC) by TTE and RVEF by MRI, R2 = 0.76, p<0.001; and tricuspid annular plane systolic excursion (TAPSE), by TTE, and MRI RVEF, R2 = 0.64, p<0.001. By ROC curve analysis, an RVFAC<25%, provides excellent discrimination of moderate systolic dysfunction (RVEF<35%), AUC of 0.97, p<0.001. An RVEDA index of 18 cm2/m2 provides excellent discrimination for moderate RV enlargement (AUC of 0.89, p<0.001).
Conclusions
Echocardiographic estimates of RV volume, by RVEDA, and function, by RVFAC and TAPSE, offer good approximation of RV size and function in patients with PH and allow for accurate discrimination of normal from abnormal.
Keywords: pulmonary hypertension, right ventricle, MRI, echocardiography
Introduction
The assessment of right ventricular (RV) size and function plays an important role in the management of patients with pulmonary hypertension (PH). On transthoracic 2D echocardiography, RV volume is often estimated using linear dimensions or RV area in the apical 4 chamber view. Commonly used 2D indices of RV systolic function include RV fractional area change (RVFAC)1 and tricuspid annular plane systolic excursion (TAPSE).2,3 In contrast to the left heart, volumetric estimates using 2D methods are more difficult owing to the complex geometry of the RV. We aim to examine the value of simple 2D RV indices as measures of RV systolic function in patients with pulmonary hypertension. Although often used clinically in PH and associated with outcomes, these estimates of RV size and function have not been well validated compared to magnetic resonance (MRI) reference standards.4,5,6
In a recent paper, Sato et al. found TAPSE superior to RVFAC, which is in contrast to the MRI-based findings of Kind et al., who showed that RVFAC is superior.7,8 The controversy surrounding the utility of these parameters prompted us to examine the value of 2D echocardiography in patients with PH and compare these conventional simple measures with RV function by MRI. We used receiver operating characteristics (ROC) curve analysis to identify echocardiographic thresholds to discriminate the presence of moderate RV systolic dysfunction.
Methods
Patient selection
A total of 45 patients with PH who underwent MRI and echocardiography between May 2007 and May 2012 were retrospectively considered for inclusion in the study. The diagnosis of PH was established using the WHO criteria defined by a mean pulmonary arterial pressure (MPAP) >25 mmHg and a pulmonary capillary wedge pressure < 15 mmHg. The majority were WHO Group I pulmonary arterial hypertension (n = 42) and 3 were WHO Group IV, chronic thromboembolic PH. Etiology of PH was determined per published guidelines.9 A total of five patients were excluded from the study, 3 patients were excluded because of complex congenital heart disease and prior cardiac surgery, one patient because of atrial fibrillation and one patient because of suboptimal quality of echocardiographic images. Patients with coronary artery disease and prior infarction were not specifically excluded, although were not represented in this sample as all were regularly followed in our PH center and none had risk factors for CAD. Thirty six (90%) of patients underwent echocardiography on the same day as MRI (within 3 hours) and 4 patients underwent echocardiography within 3 weeks (stable clinical status without any change in therapy). Following approval by institutional review board, we also reviewed the patient’s medical records for evaluation of patient characteristics and right heart catheterization data.
Magnetic Resonance Imaging
Cardiac MRI scans were completed on the hospital clinical scanner at 1.5 Tesla (TwinSpeed, GE Healthcare, USA). Images were acquired supine using an 8 channel cardiac phased-array coil. All acquisitions were ECG-gated and obtained during breath-holding. Using initial 3-plane-localizer sequences, a short-axis stack of transverse slices spanning the volume of the LV and RV was obtained. Standard 2-, 3-, and 4-chamber views as well as RV 2- and 3-chamber views were prescribed.
Image assessment was performed offline on an independent workstation using commercially available software. Medis medical imaging software (Medis Medical Imaging Systems, Inc, Leiden, The Netherlands) was used for volume and function quantification. The ventricular volumes were calculated using manual contour tracing of short-axis slices from the apex to the base, including the LV and RV outflow tracts but excluding all trabeculations and papillary muscles. RV 3-chamber and LV 3- and 4-chamber views were used for verification of the exact localization of the valves to allow for accurate segmentation of the tricuspid valve plane and inclusion of the outflow tracts. Multi-phase scans in movie play mode were used for contour tracing guidance. The EFs of the RV and LV were then derived from the chamber volumes at end-diastole and end-systole, as defined by the largest and smallest volumes, respectively, prior to the septal shift, when this was observed.
AquariusNet (TeraRecon, Inc, USA) was used for chamber areas and TAPSE measurements. Using the standard 4-chamber view, LV area was manually contoured at end-diastole and RV area contoured at both end-diastole and end-systole, as defined above (see Figure 1). TAPSE was performed by placing the cursor on the junction of the tricuspid valve plane and the RV free wall in end-diastole, changing the view to the pre-defined end-systolic phase, and extending a line to the same anatomic location. The RVFAC was calculated as the percentage change in RV area between systole and diastole. 3 consecutive measurements of RVFAC were averaged. All MRI measurements were performed by a single experienced cardiologist who was blinded to the TTE data and measurements. A second experienced cardiologist blinded to the initial measurements evaluated 10 patients selected at random for interobserver variability. The measurements were derived independently without knowledge of which frames were analyzed by the primary cardiologist.
Figure 1.

Magnetic resonance imaging and tracing of the RV endocardial border in the 4 chamber long axis view (with basal short axis inset) for RVFAC. The ventricular areas were obtained by manual contour tracing in the 4-chamber view, excluding all trabeculations and papillary muscles. Section A shows measures in diastole and B in systole.
Echocardiography
All TTE studies were performed at the Stanford Hospital and Clinics echocardiography laboratory using a Philips iE33 ultrasound system (Philips Electronics, Andover, MA) and a Philips S5-1 transducer (5 to 1 MHz extended operating frequency range, harmonic imaging). Standard TTE views were obtained and digitized images were analyzed by a reader blinded to the MRI data and measurements. A second experienced cardiologist blinded to the initial measurements evaluated 10 patients selected at random for interobserver variability for MRI. All measurements were averaged over 3 cardiac cycles.
LV end-diastolic and end-systolic diameter (LVEDD and LVESD respectively) were measured by American Society of Echocardiography (ASE) recommendations using 2D linear method from the parasternal long axis view.10 Because of the presence of interventricular dyssynchrony observed in PH, the LVEDD measures were standardized to the beginning of the QRS and LVESD was standardized at aortic valve closure, which in the majority of cases does not correspond to the smallest LV diameter.11,12
Measures of the RV outflow tract (RVOT) were performed in the parasternal long-axis view and the basal parasternal short-axis view (Figure 2). Additional linear measures of the RV were performed in the apical 4-chamber view, including basal radial diameter, mid radial diameter and RV length (Figure 2). The RV and LV end-diastolic and end-systolic areas were measured from a standard apical 4-chamber view using the largest and smallest area, prior to the septal shift (Figure 2). 3 consecutive measurements of RVFAC were averaged. RVFAC was calculated as relative systolic to diastolic RV area change. All measurements excluded trabeculations. To ensure a standard 4 chamber view was used, maximal RV diastolic diameter was measured in apical 4 chamber and found to be within 15% of maximal diastolic diameter in short axis. TAPSE was measured using a 2-dimensional method as the total displacement of the tricuspid annulus from end-diastole to end-systole.13,14 For TAPSE, the 2D apical 4-chamber view was used, the cursor was placed on the junction of the tricuspid valve plane and the RV free wall in end-diastole, and, after scrolling to end-systole, a line was extended to the same anatomic location. This was done in the same manner as for MRI above. We used 2D method for TAPSE measurements as measures based on M-mode were not acquired in 5 patients. In the remainder of patients the correlation between 2D and M-mode derived measures of TAPSE had a correlation of 0.94, p< 0.001. Fractional TAPSE was calculated as TAPSE divided by RV length. Fractional radial shortening of the RV was measured using the relative change in end-diastolic to end-systolic diameter change for the apical, mid, and basal measurements.
Figure 2.

Representative linear and two-dimensional measures of RV size and function in images from the same patient as Figure 1. Section A shows measures of the infundibulum (RVOT1) and the LVEDD in the parasternal long axis view. Section B shows measures of the RV outflow tract (RVOT 2 and 3) in the short-axis view. Section C shows measures of RVEDA and basal and mid RVEDD. Section D shows measures of RVESA, basal and mid RVESD and 2D TAPSE.
Tricuspid regurgitation was graded as severe if at least 2 of the following criteria were met: vena contracta width > 0.7cm, jet area > 10cm2 for central jets at a Nyquist limit of 50–60 cm/s with a relative jet to atrial size > 40%, or systolic reversal in the hepatic veins.15 Right ventricular systolic pressure was estimated by maximal velocity of the tricuspid regurgitation Doppler signal with right atrial pressure estimations made based on the collapse index and size of the inferior vena cava.10
Statistical analysis
All statistical analyses were performed using PASW Statistics 18 (SPSS Inc, Hong Kong). Multiple regression analysis was used to determine the relationship between echocardiographic and MRI derived indices of RV and LV size and function. Bland-Altman analysis was used to determine the mean difference between MRI and echocardiographic derived measures of LV volumes and LVEF and linear and 2D measures of RV size and function. ROC curves were constructed using MedCalc Software (Ostend, Belgium), with cutoff values selected based on existing guidelines. A p value of <0.05 was considered statistically significant. Interobserver variability was analyzed using the intraclass correlation coefficient (ICC).
Results
Patient Characteristics
A total of 40 patients with PH were included in the study. The clinical characteristics, etiology of PH, relevant laboratory values, invasive hemodynamics, and medication profile are noted in Table 1. MRI and TTE parameters are listed in Table 2.
Table 1.
Patient characteristics (n = 40). Data is represented as mean ± standard deviation.
| Variable | Value | Range |
|---|---|---|
| Age (years) | 42 ± 12 | 19 – 70 |
| Male | 6 (15%) | |
| Etiology | ||
| Idiopathic | 18 (45%) | |
| Associated with connective tissue disease | 8 (20%) | |
| Associated with Congenital heart diseases | 5 (13%) | |
| Drugs and toxin-associated | 5 (13%) | |
| Chronic thromboembolic pulmonary hypertension | 3 (8%) | |
| Associated with HIV infection | 1 (3%) | |
| Hemodynamics | ||
| Systolic systemic blood pressure (mmHg) | 114 ± 19 | 78 – 172 |
| Heart rate (bpm) | 74 ± 14 | 49 – 107 |
| Mean right atrial pressure (mmHg) | 8.6 ± 5.4 | 1 – 21 |
| Pulmonary capillary wedge pressure (mmHg), (n = 39) | 9.7 ± 4.9 | 3 – 15 |
| Mean pulmonary artery pressure (mmHg), (n = 38) | 46.6 ± 15.0 | 27 – 81 |
| Cardiac index (L/min/m2) | 2.02 ± 0.57 | 0.98 – 3.66 |
| MRI | ||
| RVEDV (mL) | 231 ± 101 | 111 – 576 |
| RVEF (%) | 35 ± 15 | 8 – 67 |
| LVEF (%) | 57 ± 10 | 26 – 72 |
| LV Stroke volume | 61 ± 25 | 13 – 152 |
| Laboratory (n = 39) | ||
| Serum creatinine (mg/mL) | 1.0 ± 0.6 | 0.4 – 6.0 |
| NT-BNP (ng/L) | 2027 ± 4253 | 30 – 24790 |
| Hemoglobin (g/dL) | 13.5 ± 2.3 | 8.4 – 18 |
| Medications | ||
| Prostacycline | 25 (63%) | |
| Phosphodiesterase inhibitors | 18 (45%) | |
| Endothelin receptor antagonists | 6 (15%) |
Table 2.
Relationships between echocardiographic indices and MRI-derived RVEDV
| Relationship between RVEDV and echo parameter | Coefficient of determination (R2) | P | Regression equation (selected relationship) |
|---|---|---|---|
| Linear dimensions | |||
| RVOT-1 | 0.57 | < 0.001 | RVEDV= 11×RVOT − 205 |
| RVOT-2 | 0.47 | < 0.001 | – |
| RVOT-3 | 0.25 | < 0.001 | – |
| RVEDD basal | 0.57 | < 0.001 | RVEDV= 8.5×RVEDDbase − 87 |
| RVEDD mid | 0.65 | < 0.001 | RVEDV= 8.4×RVEDDmid − 147 |
| RV height | 0.38 | < 0.001 | – |
| RV areas | |||
| RVEDA | 0.78 | < 0.001 | RVEDV= 8.2×RVEDA −40 |
| Relative RVEDA (RVEDA/LVEDA) | 0.40 | < 0.001 | |
| (R2= 0.82 for relative RVEDV) | RVEDV/LVEDV= 1.5×(RVEDA/LVEDA) |
Volumes are reported in mL and linear dimensions in mm.
Relationship between echocardiographic and MRI measures of RV size
Table 2 and Figure 3 summarize the relationship between echocardiographic and MRI measures of RV size. The best echocardiographic estimation of RV end-diastolic volume (RVEDV) was the RV end-diastolic area (RVEDA) measurement (R2=0.78, p<0.001). Basal and mid-ventricular measures of the RV also provide reasonable estimation of RVEDV. Relative RV area provides a strong approximation of relative RV to LV end-diastolic volumes, but only a moderate relationship with RVEDV. Correlations between RVEDA and RVEDV were statistically different when compared to correlations between RVEDV and RVOT2 (p=0.019), RVOT3 (p<0.001), RV height (p=0.005) or relative RVEDA (p=0.006). See Figure 2 for details on RVOT measures. There was also good correlation of RVESV and RVESA (R2 = 0.75, p < 0.001). To illustrate the ability of RVEDA to detect RV dilatation (MRI RVEDV index > 104 mL/m2 for women and > 115 mL/m2 for men)16 by echocardiographic RVEDA index, a receiver operating characteristic (ROC) curve was constructed (Figure 5A), with area under curve 0.89 (P < 0.001). An indexed RVEDA of 17.7 cm2/m2 had the highest specificity (87%) and sensitivity (77%) for detecting RV dilation.
Figure 3.

Relationship between MRI-derived RVEDV and selected echocardiographic measures: (A) RVEDA and RVEDV. (B) Relative RVEDV and relative RVEDA when compared with LVEDV and LVEDA.
Figure 5.
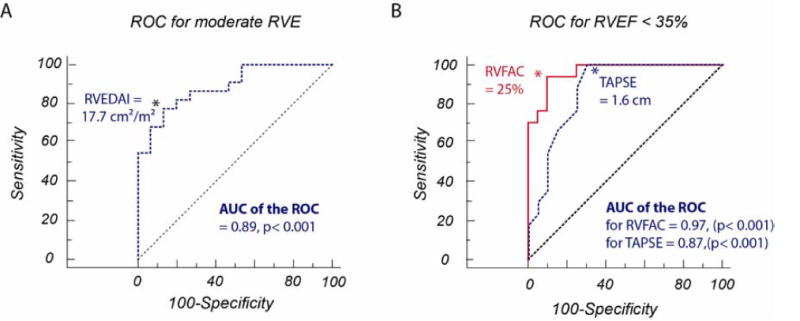
Receiver operating characteristic curves: (A) Detecting RV dilatation (MRI RVEDV index > 104 mL/m2 for women and > 115 mL/m2 for men) by echocardiographic RVEDA index (area under curve 0.89). (B) Detecting moderately diminished RV systolic function (MRI RVEF < 35%) by echocardiographic RVFAC (area under curve 0.97) and TAPSE (area under curve 0.87). P = 0.07 for comparison between curves.
Relationship between echocardiographic and MRI measures of RV systolic function
Table 3 and Figure 4 summarize the relationship between echocardiographic and MRI measures of RV function. The best echocardiographic estimation of RVEF was the RVFAC measurement (R2=0.76, p<0.001). Both TAPSE and TAPSE normalized to height provided good approximation of RVEF in contrast to basal or mid radial shortening. Correlations between RVFAC and RVEF were statistically superior when compared to correlations between RVEF and basal fractional radial shortening (p=0.003) and mid fractional radial shortening (p=0.009).
Table 3.
Relationships between echocardiographic and MRI indices of RV systolic function
| Echo parameter | Coefficient of determination (R2) | p | Regression equation |
|---|---|---|---|
| RVFAC | 0.76 | < 0.001 | RVEF = RVFAC + 5.5 |
| TAPSE | 0.64 | < 0.001 | RVEF = 20.5×TAPSE − 0.5 |
| Normalized TAPSE | 0.66 | < 0.001 | RVEF = 1.45×(TAPSE/L) + 3.1 |
| Basal Fractional Radial Shortening | 0.31 | < 0.001 | – |
| Mid Fractional Radial Shortening | 0.39 | < 0.001 | – |
Regression equation reported for R2 > 0.5.
Figure 4.
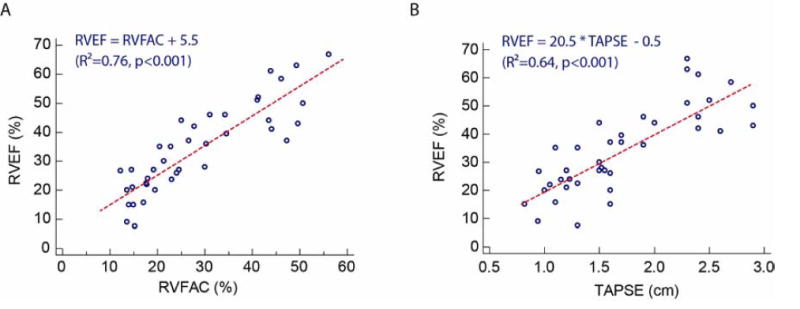
Relationship between MRI-derived RVEF and echocardiographic markers of RV function: (A) RVFAC, (B) TAPSE.
To further illustrate the utility of both TAPSE and RVFAC in distinguishing patients with diminished RVEF by MRI, ROC curves were constructed (Figure 5B). We evaluated RVFAC and TAPSE by echo to detect MRI RVFAC < 35% as moderate RV dysfunction, as suggested by current guidelines.17 The area under the ROC curve was 0.97 for RVFAC and 0.87 for TAPSE (P < 0.001 for both). An RVFAC of <25% offers the most balanced sensitivity (94%) and specificity (90%). A TAPSE cut-off of 1.6 cm offers the best balance of sensitivity (100%) and specificity (70%). When comparing the ROC curves, there was a trend towards significance in favor or RVFAC compared to TAPSE with P = 0.07.
Comparison of echocardiographic and MRI linear and 2D measurements of RV size and function
Compared to MRI derived values, the basal RVEDD differed on average by −0.54 ± 0.64 cm, mid RVEDD by −0.1 ± 0.6cm, RV length by −0.49 ± 0.85cm, RVEDA by −6.1 ± 4.5 cm2, RVFAC by 2.6 ± 4 %, and TAPSE by 0.05 ± 0.33 cm.
It is important to note that while patients with LV pathology and dysfunction as an independent process and not secondary to PH were not excluded from our study, the 4 patients with diminished LVEF were not outliers in any of the above correlations. LVEF estimated by the method of discs (Simpson’s biplane) by TTE systematically overestimated MRI-derived LVEF, with a mean difference of 5 ± 5%.
Interobserver variability
There was good concordance between observers for MRI measures as well as echocardiographic measures of RV size and function. For MRI measures, the absolute difference in RVEF measurement was 0.6 ± 5.3%, with an ICC of 0.97, and 19.8 ± 34.8 mL for RVEDV, with an ICC of 0.98. For RVFAC, the average difference in absolute measurement was 2.0 ± 2.0% with an ICC of 0.87. For TAPSE, the average difference in absolute measurement was 0.1 ± 0.1 cm with an ICC of 0.89.
Discussion
Despite the complex shape of the RV, in our study both linear- and area-based echocardiographic measures of RV size and function in patients with PH correlated well with MRI-derived RV volume and EF.
There have been a limited number of studies validating echocardiographic measures of RV function in patients with PH. Recently, Sato et al.,7 showed that RVEF in patients with PH is best estimated by TAPSE when compared with RVFAC. In contrast, using a larger cohort of patients with PH, Kind et al. showed that MRI derived RVFAC approximated RVEF well in patients with PH.8 Our study is consistent with the findings of Kind et al and adds an echocardiographic component.
Differences in findings between our study and the study of Sato, could be in part attributable to differences in baseline characteristics of the study population. For example, on average, patients in our study has more severe RV systolic dysfunction, with a greater proportion of patients with RVEF < 35%. Moreover, in the study of Sato et al., only 54% of patients had pulmonary arterial hypertension (compared with 92% in our study), with 31% having chronic thromboembolic PH (8% in our study). Whether the different etiology of PH, could affect the accuracy of RVFAC or TAPSE in approximating RVEF will require further study. Additional differences between studies may reflect standardization of measures of RV areas, which can differ due to thickness artifact and trabeculations. Confidence in our measures can be derived from the strong correlations between MRI- and TTE-based measurements, performed for both quality control and validation of measurements. Furthermore, it also meets intuitive sense that area measures, such as RVFAC, would correlate better with RV functional changes as the size of the RV increases and the geometry is distorted with the disease process. TAPSE, a direct measure of systolic shortening, would not be expected to correlate as well with chamber remodeling that does not equally affect the basal, mid, and apical portions of the RV.
Our study also confirms already accepted echocardiographic thresholds useful in discriminating RV systolic dysfunction. The ROC curve analysis confirmed that the RVFAC threshold of 25% proposed by ASE guidelines for moderate systolic dysfunction is excellent at distinguishing moderately reduced RVEF (<35%) by MRI, as it offers the best balance of sensitivity and specificity.10 TAPSE also provided good approximations of RVEF, with a cut-off of 1.6 cm maximizing both sensitivity and specificity, which is also in agreement with guidelines. However, in the guidelines, TAPSE of 1.6 cm is used to distinguish normal from abnormal, but in our study is best to distinguish moderate systolic dysfunction suggesting that a guideline of 1.6 cm may be too low. In contrast to TAPSE and RVFAC, basal or mid fractional radial diameter did not correlate well with RVEF in our study, in contrast to the findings of Kind et al., who used a multi-segmental approach with at least 7 segments for fractional radial change analysis.8,18
It is, however, important to emphasize that due to its simplicity and reproducibility, TAPSE is becoming the most commonly used echocardiographic measure of RV systolic function in patients with PH.2,19 TAPSE can be measured using M-mode or 2D methodology.20,21 We opted to use 2D TAPSE as the study was retrospective and appropriate M-Mode acquisition was limited in quality by difficult border recognition in some patients. Additionally, this 2D method allows for direct comparison with MRI measurements. Other methods for 2D TAPSE by TTE have been described, such as measuring apex to tricuspid annulus in both systole and diastole on apical 4chamber view, which was also found comparable to M-Mode.22 In our study, for internal quality control, we also chose 29 patients who had M-Mode images available and found good correlation with our 2D measurements.
In addition to quantification of RV systolic function, our study also shows that 2D echocardiographic measures provide good estimates of RV size. RV size provides important prognostic information in patients with PH. In the study of Van Wolferen et al., indexed RVEDV was independently associated with mortality in patients with idiopathic PAH.23 Indexed RVESV is also emerging as a strong correlate of survival in idiopathic PAH, representing a marker of both RV remodeling and function.24 Our study demonstrates that despite the complex geometry of the right ventricle, RVEDA and RVESA can provide good estimates for RV end-diastolic and end-systolic volumes. Mid RV end-diastolic diameter also appears to represents a simple reliable marker of RVE. Similar to thresholds of RV systolic function, our ROC analysis also suggest that RVEDA > 18 cm2/m2 may be useful to discriminate moderate RV enlargement.
In the future, 3D echocardiography is likely to play a greater role in quantifying RV size and function. Other groups have utilized 3D echocardiography to improve quantification of RV size and function in healthy controls,25,26,27,28 but this technique is limited in PH patients due to the suboptimal quality ultrasound signal and dilated chamber size.1,29 Recent studies are showing promise, such as with real-time 3D echocardiography using a 2D summation method but remain limited by arrhythmia, frame rate, and RV size.30 In Morikawa, et al., the average RV volume was 202 mL versus our 231 mL.31 In our experience, even in the hands of very experienced sonographers, when RV volumes were large it became very difficult to include the entire RV in a 3D acquisition. Additionally, analysis of volumes is still rather time consuming, although likely comparable with MRI quantification, limiting routine use in a busy echo lab. Further advances in 3D echocardiography and processing are necessary to make it a clinically useful entity for the RV.
Study Limitations
The small sample size of the study limits the ability to do comparisons between indices. However, the wide range of RVEDV and RVEF of our patient population allowed for a meaningful analysis of data. The study was retrospective, and 4 patients did not have their echocardiography on the same day of the MRI. However, these patients were in stable clinical condition without a change in medication or clinical status, making the short time delay between MRI and TTE imaging less significant. Additionally, excluding these patients from statistical analyses did not significantly alter our results. Finally, the diagnostic value of the ROC threshold identified for RVEDA need to be confirmed independently in future studies, whereas the thresholds for RVFAC and TAPSE confirmed existing guidelines.
Conclusion
We have shown that 2D echocardiography provides clinically useful measures of RV volume and EF in patients with PH, using MRI as the gold standard. Further studies will be needed to standardize semi-quantitative evaluation of RV size and function in PH using 2D echocardiography. Future 3D echocardiography methods for quantifying RVEDV or RVEF should also be compared to these simple linear or 2D indices in PH.
Acknowledgments
Funding sources: Stanford Cardiovascular Institute
Footnotes
Publisher's Disclaimer: This is a PDF file of an unedited manuscript that has been accepted for publication. As a service to our customers we are providing this early version of the manuscript. The manuscript will undergo copyediting, typesetting, and review of the resulting proof before it is published in its final citable form. Please note that during the production process errors may be discovered which could affect the content, and all legal disclaimers that apply to the journal pertain.
Conflicts of interest/Disclosures: The Stanford Division of Cardiovascular Medicine has a research agreement with GE Healthcare.
References
- 1.Leary P, Hough C, Ralph D, Kurtz C, Waiss M-P, Sheehan F. Three-dimensional analysis of right ventricular shape and function in pulmonary hypertension. Pulmonary Circulation. 2012;2(1):34. doi: 10.4103/2045-8932.94828. [DOI] [PMC free article] [PubMed] [Google Scholar]
- 2.Forfia PR, Fisher MR, Mathai SC, Housten-Harris T, Hemnes AR, Borlaug BA, et al. Tricuspid annular displacement predicts survival in pulmonary hypertension. Am J Respir Crit Care Med. 2006;174(9):1034–1041. doi: 10.1164/rccm.200604-547OC. [DOI] [PubMed] [Google Scholar]
- 3.Ghio S, Klersy C, Magrini G, D’Armini AM, Scelsi L, Raineri C, et al. Prognostic relevance of the echocardiographic assessment of right ventricular function in patients with idiopathic pulmonary arterial hypertension. Int J Cardiol. 2010;140(3):272–278. doi: 10.1016/j.ijcard.2008.11.051. [DOI] [PubMed] [Google Scholar]
- 4.Benza RL, Miller DP, Gomberg-Maitland M, Frantz RP, Foreman AJ, Coffey CS, et al. Predicting survival in pulmonary arterial hypertension: insights from the Registry to Evaluate Early and Long-Term Pulmonary Arterial Hypertension Disease Management (REVEAL) Circulation. 2010;122(2):164–172. doi: 10.1161/CIRCULATIONAHA.109.898122. [DOI] [PubMed] [Google Scholar]
- 5.Rich S, Dantzker DR, Ayres SM, Bergofsky EH, Brundage BH, Detre KM, et al. Primary pulmonary hypertension. A national prospective study Ann Intern Med. 1987;107(2):216–223. doi: 10.7326/0003-4819-107-2-216. [DOI] [PubMed] [Google Scholar]
- 6.Meyer P, Filippatos GS, Ahmed MI, Iskandrian AE, Bittner V, Perry GJ, et al. Effects of right ventricular ejection fraction on outcomes in chronic systolic heart failure. Circulation. 2010;121(2):252–258. doi: 10.1161/CIRCULATIONAHA.109.887570. [DOI] [PMC free article] [PubMed] [Google Scholar]
- 7.Sato T, Tsujino I, Ohira H, Oyama-Manabe N, Yamada A, Ito YM, et al. Validation Study on the Accuracy of Echocardiographic Measurements of Right Ventricular Systolic Function in Pulmonary Hypertension. Journal of the American Society of Echocardiography. 2012;25(3):280–286. doi: 10.1016/j.echo.2011.12.012. [DOI] [PubMed] [Google Scholar]
- 8.Kind T, Mauritz G-J, Marcus JT, Van de Veerdonk M, Westerhof N, Vonk-Noordegraaf A. Right ventricular ejection fraction is better reflected by transverse rather than longitudinal wall motion in pulmonary hypertension. J Cardiovasc Magn Reson. 2010;12:35. doi: 10.1186/1532-429X-12-35. [DOI] [PMC free article] [PubMed] [Google Scholar]
- 9.Galiè N, Hoeper MM, Humbert M, Torbicki A, Vachiery J-L, Barbera JA, et al. Guidelines for the Diagnosis and Treatment of Pulmonary Hypertension. Eur Respir J. 2009;34(6):1219–1263. doi: 10.1183/09031936.00139009. [DOI] [PubMed] [Google Scholar]
- 10.Lang RM, Bierig M, Devereux RB, Flachskampf FA, Foster E, Pellikka PA, et al. Recommendations for chamber quantification: a report from the American Society of Echocardiography’s Guidelines and Standards Committee and the Chamber Quantification Writing Group, developed in conjunction with the European Association of Echocardiography, a branch of the European Society of Cardiology. Journal of the American Society of Echocardiography. 2005;18(12):1440–1463. doi: 10.1016/j.echo.2005.10.005. [DOI] [PubMed] [Google Scholar]
- 11.Brili S, Stamatopoulos I, Misailidou M, Chrysohoou C, Tousoulis D, Tatsis I, et al. Longitudinal strain curves in the RV free wall differ in morphology in patients with pulmonary hypertension compared to controls. Int J Cardiol. 2012 doi: 10.1016/j.ijcard.2012.06.089. (Epub ahead of print) [DOI] [PubMed] [Google Scholar]
- 12.Schwartz DJ, Kop WJ, Park MH, Vesely MR, Li S, Mehra MR, et al. Evidence for early right ventricular and septal mechanical activation (interventricular dyssynchrony) in pulmonary hypertension. Am J Cardiol. 2008;102(9):1273–1277. doi: 10.1016/j.amjcard.2008.06.062. [DOI] [PubMed] [Google Scholar]
- 13.Samad BA, Alam M, Jensen-Urstad K. Prognostic impact of right ventricular involvement as assessed by tricuspid annular motion in patients with acute myocardial infarction. Am J Cardiol. 2002;90(7):778–781. doi: 10.1016/s0002-9149(02)02612-7. [DOI] [PubMed] [Google Scholar]
- 14.Rudski LG, Lai WW, Afilalo J, Hua L, Handschumacher MD, Chandrasekaran K, et al. Guidelines for the echocardiographic assessment of the right heart in adults: a report from the American Society of Echocardiography endorsed by the European Association of Echocardiography, a registered branch of the European Society of Cardiology, and the Canadian Society of Echocardiography. Journal of the American Society of Echocardiography. 2010;23(7):685–713. doi: 10.1016/j.echo.2010.05.010. [DOI] [PubMed] [Google Scholar]
- 15.Zoghbi WA, Enriquez-Sarano M, Foster E, Grayburn PA, Kraft CD, Levine RA, et al. Recommendations for evaluation of the severity of native valvular regurgitation with two-dimensional and Doppler echocardiography. Journal of the American Society of Echocardiography. 2003;16(7):777–802. doi: 10.1016/S0894-7317(03)00335-3. [DOI] [PubMed] [Google Scholar]
- 16.BIDMC CMR Quantitative Guidelines. Available at: http://radiology.cornfeld.org/CMR/CMR%20normal%20values.php.
- 17.Van de Veerdonk MC, Kind T, Marcus JT, Mauritz G-J, Heymans MW, Bogaard H-J, et al. Progressive right ventricular dysfunction in patients with pulmonary arterial hypertension responding to therapy. J Am Coll Cardiol. 2011;58(24):2511–2519. doi: 10.1016/j.jacc.2011.06.068. [DOI] [PubMed] [Google Scholar]
- 18.Punn R, Behzadian F, Tacy TA. Annular tilt as a screening test for right ventricular enlargement in patients with tetralogy of fallot. Journal of the American Society of Echocardiography. 2010;23(12):1297–1302. doi: 10.1016/j.echo.2010.09.002. [DOI] [PubMed] [Google Scholar]
- 19.Forfia PR, Vachiéry J-L. Echocardiography in pulmonary arterial hypertension. Am J Cardiol. 2012;110(6 Suppl):16S–24S. doi: 10.1016/j.amjcard.2012.06.012. [DOI] [PubMed] [Google Scholar]
- 20.Fichet J, Moreau L, Genée O, Legras A, Mercier E, Garot D, et al. Feasibility of right ventricular longitudinal systolic function evaluation with transthoracic echocardiographic indices derived from tricuspid annular motion: a preliminary study in acute respiratory distress syndrome. Echocardiography. 2012;29(5):513–521. doi: 10.1111/j.1540-8175.2011.01650.x. [DOI] [PubMed] [Google Scholar]
- 21.Ahmad H, Mor-Avi V, Lang RM, Nesser H-J, Weinert L, Tsang W, et al. Assessment of Right Ventricular Function Using Echocardiographic Speckle Tracking of the Tricuspid Annular Motion: Comparison with Cardiac Magnetic Resonance. Echocardiography. 2012;29(1):19–24. doi: 10.1111/j.1540-8175.2011.01519.x. [DOI] [PubMed] [Google Scholar]
- 22.Roberts JD, Forfia PR. Diagnosis and assessment of pulmonary vascular disease by Doppler echocardiography. Pulm Circ. 2011;1(2):160–181. doi: 10.4103/2045-8932.83446. [DOI] [PMC free article] [PubMed] [Google Scholar]
- 23.Van Wolferen SA, Marcus JT, Boonstra A, Marques KMJ, Bronzwaer JGF, Spreeuwenberg MD, et al. Prognostic value of right ventricular mass, volume, and function in idiopathic pulmonary arterial hypertension. Eur Heart J. 2007;28(10):1250–1257. doi: 10.1093/eurheartj/ehl477. [DOI] [PubMed] [Google Scholar]
- 24.Trip P, Kind T, Van de Veerdonk MC, Marcus JT, De Man FS, Westerhof N, et al. Accurate assessment of load-independent right ventricular systolic function in patients with pulmonary hypertension. J Heart Lung Transplant. 2013;32(1):50–55. doi: 10.1016/j.healun.2012.09.022. [DOI] [PubMed] [Google Scholar]
- 25.Van der Zwaan HB, Geleijnse ML, McGhie JS, Boersma E, Helbing WA, Meijboom FJ, et al. Right ventricular quantification in clinical practice: two-dimensional vs. three-dimensional echocardiography compared with cardiac magnetic resonance imaging. Eur J Echocardiogr. 2011;12(9):656–664. doi: 10.1093/ejechocard/jer107. [DOI] [PubMed] [Google Scholar]
- 26.De Castro S, Cavarretta E, Milan A, Caselli S, Di Angelantonio E, Vizza Carmine D, et al. Usefulness of tricuspid annular velocity in identifying global RV dysfunction in patients with primary pulmonary hypertension: a comparison with 3D echo-derived right ventricular ejection fraction. Echocardiography. 2008;25(3):289–293. doi: 10.1111/j.1540-8175.2007.00587.x. [DOI] [PubMed] [Google Scholar]
- 27.Angelini ED, Homma S, Pearson G, Holmes JW, Laine AF. Segmentation of real-time three-dimensional ultrasound for quantification of ventricular function: a clinical study on right and left ventricles. Ultrasound Med Biol. 2005;31(9):1143–1158. doi: 10.1016/j.ultrasmedbio.2005.03.016. [DOI] [PubMed] [Google Scholar]
- 28.Nesser HJ, Tkalec W, Patel AR, Masani ND, Niel J, Markt B, et al. Quantitation of right ventricular volumes and ejection fraction by three-dimensional echocardiography in patients: comparison with magnetic resonance imaging and radionuclide ventriculography. Echocardiography. 2006;23(8):666–680. doi: 10.1111/j.1540-8175.2006.00286.x. [DOI] [PubMed] [Google Scholar]
- 29.Rajaram S, Swift AJ, Capener D, Elliot CA, Condliffe R, Davies C, et al. Comparison of the diagnostic utility of cardiac magnetic resonance imaging, computed tomography, and echocardiography in assessment of suspected pulmonary arterial hypertension in patients with connective tissue disease. J Rheumatol. 2012;39(6):1265–1274. doi: 10.3899/jrheum.110987. [DOI] [PubMed] [Google Scholar]
- 30.Grapsa J, Gibbs JSR, Cabrita IZ, Watson GF, Pavlopoulos H, Dawson D, et al. The association of clinical outcome with right atrial and ventricular remodelling in patients with pulmonary arterial hypertension: study with real-time three-dimensional echocardiography. Eur Heart J Cardiovasc Imaging. 2012;13(8):666–672. doi: 10.1093/ehjci/jes003. [DOI] [PubMed] [Google Scholar]
- 31.Morikawa T, Murata M, Okuda S, Tsuruta H, Iwanaga S, Murata M, et al. Quantitative analysis of right ventricular function in patients with pulmonary hypertension using three-dimensional echocardiography and a two-dimensional summation method compared to magnetic resonance imaging. Am J Cardiol. 2011;107(3):484–489. doi: 10.1016/j.amjcard.2010.09.047. [DOI] [PubMed] [Google Scholar]