

Abstract
The mitochondrial calcium uniporter (MCU) is responsible for mitochondrial calcium uptake and homeostasis. It is also a target for the regulation of cellular anti‐/pro‐apoptosis and necrosis by several oncogenes and tumour suppressors. Herein, we report the crystal structure of the MCU N‐terminal domain (NTD) at a resolution of 1.50 Å in a novel fold and the S92A MCU mutant at 2.75 Å resolution; the residue S92 is a predicted CaMKII phosphorylation site. The assembly of the mitochondrial calcium uniporter complex (uniplex) and the interaction with the MCU regulators such as the mitochondrial calcium uptake‐1 and mitochondrial calcium uptake‐2 proteins (MICU1 and MICU2) are not affected by the deletion of MCU NTD. However, the expression of the S92A mutant or a NTD deletion mutant failed to restore mitochondrial Ca2+ uptake in a stable MCU knockdown HeLa cell line and exerted dominant‐negative effects in the wild‐type MCU‐expressing cell line. These results suggest that the NTD of MCU is essential for the modulation of MCU function, although it does not affect the uniplex formation.
Keywords: crystal structure, MCU, MCU domain‐like fold, mitochondrial calcium uptake, uniplex
Subject Categories: Membrane & Intracellular Transport, Structural Biology
Introduction
Energized mitochondria take up large quantities of Ca2+ through the putative tetrameric mitochondrial calcium uniporter (MCU) with a highly selective channel driven by a large electrochemical potential across the inner mitochondrial membrane (IMM) 1, 2. MCU is associated with many regulatory proteins such as mitochondrial calcium uptake‐1 and mitochondrial calcium uptake‐2 (MICU1 and MICU2), an MCU paralog (MCUb), and essential MCU regulator (EMRE), forming the mitochondrial calcium uniporter complex (uniplex) 3, 4, 5, 6, 7. MICU1 and MICU2 contain two conserved EF‐hand Ca2+‐binding domains that regulate the activity of MCU 3, 4. EMRE is a single‐pass membrane protein with a highly conserved aspartate‐rich tail and is required for interaction between MCU and MICU1/MICU2 8. Evidence also exists for a possible interaction between MCU and MCUR1. Overexpression of MCUR1 in HeLa cells increases mitochondrial Ca2+ uptake, while its knockdown suppresses it 9. Moreover, MCUR1 has recently been reported as a regulator for cytochrome c oxidase assembly 10.
MCU consists of two conserved transmembrane helices (TMs) connected by a 9‐aa linker with a four‐residue “DIME” motif flanked by an N‐terminal domain (NTD) and C‐terminal domain located within the mitochondrial matrix 11, 12, 13. Computational modelling as well as biochemical experiments suggests that MCU tetramerization forms a highly Ca2+‐selective eight TM channel inside the IMM 5, 11, 12. The two negatively charged residues “D” and “E” in the “DIME” motif are essential for MCU function, presumably providing Ca2+‐binding site(s) 11, 12.
Balanced mitochondrial [Ca2+] is critical for the regulation of mitochondrial functions such as fission–fusion and ATP production 14. Uncontrolled mitochondrial Ca2+ overload caused by oncogenes and tumour suppressors can lead to the opening of the mitochondrial permeability transition pore (mPTP) with disruption of mitochondrial membrane potential 15. Excess Ca2+ entry in mitochondria has been associated with apoptosis and necrosis in many pathological states 16.
Overexpression or silencing of MCU causes muscular diseases 17. Furthermore, knockdown of MCU results in energetic and developmental defects in Trypanosoma brucei 18 and zebrafish 19. MCU knockdown can also cause embryonic lethality in a pure C57/BL/6 inbred mouse strain 20, although mild phenotypic changes have been reported in MCU knockout mouse models 21, 22.
More research is needed to know the structural basis for the diverse functions of MCU. In this study, we present the crystal structures of MCU NTD in a novel fold. Our biochemical and functional characterization indicated that MCU NTD is essential for MCU activity, and NTD deletion or S92A mutation impair the function of MCU.
Results
Overall structure of MCU NTD and NTD‐E
To elucidate the structural basis for MCU functions, we designed a set of human MCU truncation experiments for crystallographic and biochemical studies. We determined the first structure, at a 1.80 Å resolution, of the highly conserved NTD of MCU, corresponding to residues 75–165, encoded by exons 3 and 4, fused with the bacteriophage T4 lysozyme at the N‐terminal end of the MCU NTD (Figs 1 and EV1A, Appendix Fig S1, Table 1). The T4 lysozyme fusion was used to enhance solubility and to phase a new crystal structure using molecular replacement. We also determined the structure of an extended version of the MCU NTD (MCU NTD‐E), corresponding to residues 75–185, without the T4 lysozyme fusion at a 1.50 Å resolution (Figs 1 and EV1B, Table 1). The structure of MCU NTD‐E was determined by molecular replacement using the MCU NTD structure as a template.
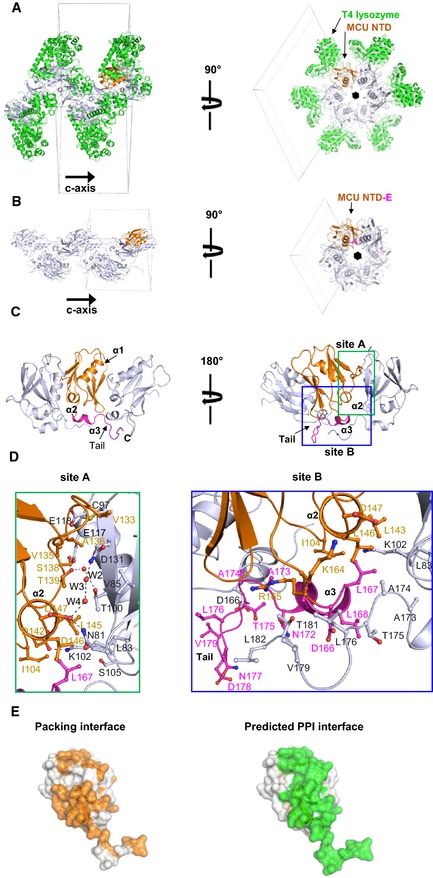
Figure 1. Overall structure of MCU NTD .
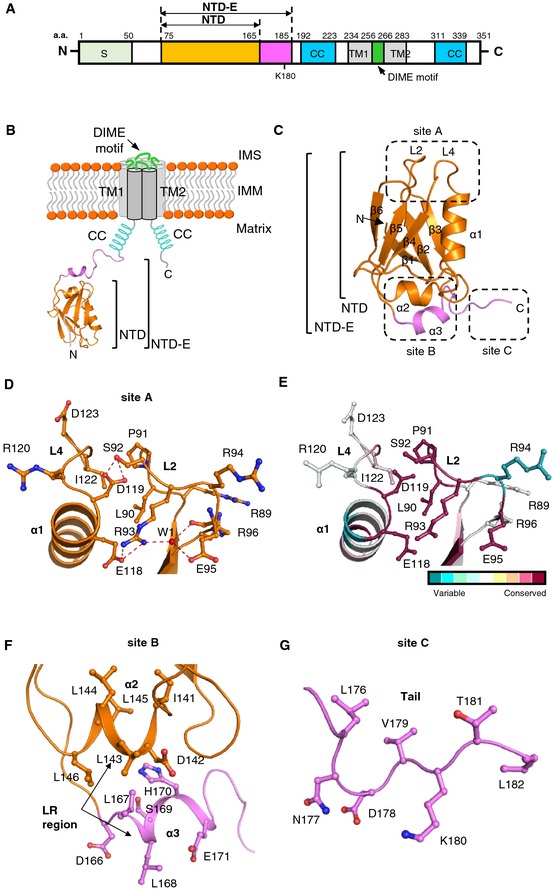
- Topology diagram of MCU in the IMM. Crystal structure of MCU NTD (orange) and MCU NTD‐E (20‐a.a. extension in magenta) is shown.
- Overall structure of MCU NTD and MCU NTD‐E. MCU NTD is composed of two helices (α1 and α2), six β‐strands (β1–β6), and two conserved loops (L2 and L4). MCU NTD‐E has an additional α‐helix (α3) and C‐terminal tail (magenta).
- Top view of L2 and L4 loops (site A in C), showing the hydrogen bonding and hydrophobic interaction. Residues are shown in stick, one water molecule (W1) as red dots. Dashed lines (red) denote hydrogen bonds. The putative phosphorylation site, S92, is described in stick in the L2 loop.
- Highly conserved L2 and L4 loops in MCU NTD by ConSurf analysis 61. Residues represented in the L2 and L4 loops are coloured according to conservation analysis by ConSurf, using 250 MCU NTD homologues selected from the UniRef90 database.
- C‐terminal hydrophobic helical regions (α2 and α3; site B in C). α2‐ and α3‐helices of the leucine‐rich (LR) region are shown in orange and magenta, respectively.
- Tail region (site C in C), showing the ubiquitination or biotinylation site K180 within MCU NTD‐E.
Figure EV1. Detailed structure of MCU NTD .
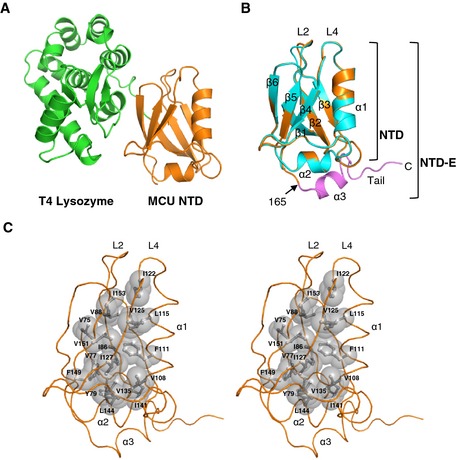
- Structure of MCU NTD fused with T4 lysozyme at its N‐terminus. MCU NTD is shown in orange, while bacteriophage T4 lysozyme is represented in green.
- Superposition of the MCU NTD and MCU NTD‐E structures. Superposition of the two structures revealed a root mean square deviation (RMSD) of 0.29 Å for 90 Cα atoms. Two MCU NTDs are shown in cyan for T4 lysozyme‐MCU NTD and in orange for MCU NTD‐E. Extended C‐terminal residues in MCU NTD‐E comprising residues 166–182 are shown in magenta.
- Stereoview of the hydrophobic interior of MCU NTD‐E. The hydrophobic residues are shown as a grey surface.
Table 1.
Data collection and refinement statistics
| T4 lysozyme‐MCU NTD | T4 lysozyme‐MCU NTD S92A | MCU NTD‐E | |
|---|---|---|---|
| PDB ID: 4XSJ | PDB ID: 5BZ6 | PDB ID: 4XTB | |
| Data collection | |||
| Space groupa | P65 | P65 | P65 |
| X‐ray sourceb and detector | PAL‐5C ADSC Q315r | PAL‐5C ADSC Q315r | PAL‐7A ADSC Q270 |
| Wavelength (Å) | 0.9795 | 0.9795 | 0.9793 |
| Unit cell: a, b, c (Å) | 98.1, 98.1, 62.4 | 97.8, 97.8, 61.5 | 55.5, 55.5, 68.9 |
| α, β, γ (°) | 90.0, 90.0, 120.0 | 90.0, 90.0, 120.0 | 90.0, 90.0, 120.0 |
| Resolution range (Å)c | 50–1.80 (1.83–1.80) | 50–2.75 (2.80–2.75) | 50−1.50 (1.53−1.50) |
| R merge d | 6.8 (54.6) | 12.3 (56.3) | 4.7 (51.5) |
| I/σI | 18.2 (3.2) | 6.8 (3.3) | 11.9 (3.6) |
| Completeness (%) | 99.5 (98.3) | 99.5 (100.0) | 99.4 (100.0) |
| Redundancy | 8.0 (6.3) | 4.7 (5.3) | 5.7 (5.6) |
| Refinement | |||
| Resolution range (Å)c | 48.5–1.80 | 34.9–2.75 | 48.0–1.50 |
| No. reflections | 29581 | 8147 | 17594 |
| R work e (%)/R free (%) | 12.7/19.0 | 16.4/23.5 | 14.0/17.6 |
| No. atoms | |||
| Protein | 2008 | 2007 | 863 |
| Ligand | − | − | 13f |
| Ion () | 15 | 30 | − |
| Water | 431 | 41 | 143 |
| B‐factors (Å2) | |||
| Protein | 27.0 | 33.7 | 18.2 |
| Ligand | − | − | 30.3 |
| Ion () | 40.6 | 56.7 | − |
| Water | 47.4 | 29.9 | 39.5 |
| Model statistics | |||
| rmsd bond length (Å) | 0.010 | 0.014 | 0.010 |
| rmsd bond angles (°) | 1.33 | 1.67 | 1.64 |
| Ramachandran plot (%) favoured/allowed/disallowed | 98.8/1.2/0 | 97.2/2.8/0 | 99.1/0.9/0 |
P65‐related MCU NTD/MCU NTD interactions are conserved in these three P65 crystal forms.
Beamline 5C and 7A at Pohang Accelerator Laboratory (PAL) in South Korea.
Values in parentheses are for highest‐resolution shell.
R merge = ∑h ∑i │I(h)i−‹I(h)›│/∑h ∑iI(h)i, where I(h) is the intensity of reflection of h, ∑h is the sum over all reflections and ∑i is the sum over i measurements of reflection h.
R work = ∑hkl ¦¦Fo¦‐¦Fc¦¦/∑hkl¦Fo¦; 5% of the reflections were excluded for the R free calculation.
An unidentified electron density was observed and modeled with a tetraethylene glycol molecule.
The structure of MCU NTD consists of one α‐helix and six β‐strands (Fig 1C) that form a central core, two highly conserved loops (L2 and L4) (Fig 1D and E) and one leucine‐rich short α‐helix (α2) (Fig 1F). Hydrophobic residues in the α2‐helix (140GIDLLL145) stabilize the hydrophobic interior of MCU NTD through interactions among V108, I127 and F149 (Fig EV1C). MCU NTD‐E has an additional α‐helix (α3) and a C‐terminal tail (Fig 1C, F and G). The L2 and L4 loops are stabilized by hydrogen bonds and hydrophobic interaction formed by highly conserved L90, S92, R93, E95, E118, D119, I122 and one water molecule (W1) (Fig 1D and E). S92 located in the L2 loop forms a hydrogen bond with D119 located in L4 loop, stabilizing the local structure in these loops (Fig 1D). S92 is predicted as a potential CaMKII phosphorylation site 23, and we could expect that S92 phosphorylation induces conformational changes by breaking the hydrogen bonds in these loops and modulates MCU function 23, 24. The C‐terminal tail in MCU NTD‐E forms an extended coil structure and contains K180, a known ubiquitination and biotinylation site (Fig 1G) 25, 26. We hypothesize that ubiquitination of K180, which is located close to the MCU NTD core, is involved not only in ubiquitin‐dependent proteasomal degradation, but also in the regulation of MCU function by inducing structural changes in MCU.
Of interest, we observed an unidentified electron density, which is predicted as a linear lipid‐like molecule with 13–16 carbon atoms and modelled with a tetraethylene glycol molecule (Appendix Fig S2). The lipid‐like molecule interacts with the residues in the L1 loop, two helices (α2 and α3) and C‐terminus tail (Appendix Fig S2B).
Identification of MCU domain‐like fold
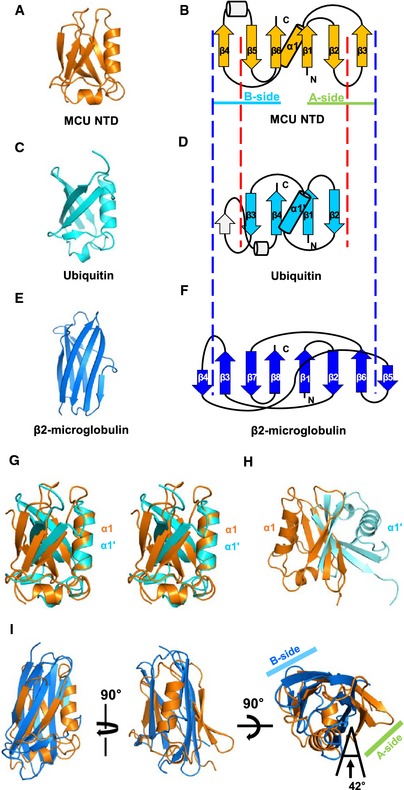
We identified MCU NTD as a novel fold and named it “MCU domain‐like fold” superfamily based on the analysis of the Structural Classification of Proteins 2 (SCOP2) 27 (Fig 2). In a search for structures similar to MCU NTD using the Dali program 28 and CATH database 29, the ubiquitin‐like (Ub) β‐grasp fold (β‐GF) ranked the highest in the Dali search (Z‐score > 5.3) (Appendix Table S1), whereas the immunoglobulin (Ig)‐like fold was the highest rank in the CATH database (SSAP score > 70) (Appendix Table S2). However, MCU NTD fold is different from β‐GF and Ig‐like fold. The MCU NTD core domain contains six β‐strands and one α‐helix in the following order: β4‐β5‐β6‐α1‐β1‐β2‐β3, in which each of the three β‐strands forms two β‐sheets (A‐ and B‐sides) (Fig 2A and B). In contrast, the Ub core domain contains four β‐strands and one α‐helix in the following order: β3‐β4‐α1‐β1‐β2 (Fig 2C and D). The connection between β1‐β2‐α1 is highly conserved in all β‐GFs 30. However, in MCU NTD, β3 is inserted between β2 and α1, and one additional β‐strand is inserted after α1 (Fig 2B). Although the two domains could be superposed with an RMSD of 2.73 Å based on their α1 and α1ʹ‐helices (Fig 2G), the directionality of the β‐strands is different. Furthermore, when the domains were superposed based on the four β‐strands, the α1‐ and α1ʹ‐helices of MCU NTD and Ub, respectively, are located in the opposite side (Fig 2H). On the other hand, the β2‐macroglobulin core domain, one of Ig‐like fold, consists of a 7‐ to 9‐strand sandwich structure, including a Greek‐key motif 31 (Fig 2E and F). Although the MCU NTD and β2‐macroglobulin could be superposed with an RMSD of 4.9 Å, the orientation of the two β‐sheets in the A‐side is rotated by 42 degrees (Fig 2I).
Figure 2. Topology comparison of MCU NTD, ubiquitin‐like β‐GF and immunoglobulin‐like fold.
-
A–FRibbon diagrams of MCU NTD (A), ubiquitin‐like β‐GF (Ub) (PDB code 1UBQ) (C) and Ig‐like fold (β2‐microglobulin were selected for comparison, chain F of PDB code 1IM3) (E). Topology diagrams of MCU NTD (B), Ub (D) and β2‐macroglobulin (F). β‐strands are represented by arrows, α‐helices by cylinders and loops by lines. Each of the three β‐strands of MCU NTD forms two β‐sheets (A‐ and B‐sides).
-
GStereo view of the superposition of MCU NTD (orange) and Ub (cyan) based on α1‐ and α1ʹ‐helices.
-
HSuperposition of MCU NTD (orange) and Ub (cyan) based on the four β‐strands (red dashed lines) aligned between (B) and (D).
-
ISuperposition of MCU NTD (orange) and β2‐microglobulin (blue) based on the central six β‐strands (blue dashed lines) aligned between (B) and (F).
Potential protein–protein interaction interfaces of MCU NTD and NTD‐E
In the structure of MCU NTD‐E, hydrophobic residues in the α2‐helix (L143, L144 and L146) together with L167 and L168 in the α3‐helix (166DLLSHENA173) form a hydrophobic surface surrounded by hydrophilic residues (namely D142, D166 and E171) (Fig 1F). This surface and C‐terminus tail (174ATLNNVKTL182) were predicted as potential protein–protein interaction (PPI) interfaces by the InterProSurf analysis 32 (Fig EV2A and C) and the consensus Protein–Protein Interaction Site Predictor (cons‐PPISP) server 33 (Fig EV2B and C). In the crystals of T4 lysozyme‐MCU NTD and MCU NTD‐E, MCU NTDs form helical oligomers around the 65 screw axis in a similar manner (Fig EV3A and B). In the crystal of MCU NTD‐E, oligomers are stabilized by additional interactions through an extended C‐terminal tail in a manner resembling domain swapping (Fig EV3B–D), and the interface in MCU NTD and the C‐terminal tail between subunits in the oligomer is consistent with the predicted PPI surface (Fig EV3E).
Figure EV2. Prediction of the surface involved in protein–protein interaction (PPI).
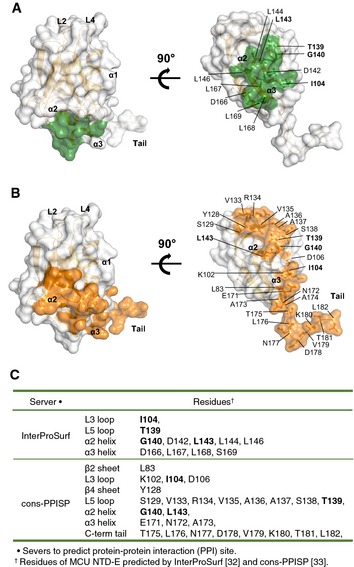
- The potential PPI interface is shown as a green surface, as predicted by the InterProSurf server 32. The residues listed by the InterProSurf analysis show ˜70% accuracy for the prediction of the PPI interface, based on the accessible surface area (ASA). Each cluster of selected surface residues was ranked according to its scoring function.
- The potential PPI interface is shown as an orange surface, as predicted by the consensus Protein–Protein Interaction Site Predictor (cons‐PPISP) server 33. The residues listed by cons‐PPISP analysis show 80% accuracy with 51% coverage through sequence profiles and solvent accessibility.
- List of residues shown in (A, B).
Figure EV3. T4 lysozyme‐MCU NTD and MCU NTD‐E crystallographic packing.
-
A, BOligomers in crystal lattice of T4 lysozyme‐MCU NTD (A) and MCU NTD‐E (B). MCU NTDs form helical oligomers around the 65 screw axis in a similar manner. Continuous domain swapping by C‐terminal tail forms oligomer along c‐axis in the crystal lattice of MCU NTD‐E (B).
-
CRibbon diagram of MCU NTD‐E oligomer in the crystal. A protomer (in orange) interacts with adjacent molecules through MCU NTD and C‐terminus tail.
-
DZoomed‐in view of the interfaces.
-
ECrystal packing and PPI interfaces. Interface involved in the crystal packing matches with predicted PPI surface (InterProSurf and cons‐PPISP) (Fig EV2).
We also identified MCU NTD‐Es oligomerized in solution by glutaraldehyde cross‐linking assay in phosphate‐buffered saline (PBS) and crystallization conditions (Appendix Fig S3). Thus, the results suggest that MCU NTD is involved in the oligomerization and interactions with the uniplex, although MCU NTD is not essential for the formation of the uniporter complex (see below).
Overexpression of MCUΔNTD exerts a dominant‐negative function without alteration of the uniplex assembly
MCU forms homo‐oligomers as well as hetero‐oligomers (with MCUb) 5 and interacts with various regulatory proteins, including MICU1 and MICU2, in the intermembrane space forming a uniplex 8, 34, 35. To investigate the functional role of the MCU NTD, we deleted this domain by generating an MCU mutant lacking residues 75–165 (MCUΔNTD). Subcellular localization of MCUΔNTD within the mitochondria was confirmed by co‐expressing C‐terminally GFP‐tagged MCUΔNTD and DsRed‐Mito (Fig EV4C). Expression of MCUΔNTD did not affect the endogenous expression of MCU or that of the regulatory proteins (Fig EV4A, B and D).
Figure EV4. Expression of MCUWT and MCU mutants in HeLa cells.
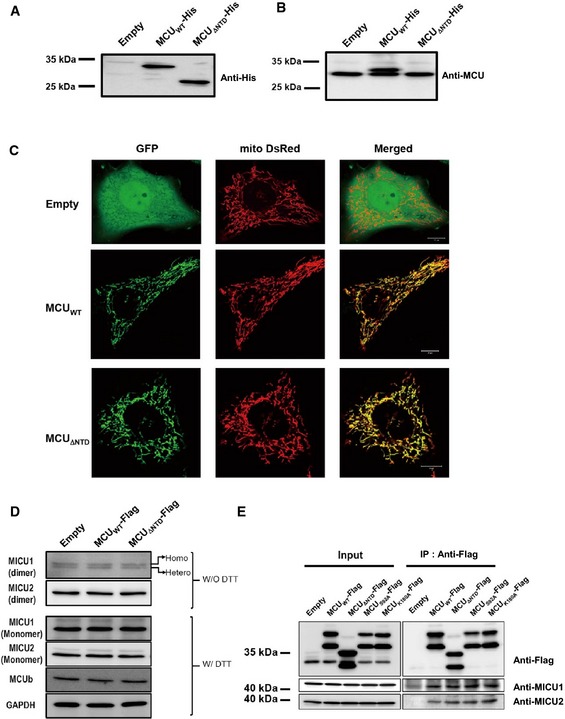
-
A, BHis‐tagged MCUWT and MCU Δ NTD were expressed in HeLa cells, and the expression of the proteins was detected with anti‐His (A) and anti‐MCU (B) antibodies, respectively.
-
CLocalization of MCUWT and MCU Δ NTD was examined by confocal imaging after co‐transfection of GFP‐tagged MCUWT or MCU Δ NTD with mito‐DsRed. The merged images indicated that MCU Δ NTD is localized in the mitochondria, similar to MCUWT. Scale bars, 10 ?m.
-
DExpression profiles of MCU regulatory proteins. Twenty micrograms of the lysates with or without dithiothreitol (DTT) were subjected to SDS–PAGE and immunoblotted using the indicated antibodies. The results revealed that the expression levels of the indicated proteins did not change in MCU Δ NTD‐overexpressing HeLa cells.
-
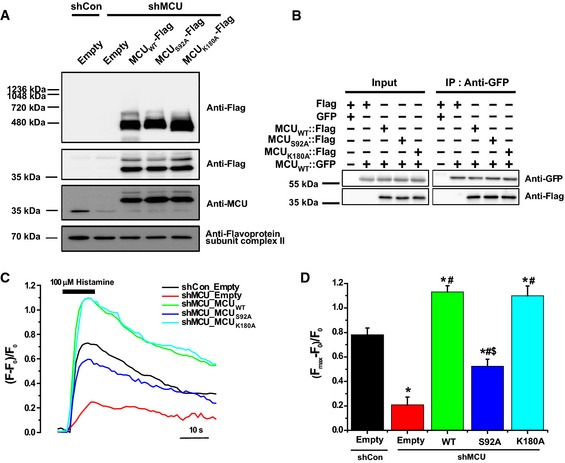
EInteraction of MCU mutants with MICU1 and 2. MCU Δ NTD, MCUS 92A and MCUK 180A with MICU1 and MICU2 bind to MICU1 and MICU2 as MCUWT does. After expression of Flag‐tagged MCUWT, MCU Δ NTD, MCUS 92A and MCUK 180A in MCU‐KD HeLa cells, co‐immunoprecipitation assay was performed. The precipitates were subjected to SDS–PAGE and immunoblotted with the indicated antibodies.
To examine the structural effect of MCU NTD deletion, we performed circular dichroism (CD) analysis for MCUΔNTD (Appendix Fig S4A). The CD spectrum of MCUΔNTD showed that the canonical α‐helical pattern and the α‐helical content were well matched with the predicted values, which were approximately 66 and 61%, respectively (Appendix Fig S4A and B), suggesting that MCUΔNTD is properly folded.
To determine whether MCU NTD is involved in the assembly of MCU‐containing uniplex, we performed a co‐immunoprecipitation assay and blue native polyacrylamide gel electrophoresis (BN–PAGE). As shown in Fig 3A and B, both MCUWT and MCUΔNTD expressed in HeLa cells were co‐precipitated with MCUΔNTD, suggesting that MCU NTD is not essential for MCU oligomerization (Appendix Fig S5A and B). In addition, co‐immunoprecipitation assays using Flag‐tagged MCUWT and MCUΔNTD showed that MCUΔNTD binds both MICU1 and MICU2 as MCUWT does (Fig EV4E and Appendix Fig S5C). BN–PAGE using digitonin‐solubilized mitochondria isolated from wild‐type and MCU knockdown (MCU‐KD) HeLa cells overexpressing Flag‐tagged MCUΔNTD showed that MCUΔNTD migrates at an apparent molecular weight of 440 kDa (Figs 3C and 4A and B, Appendix Fig S5D). Since it has been reported that uniplex migrates at an apparent molecular weight of approximately 480 kDa in BN–PAGE 8, the shift of MCUΔNTD complex correlates well with the size of the MCU NTD deletion, suggesting that the deletion did not alter the assembly of the MCU‐containing uniplex.
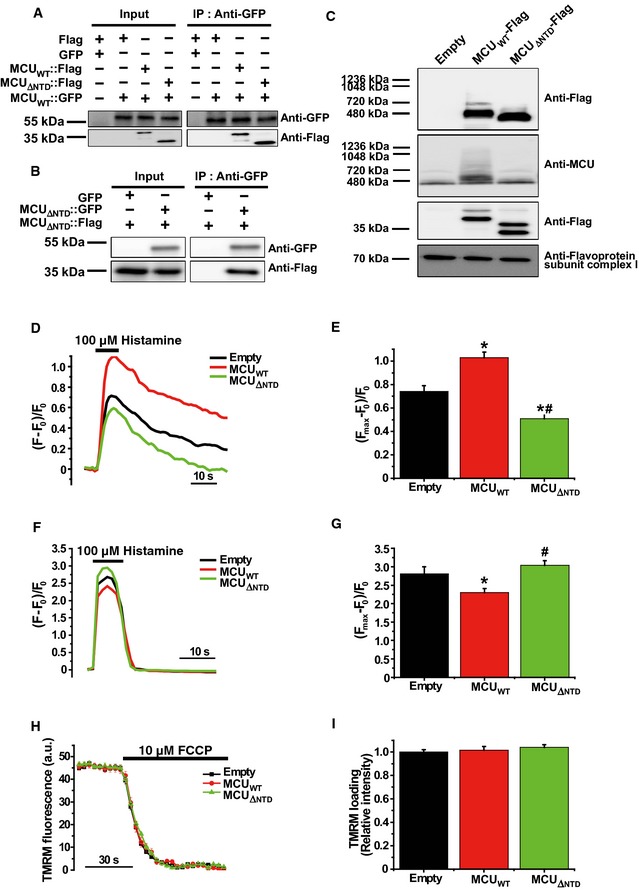
Figure 3. MCU Δ NTD overexpression has a dominant‐negative effect on mitochondrial Ca2+ uptake.
-
ACo‐immunoprecipitation of MCUWT‐Flag or MCU Δ NTD‐Flag with MCUWT‐GFP. HeLa cells were transiently co‐transfected with MCUWT‐GFP and MCUWT‐Flag/MCU Δ NTD‐Flag. MCU Δ NTD migrated farther than MCUWT, indicating an apparent molecular weight difference of 9 kDa in SDS–PAGE (see also Fig EV4A). MCUWT‐GFP with MCUWT‐Flag or MCU Δ NTD‐Flag was precipitated from the cell lysates with an anti‐GFP antibody. The precipitates were separated on SDS–PAGE and immunoblotted with the antibodies indicated.
-
BCo‐immunoprecipitation of MCU Δ NTD‐Flag with MCU Δ NTD‐GFP. HeLa cells were transiently co‐transfected with MCU Δ NTD‐Flag and MCU Δ NTD‐GFP. MCU Δ NTD‐GFP with MCU Δ NTD‐Flag was precipitated from cell lysates with an anti‐GFP antibody. The precipitates were separated on SDS–PAGE and immunoblotted with the indicated antibodies.
-
CHeLa cells were transiently transfected with MCUWT‐Flag or MCU Δ NTD‐Flag. After isolation and solubilization of crude mitochondria, the lysates were subjected to BN–PAGE and immunoblotted with anti‐Flag and anti‐MCU antibodies to detect ectopic MCUWT‐Flag, MCU Δ NTD‐Flag and endogenous MCU. MCUWT and MCU Δ NTD were detected at apparent molecular weights of 480 and 440 kDa, respectively. The shift shown in MCU Δ NTD complex correlated with the difference in molecular weight, if it is assumed to be a tetramer. Flavoprotein subunit of complex I is used as a loading control for each mitochondrial fraction.
-
D–GSimultaneous measurements of mitochondrial (D, E) and cytosolic (F, G) Ca2+ transients evoked by 100 μM histamine in HeLa cells overexpressing MCUWT or MCU Δ NTD. F0 is initial fluorescence intensity. F and Fmax indicate fluorescence intensity at each time point and maximal fluorescence intensity after the stimulation, respectively. (Fmax–F0)/F0 indicates the maximal Ca2+ concentration evoked by the stimulation (mean ± SEM, n = 12, *P < 0.05 versus empty vector‐transfected cells. # P < 0.05 versus MCUWT vector‐transfected cells). Unpaired two‐sided Student's t‐test was used to calculate statistical significance.
-
H, IThe mitochondrial membrane potential was monitored based on TMRM fluorescence intensity. After loading of TMRM, FCCP (carbonyl cyanide p‐trifluoro‐methoxyphenylhydrazone), an uncoupler of oxidation phosphorylation, was rapidly applied to disrupt the mitochondrial membrane potential established by the respiratory chain (ΔΨ). Fluorescence intensities of each group were recorded at each time point using a LSM 700 confocal laser‐scanning microscope. The value of TMRM loading (relative intensity) was calculated by dividing each fluorescence intensity of TMRM measured with MCUWT or MCU Δ NTD vector by that of TMRM measured with empty vector (mean ± SEM, n = 7).
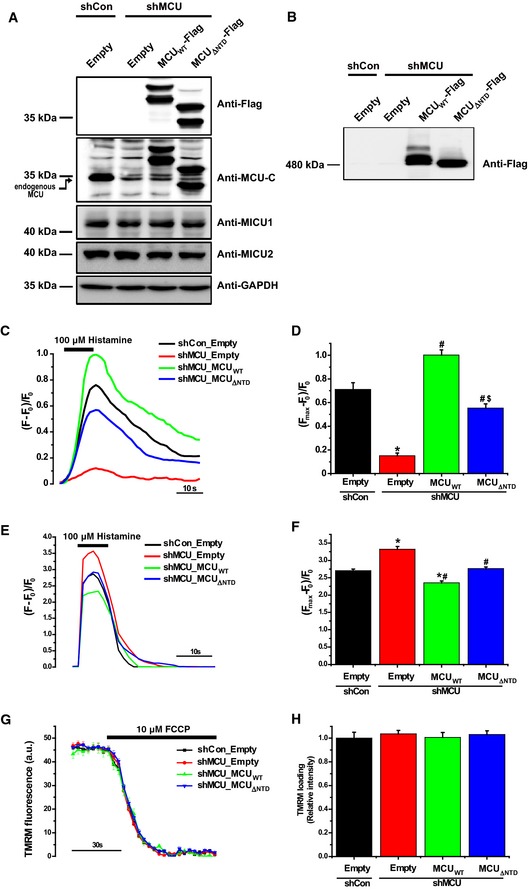
Figure 4. MCU Δ NTD expression in stable MCU‐KD HeLa cells does not fully restore mitochondrial Ca2+ uptake.
-
AExpression of MCUWT‐Flag and MCU Δ NTD‐Flag in stable MCU‐KD HeLa cells. Twenty micrograms of each sample were subjected to SDS–PAGE and detected with the indicated antibodies. Anti‐MCU‐C antibody was raised against a synthetic peptide (residues, 328–351) of MCU and detected both MCUWT and MCU Δ NTD , while commercially available MCU antibody (Sigma) was not able to detect MCU Δ NTD , because its epitope is the residues 47–152.
-
BThe solubilized mitochondrial fraction from each sample was subjected to BN–PAGE and immunoblotted with anti‐Flag antibody.
-
C–FMitochondrial (C, D) and cytosolic (E, F) Ca2+ transients evoked by 100 μM histamine were quantified by measuring the peak amplitudes of the traces, simultaneously. F0 is initial fluorescence intensity. F and Fmax indicate fluorescence intensity at each time point and maximal fluorescence intensity after stimulation, respectively. (Fmax–F0)/F0 indicates the maximal Ca2+ concentration evoked by stimulation (mean ± SEM, n = 12–18, *P < 0.05 versus control shRNA‐expressing cells. # P < 0.05 versus stable MCU‐KD cells. § P < 0.05 versus MCUWT‐rescued stable MCU‐KD cells). Unpaired two‐sided Student's t‐test was used to calculate statistical significance.
-
G, HThe mitochondrial membrane potential was monitored based on TMRM fluorescence intensity. After loading of TMRM, FCCP was rapidly applied to disrupt the mitochondrial membrane potential established by ΔΨ. Fluorescence intensities of each group were recorded at each time point using a LSM 700 confocal laser‐scanning microscope. The value of TMRM loading (relative intensity) was calculated by dividing each fluorescence intensity of TMRM measured with MCUWT or MCU Δ NTD vector by that of TMRM measured with empty vector (mean ± SEM, n = 8).
We next investigated whether the deletion of MCU NTD from MCU affects mitochondrial Ca2+ uptake in intact cells. To monitor both cytosolic and mitochondrial [Ca2+] simultaneously, we used genetically encoded Ca2+ indicators that we modified from the previously developed genetically encoded Ca2+ indicators for optical imaging (GECOs) such that they specifically targeted mitochondria 36. After confirming the expression of both the mitochondria‐targeting green‐GECO (mito‐GGECO) and red‐GECO (RGECO) in HeLa cell mitochondria and cytosol, we monitored the changes of fluorescence intensity induced by simultaneous stimulation of the two compartments (Appendix Fig S6). Consistent with an earlier report 12, MCU overexpression reduced the amplitude of the cytosolic [Ca2+] peak evoked by 100 μM histamine (Fig 3F and G), while enhancing mitochondrial Ca2+ uptake (Fig 3D and E). However, when we overexpressed MCUΔNTD, not only was the increase of mitochondrial Ca2+ uptake in MCUWT‐overexpressing HeLa cells abrogated, but mitochondrial Ca2+ uptake was also reduced relative to the control experiment (Fig 3D and E). In addition, the cytosolic [Ca2+] peak was enhanced in the MCUΔNTD‐overexpressing cells relative to MCUWT, possibly due to reduced mitochondrial Ca2+ buffering (Fig 3F and G). To examine the possibility that an overexpression of MCUΔNTD affects the driving force for Ca2+ uptake, the mitochondrial membrane potential was investigated using tetramethylrhodamine methyl ester (TMRM). The results showed that TMRM loading was unaffected by MCUΔNTD overexpression (Fig 3H and I). These data suggested that MCUΔNTD exerts a dominant‐negative effect on mitochondrial Ca2+ uptake after incorporation into some uniplexes.
Rescue of MCUΔNTD in stable MCU‐KD cells could not fully restore mitochondrial Ca2+ uptake
To determine whether MCUΔNTD is intrinsically Ca2+ impermeable or presents a reduced channel activity, we performed a rescue experiment after generation of stable MCU‐KD HeLa cells through transduction of a lentiviral vector carrying short hairpin RNA (shRNA) specifically targeting MCU. Consistent with the previous results (Fig 3F and G), cytosolic [Ca2+] peak was increased in MCU‐KD HeLa cells (Fig 4E and F). When we monitored the changes in mitochondrial [Ca2+] in HeLa cells, MCU‐KD abrogated histamine‐evoked mitochondrial Ca2+ uptake, but the expression of control shRNA (shCon) did not (Fig 4A, C and D). Expression of MCUWT with nine silent point mutations in the shRNA target sequence that did not affect the amino acid sequence restored stimulation‐induced mitochondrial Ca2+ uptake in stable MCU‐KD HeLa cells (Fig 4A, C and D). Although MCUΔNTD expression also led to mitochondrial Ca2+ uptake, the amplitude of the response was only about half of that observed with MCUWT without alteration of driving force (Ψ) (Fig 4G and H), suggesting that MCUΔNTD may still function as a Ca2+ channel, but Ca2+ influx was lower than that of MCUWT.
MCU S92A mutation reduces mitochondrial Ca2+ uptake
Several post‐translational modifications in MCU NTD have been reported including a putative phosphorylation site for CaMKII on S92 and a biotinylation site on K180 23, 26. In order to investigate whether the post‐translational modifications at S92 and K180 are crucial for MCU‐mediated mitochondrial Ca2+ uptake, we generated MCUS92A and MCUK180A mutants. Then, we monitored mitochondrial Ca2+ uptake in MCUS92A‐ or MCUK180A‐rescued MCU‐KD HeLa cells. The results showed that mitochondrial Ca2+ uptake was only impaired in MCUS92A‐rescued cells, but not changed in MCUK180A‐rescued cells (Fig 5C and D).
Figure 5. Substitution of Ser92 to Ala in MCU NTD reduced mitochondrial Ca2+ uptake activity.
-
AExpression of MCUWT‐Flag, MCUS 92A‐Flag and MCUK 180A‐Flag in stable MCU‐KD HeLa cells. The solubilized mitochondrial fraction from each sample was subjected to BN–PAGE and immunoblotted with anti‐Flag antibody. The lysates of each sample were subjected to SDS–PAGE and detected with the indicated antibodies. Flavoprotein subunit of complex I is used as a loading control of each mitochondrial fraction.
-
BInteraction of MCU mutants with MCUWT was not altered. After co‐expression of MCUWT and MCU mutants, co‐immunoprecipitation was performed. The precipitates were separated by SDS–PAGE and immunoblotted with the indicated antibodies.
-
C, DMitochondrial Ca2+ uptakes evoked by 100 μM histamine were quantified by measuring the peak amplitudes of the traces. F0 is initial fluorescence intensity. F and Fmax indicate fluorescence intensity at each time point and maximal fluorescence intensity after the stimulation, respectively. (Fmax–F0)/F0 indicates the maximal Ca2+ concentration evoked by the stimulation (mean ± SEM, n = 13–15, *P < 0.05 versus control shRNA‐expressing cells. # P < 0.05 versus stable MCU‐KD cells. § P < 0.05 versus MCUWT‐rescued stable MCU‐KD cells). Unpaired two‐sided Student's t‐test was used to calculate statistical significance.
To examine the structural effect of these mutations, we performed CD analysis using MCU NTD‐E S92A and K180A constructs (Appendix Fig S4C). We identified no changes in secondary structure contents, suggesting that S92A and K180A mutants are properly folded. In addition, BN–PAGE showed that both mutants had the same apparent molecular weight of 480 kDa as WT had (Fig 5A). Furthermore, co‐immunoprecipitation assays showed that MCU mutants are co‐precipitated with MCUWT (Fig 5B) and there were no defects in binding with both MICU1 and MICU2 as MCUWT does (Fig EV4E). These results suggest that MCUS92A and MCUK180A do not alter MCU folding, oligomerization and assembly of MCU‐containing uniplex. Taken together, S92 and K180 residues are not involved in uniplex formation, but among them only the S92 residue is crucial for mitochondrial Ca2+ uptake activity.
Crystal structure of NTDS92A suggests a conformational change in the mutant
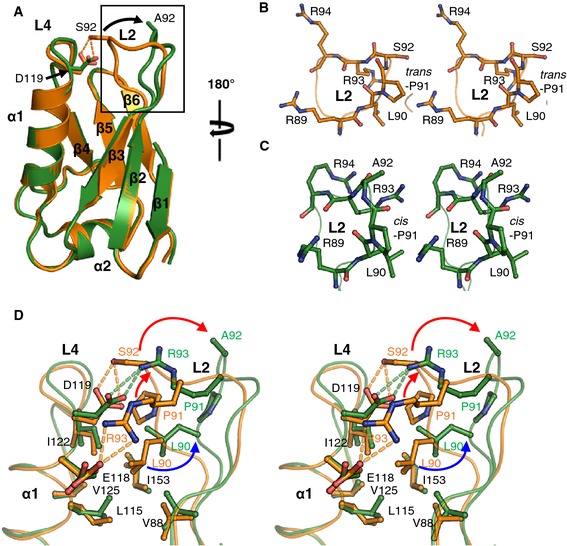
To elucidate the structural basis for the impaired activity of MCUS92A as shown above, we determined the 3D structure of MCU NTDS92A with N‐terminus T4 lysozyme fusion at 2.75 Å resolution (Fig 6 and Table 1). Overall structures of the NTDWT and NTDS92A are similar with a RMSD of 0.60 Å (Fig 6A). Interestingly, we found that the NTDS92A induced a conformational change in the L2‐L4 loops (Fig 6). In the structure of NTDWT, hydrogen bonding between S92 and D119 maintains trans‐conformation of the P91, which is located next to S92 (Fig 6B). On the contrary, NTDS92A breaks the S92‐D119 hydrogen bonding and induces conformational change to cis‐form of P91 (Fig 6C). Overall, L2 loop conformation in the NTDS92A moves away from L2 loop of NTDWT at a distance of Cα atom of 5.6 Å (Fig 6A and D). Sequentially, side chain of R93 forming hydrogen bond with E118 in the NTDWT moves up to the position of S92 and makes a new hydrogen bonding with D119 in the NTDS92A (Fig 6D). In addition, L90 interacting with hydrophobic residues, V88, L115, I122, V125 and I153, in NTDS92A moves away from L90 of NTDWT at a distance of 2.5 Å (Fig 6D). Thus, we suggest that a conformational change in L2‐L4 loops of the NTDS92A impairs the mitochondrial Ca2+ uptake activity.
Figure 6. Structural comparison of MCU NTDWT and NTDS 92A .
-
ASuperposition of the overall structure of MCU NTDWT (orange) and NTDS 92A (green). The arrow (black) in the box indicates the difference of L2 loop between NTDWT and NTDS 92A. Dashed lines (orange) denote hydrogen bonds.
-
B, CStereoview of L2 loop of MCU NTDWT (B) and NTDS 92A (C). P91 in the L2 loop describes two forms, trans (B) or cis (C).
-
DStereoview of conformational changes of the MCU NTDWT and NTDS 92A. Dashed lines denote hydrogen bonds in NTDWT (orange) and NTDS 92A (green). The arrows indicate the movement of residues forming hydrogen bonding (red) or hydrophobic interaction (blue), respectively.
Discussion
The uniplex reportedly consists of MCU and regulatory proteins, including MICU1, MICU2 and EMRE 6, 7, 8. The present results show that MCU NTD is not crucial for the uniplex assembly. Nevertheless, MCU NTD might be important for the interaction with other regulators or intra‐molecular interaction for mitochondrial Ca2+ uptake, since MCU NTD has putative PPI surface, and the Ca2+ uptake activity of MCUΔNTD and MCUS92A was significantly reduced in the present study. Although the fact that MCUR1 is a regulator for mitochondrial Ca2+ uptake by interaction with MCU is controversial 9, 10, we identified that MCU NTD directly interacts with MCUR1 (Fig EV5). However, how the interaction of MCU NTD with MCUR1 affects MCU function remains to be elucidated.
Figure EV5. Interaction of MCU NTD and MCUR1.
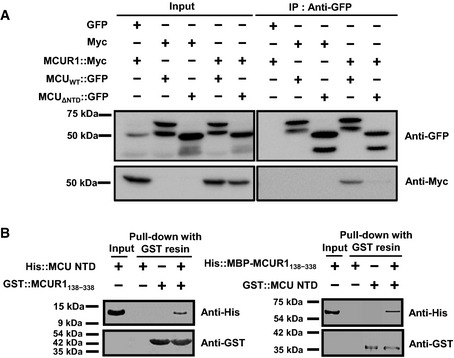
- HEK‐293 FT cells were transiently co‐transfected with myc‐MCUR1 and MCUWT‐GFP or MCU Δ NTD‐GFP. MCUWT‐GFP and MCU Δ NTD‐GFP were precipitated from cell lysates with anti‐GFP antibody. The precipitates were separated by SDS–PAGE and immunoblotted with the antibodies indicated. Co‐immunoprecipitation of MCUR1 with MCU Δ NTD was substantially diminished as compared to MCUWT, suggesting that MCU NTD is necessary for interactions between MCU and MCUR1.
- In vitro pull‐down assay of MCU NTD and MCUR1138–338. His‐ or GST‐tagged MCU NTD and MCUR1138–338 were pulled down using GST affinity resin. The bait protients, GST‐MCU NTD and GST‐MCUR1138–338, were immobilized on the GST resin, and then prey proteins, His‐MCU NTD or His‐MBP‐MCUR1138–338, flowed through the GST resin. The results were detected using Western blot after SDS–PAGE. The bait proteins, GST‐MCUR1138–338 and GST‐MCU NTD, were pulled down with their respective prey proteins, His‐MCU NTD and His‐MBP‐MCUR1138–338, using GST affinity resin, as evidence for a direct interaction between MCU NTD and MCUR1138–338. Thus, MCU NTD mediates the interaction between MCU and the side of MCUR1 facing the mitochondrial matrix.
It has been reported that high [Ca2+] is required for the Ca2+ transmission between endo/sarcoplasmic reticulum (E(S)R) and mitochondria, since MCU has very low affinity for Ca2+ 37, 38. Several tethering proteins support the close apposition between the subcellular organelles 39, 40 and the interaction between Ca2+ releasing channels (IP3R and RyR) in E(S)R and Ca2+ pathways (VDACs) across the mitochondrial outer membrane could mediate high [Ca2+] microdomains around the uniplex 41, 42, 43. Considering each RyRs and VDACs clustered in the microdomain 43, 44, 45, it opens the possibility of MCU clustering at the microdomain for efficient permeation across the mitochondrial inner membrane. In fact, we observed that MCU NTD forms an oligomer in the crystals and in the solution (Fig EV3A and B, Appendix Fig S3). Furthermore, MCU NTDs form helical oligomers in a similar manner to both the crystals of T4 lysozyme‐MCU NTD and MCU NTD‐E, suggesting that a crystal packing interface between MCU NTDs is not random (Fig EV3A and B). In addition, the interface in MCU NTD oligomer is consistent with the predicted PPI surface (Fig EV3E), suggesting that the interface observed in the crystal packing and PPI prediction in MCU NTD might be involved in the clustering of uniplexes at the microdomain. Thus, the deletion of MCU NTD could cause deprivation of spatial organization of the uniplex at the microdomain resulting in diminished mitochondrial Ca2+ uptake (Figs 3 and 4). However, the detailed molecular mechanisms for the uniplex clustering at the microdomain will await for the future studies such as resolving the 3D structures of the oligomers involved.
Post‐translational modifications could alter ion channel activity directly or indirectly by attachment of biochemical functional groups 23, 46, 47, 48. S92 in the L2 loop was predicted as a putative phosphorylation site for CaMKII, and its phosphorylation could modulate MCU function 23. Our study showed that the highly conserved S92 in L2 loop and D119 in L4 loop form a hydrogen bond and stabilize the loop structures (Fig 1D and E). In addition, the NTDS92A induced a conformational change in L2‐L4 loops and impaired mitochondrial Ca2+ uptake activity (Figs 5C and D, and 6), suggesting the possibility that S92 phosphorylation induces structural change and charge distribution in L2–L4 loops resulting in the modulation of the MCU function.
In summary, we determined the crystal structure of MCU NTD which forms a novel fold. MCU NTD appears to be essential for the regulation of mitochondrial Ca2+ uptake through interaction with regulator(s) and/or modulation of post‐translational modifications. Our results provide a framework for future studies, investigating how MCU controls Ca2+ permeation across the IMM via the uniplex and the possible roles of the post‐translational modifications.
Materials and Methods
Cloning MCU constructs
The sequences encoding MCU (NP_612366) residues 75–165 (MCU NTD) and MCU residues 75–185 (MCU NTD‐E) were amplified using polymerase chain reaction (PCR) from human oral squamous carcinoma YD‐10B cDNA. For in vitro binding assays, each of MCU NTD sequence was first cloned into a modified pET28a vector (Novagen) containing N‐terminal 6× His (His6)‐tobacco etch virus (TEV) or His6‐maltose binding protein (MBP)‐TEV. Each sequence was also cloned into modified pET41a vector (Novagen) containing glutathione S‐transferase (GST), which altered the thrombin site for a TEV protease site. For crystallographic studies, MCU NTDWT and the mutant, NTDS92A, were further cloned into modified pET21a vector (Novagen), which includes N‐terminal His6‐bacteriophage T4 lysozyme (residues 2–161). The T4 lysozyme was designed with triple mutations to prevent both cysteine residue oxidation (C54T/C97A) 49 and bacterial cell lysis (D20N) upon protein expression 50. MCU NTD‐E was finally cloned into pColdII vector (TaKaRa), which contains N‐terminal His6.
For the expression of MCU and MCUΔNTD in HeLa and HEK‐293 FT cells, MCUWT, MCUΔNTD, MCUS92A and MCUK180A were cloned into the pHM6 (Roche), pCS4 (Roche) and pEGFP‐N2 (Clontech) vectors. The pHM6 vector system contains an N‐terminal HA and C‐terminal His6. The pCS4 and pEGFP‐N2 vectors encode C‐terminal 3× Flag and green fluorescent protein (GFP), respectively.
Expression and purification of MCU constructs
T4 lysozyme‐MCU NTDWT and NTDS92A were expressed in Escherichia coli strain BL21‐CodonPlus (DE3). Transformed cells were cultured in Luria–Bertani medium containing 100 μg ml−1 ampicillin at 37°C. After the addition of 0.5 mM isopropyl‐β‐D‐thiogalactopyranoside (IPTG) (Goldbio), the cells were incubated at 20°C for an additional 20 h. They were then harvested by centrifugation at 4,000 × g for 20 min, resuspended in lysis buffer containing 20 mM Tris–HCl (pH 8.0), 500 mM NaCl, 10 mM imidazole, 1 mM PMSF and 1 mM β‐mercaptoethanol, lysed by sonication and again centrifuged for 1 h at 14,000 × g. The resultant supernatant was subjected to immobilized metal affinity chromatography on nickel‐nitrilotriacetic acid (Ni‐NTA) resin (Elpis) pre‐equilibrated with the lysis buffer. The column was then washed with 10 bed volumes of wash buffer containing 20 mM Tris–HCl (pH 8.0), 500 mM NaCl and 30 mM imidazole. The His6‐tagged protein bound to the column was eluted with buffer containing 20 mM Tris–HCl (pH 8.0), 500 mM NaCl, 300 mM imidazole and 5% glycerol. The samples were then further purified through size exclusion chromatography (SEC) on a HiLoad 16/60 Superdex 200 for NTDWT and a Superdex 75 for NTDS92A column (GE Healthcare Life Science) pre‐equilibrated with a buffer containing 20 mM Tris–HCl (pH 8.0), 50 mM NaCl, 5% glycerol and 1 mM DTT. The collected fractions containing T4 lysozyme‐MCU NTDWT and NTDS92A were concentrated using an Amicon Ultra‐15 10 K (Millipore) up to 5.0 mg ml−1. The final T4 lysozyme‐MCU NTDWT and NTDS92A were stored at −80°C.
MCU NTD‐E was purified using a similar procedure with lysis buffer [50 mM Tris–HCl (pH 8.0), 500 mM NaCl, 10 mM imidazole, 5% glycerol, 1 mM PMSF, 1 mM β‐mercaptoethanol], wash buffer [50 mM Tris–HCl (pH 8.0), 500 mM NaCl, 40 mM imidazole, 5% glycerol, 1 mM β‐mercaptoethanol] and elution buffer [50 mM Tris–HCl (pH 8.0), 500 mM NaCl, 500 mM imidazole, 5% glycerol, 1 mM β‐mercaptoethanol]. The samples were then purified using SEC on a HiLoad 16/60 Superdex 75 column (GE Healthcare Life Science) pre‐equilibrated with gel filtration buffer [20 mM Tris–HCl (pH 7.8), 100 mM NaCl, 5% glycerol, 1 mM DTT], after which the fractions containing human MCU NTD‐E were collected. The protein was then concentrated using an Amicon Ultra‐15 10 K (Millipore) to 1.2 mg ml−1. The final human MCU NTD‐E proteins were stored at −80°C.
Crystallization of T4 lysozyme‐MCU NTDWT, T4 lysozyme‐MCU NTDS92A and MCU NTD‐E
The purified proteins were initially screened for crystallization using the sitting‐drop vapour‐diffusion method in a 96‐well INTELLI‐PLATE (Art Robbins Ins.). T4 lysozyme‐MCU NTDWT formed needle‐shaped crystals after 6 h in reservoir solution containing Index I & II Screen (Hampton Research), 25% (w/v) PEG 3350, 0.2 M ammonium sulphate, 0.1 M Bis‐Tris–HCl (pH 6.5) and MCU NTD‐E formed needle‐shaped crystals after 7 days in a reservoir solution containing SaltRX (Hampton Research), 1.5 M lithium sulphate and 0.1 M Bis‐Tris propane (pH 7.0). Additional crystallization trials were performed using the hanging drop vapour‐diffusion method. Optimized T4 lysozyme‐MCU NTDWT crystals were grown at 20°C in 2‐μl drops containing equal volumes of protein and reservoir solution containing 20% PEG 3350, 5% glycerol, 0.3 M ammonium sulphate and 0.1 M Bis‐Tris–HCl (pH 5.5). The crystals of T4 lysozyme‐MCU NTDS92A were obtained using microseeding method using crystals of T4 lysozyme‐MCU NTDWT. Once the microcrystals (< 0.01–0.02 mm) of the T4 lysozyme‐MCU NTDWT had grown at 20°C, 2‐μl of T4 lysozyme‐MCU NTDS92A proteins and the 2 μl of reservoir solution were added directly to the 1‐μl drops containing T4 lysozyme‐MCU NTDWT seed crystals. The final T4 lysozyme‐MCU NTDS92A crystals were grown at 20°C in total 5 μl of mixtures containing the WT and the S92A mutant with 1:4 molar ratio. MCU NTD‐E crystals were optimized in mother liquor composed of 1.55 M lithium sulphate and 0.1 M Bis‐Tris propane (pH 8.0). For data collection, the T4 lysozyme‐MCU NTD crystals were directly flash‐frozen in liquid nitrogen, while MCU NTD‐E crystals were cryoprotected by transferring into a cryoprotectant containing 1.55 M lithium sulphate, 0.1 M Bis‐Tris propane (pH 8.0) and 20% glycerol and flash‐cooled in liquid nitrogen.
X‐ray diffraction data collection
Diffraction data from T4 lysozyme‐MCU NTDWT and MCU NTD‐E crystals were collected at 100 K using synchrotron X‐ray sources on beamlines 5C and 7A at the Pohang Accelerator Laboratory (PAL, South Korea), NW12A at the Photon Factory (PF) (Tsukuba, Japan) and BL26B1 at Spring‐8 (Harima, Japan). Ultimately, we were able to collect the best resolution diffraction data for T4 lysozyme‐MCU NTDWT at 1.80 Å resolution and T4 lysozyme‐MCU NTDS92A at 2.75 Å, and for MCU NTD‐E at 1.50 Å resolution on beamlines 5C and 7A at PAL, South Korea, using single wavelengths (0.9795 and 0.9793 Å, respectively). The crystals belong to the hexagonal space group P65 (a = b = 98.1 Å and c = 62.4 Å for T4 lysozyme‐MCU NTDWT, a = b = 97.8 Å and c = 61.5 Å for T4 lysozyme‐MCU NTDS92A, a = b = 55.5 Å and c = 68.9 Å for MCU NTD‐E, with α = β = 90 degrees and γ = 120 degrees). Diffraction data were then indexed, processed and scaled using HKL2000 suite 51.
Structure determination
Initial phases for T4 lysozyme‐MCU NTDWT were obtained through MR using Phaser 52 in the CCP4 suite 53 with the structure of bacteriophage T4 lysozyme (PDB code, 2LZM) as the template. As a result, we obtained clear σA‐weighted 2F o–F c maps for the entire MCU NTD structure. All residues in MCU NTD were fitted to the σA‐weighted 2F o–F c maps through model building using Coot 54. The model was refined using Refmac5 55, Phenix.refine 56 and Coot 54. In the final model, R work = 12.7% and R free = 19.0%, and there were no Ramachandran outliers (98.8% most favoured and 1.2% allowed). The phases of the T4 lysozyme‐MCU NTDS92A were obtained through MR using Phaser 52 in the CCP4 suite 53 with the structures of the T4 lysozyme (PDB code, 2LZM) and now‐solved MCU NTD structure as templates. The model was refined using Refmac5 55, Phenix.refine 56 and Coot 54. In the final model, R work = 16.4% and R free = 23.5%, and there were no Ramachandran outliers (97.2% most favoured and 2.8% allowed). R165 of T4 lysozyme‐MCU NTDWT and T4 lysozyme‐MCU NTDS92A was not modelled in the final structures, because of the weaker electron density map in this residue. The T4 lysozyme‐MCU NTDWT and T4 lysozyme‐MCU NTDS92A structures included three and six sulphates from mother liquor, respectively.
The phases of the MCU NTD‐E structure were obtained through MR using MOLREP 57 in the CCP4 suite 53 with the now‐solved MCU NTD structure as a template. All the residues in MCU NTD‐E that were missing residues in MCU NTD model were clearly present in the residual electron density maps and were built using Coot 54, and the model was refined using the Refmac5 55, Phenix.refine 56 and Coot 54. In the final model, R work = 14.0% and R free = 17.6%, and there were no Ramachandran outliers (99.1% most favoured and 0.9% allowed). Residues 183–185 of MCU NTD‐E were not modelled in the final structure because of the weaker electron density map in this region. An unidentified electron density was observed and modelled with a tetraethylene glycol molecule. Extra electron density in the imidazole ring of His170 of MCU NTD‐E is modified possibly by unidentified adducts. The statistics of data collection and structure refinement are summarized in Table 1.
Structural analysis
Superposition of structures was performed using the CCP4 program LSQKAB 58, PyMOL align 59 and Coot SSM superpose 54. LSQKAB was also used to estimate RMSD (Å) scores for the Cα atoms 58. The SCOP2 27, Dali program 28 and CATH database 29 searches were performed using MCU NTD as a template. The Ramachandran statistics were calculated using the program MolProbity 60. The sequence conservation of MCU homologues was calculated using the Consurf server 61. All molecular graphics were generated using PyMOL version 1.5.0.4 59.
Plasmids and constructions
GGECO (green) and RGECO (red) were generous gifts from Robert E. Campbell (Department of Chemistry, University of Alberta, Edmonton, Canada) 36. For direct targeting into the mitochondrial matrix, a synthetic oligomer corresponding to the N‐terminal 31 amino acids of the precursor of subunit VIII of cytochrome C oxidase was fused to the N‐terminus of GECO (mito‐GGECO).
Cell cultures and transfection
HeLa and HEK‐293 FT cells were maintained in Dulbecco's modified Eagle's medium (GIBCO) supplemented with 10% foetal bovine serum. For the transient expression of the indicated proteins, HeLa and HEK‐293 FT cells at 70% confluence were transfected using Fugene HD (Promega) according to the manufacturer's protocol.
Production of a recombinant lentivirus and generation of stable MCU knockdown (KD) HeLa cells
A recombinant lentivirus expressing shRNA for KD of MCU was produced using previously described methods 42. The sequence of the shRNA targeting the MCU mRNA was 5′‐CAATCAACTCAAGGATGCAAT‐3′. After preparation of the recombinant lentivirus, HeLa cells at 70% confluence in a 25‐cm2 flask were transduced for 8 h in the presence of 8 g ml−1 polybrene, after which the medium was refreshed. 1 μg ml−1 puromycin was added to the medium for the selection and maintenance of stable MCU‐KD HeLa cells.
Measurement of mitochondrial membrane potential
HeLa cells cultured on 25‐mm coverslips were loaded with 100 nM TMRM (Abcam) for 30 min at 37°C. The coverslips were then placed in a perfusion chamber, and TMRM fluorescence excited at 555 nm was acquired every 3 s using a LSM 700 confocal laser‐scanning microscope (arbitrary unit, a.u.) (Carl Zeiss). After 10 baseline acquisitions for 30 s each, 10 μM FCCP (carbonyl cyanide p‐trifluoromethoxyphenyl‐hydrazone), an uncoupler of oxidation phosphorylation, was rapidly applied to disrupt the mitochondrial membrane potential established by the respiratory chain (ΔΨ).
Co‐immunoprecipitation assay
Transfected HEK‐293 FT cells and HeLa cells were rinsed with cold PBS and solubilized with modified RIPA buffer [20 mM HEPES–NaOH (pH 7.4), 150 mM NaCl, 1 mM EGTA, 1% Triton X‐100, 1% NP‐40, 1% sodium deoxycholate, 2 mM Na3VO4, 100 mM NaF, PMSF and protease inhibitor cocktail] for 3 min at 4°C. After centrifugation of the solubilized cells at 13,000 × g for 30 min at 4°C, the supernatant was transferred to new tubes. An anti‐GFP antibody (sc‐8334, Santa Cruz) or anti‐Flag antibody (F‐3165, Sigma) was added, and the solution was incubated overnight at 4°C. Protein A‐Sepharose CL‐4B beads were then used to precipitate the antibodies followed by three washes with solubilizing buffer. After elution of precipitates from the beads with 2× Laemmli sample buffer [65.8 mM Tris–HCl (pH 6.8), 26.3% glycerol, 2.1% SDS, 0.01% bromophenol blue], the elutes were subjected to SDS–PAGE and immunoblotting.
Confocal imaging
HeLa cells cultured on 25‐mm coverslips were co‐transfected with plasmids encoding MCUWT‐GFP/MCUΔNTD‐GFP/mito‐GGECO and Mito‐DsRed (Clontech). 48 h post‐transfection, the cells were imaged using a LSM 700 confocal laser‐scanning microscope (Carl Zeiss).
HeLa cells cultured on 25‐mm coverslips were transfected with RGECO and mito‐GGECO for simultaneous measurement of cytosolic and mitochondrial [Ca2+]. 48 h post‐transfection, the cells on coverslips were washed with tyrode solution (TS) [140 mM NaCl, 6 mM KCl, 2 mM CaCl2, 1 mM MgCl2, 10 mM glucose and 10 mM HEPES–NaOH (pH 7.4)] and were placed in a perfusion chamber. After the cells were perfused with fresh TS for 1 min to record baseline data, 100 μM histamine in TS was added. GGECO and RGECO fluorescence excited at 488 and 555 nm, respectively, were simultaneously recorded every 1 s, using a LSM 700 confocal laser‐scanning microscope (Carl Zeiss) equipped with a 63× oil immersion objective. The recorded images were analysed and quantified using ZEN 2009 data analysis software (Carl Zeiss). F0 is initial fluorescence intensity. F and Fmax indicate fluorescence intensity at each time point and maximal fluorescence intensity after the stimulation, respectively. (Fmax–F0)/F0 indicates the maximal Ca2+ concentration evoked by the stimulation.
Western blot analysis
Proteins were run on SDS–PAGE and were electrophoretically transferred onto a PVDF membrane. The transferred proteins on the PVDF were incubated with blocking solution containing 5% (w/v) non‐fat dried skimmed milk powder and TBST [0.1% Tween‐20 in Tris‐buffered saline; 137 mM NaCl and 20 mM Tris–HCl, (pH 7.4)] for 1 h at room temperature. Thereafter, the membranes were treated with anti‐MCU (HPA016480, Sigma), anti‐MCU (raised against a synthetic peptide (328NEMDLKRLRDPLQVHLPLRQIGEKDC351) from human MCU and named anti‐MCU‐C), anti‐MICU1 (HPA037480, Sigma), anti‐Flag (F‐3165 and F7425, Sigma), anti‐MICU2 (ab101465, Abcam), anti‐His (MA1‐21315, Thermo Scientific), anti‐GFP (sc‐9996, Santa Cruz), anti‐flavoprotein subunit of complex II (459200, Mito Sciences), anti‐myc (sc‐40, Santa Cruz) and anti‐GAPDH (LF‐MA0026, Lab Frontier) antibodies, washed three times with TBST and then incubated with horseradish peroxidase‐conjugated secondary antibody (111‐035‐006 and 115‐035‐006, Jackson). After washing, the membranes were treated with enhanced chemiluminescence solution (Pierce), and the signals were detected using an ImageQuant LAS 4000 (GE Healthcare Life Sciences).
Isolation of crude mitochondria and Blue native PAGE (BN–PAGE)
Crude mitochondria were isolated from transfected HEK‐293 FT cells and HeLa cells as described previously 8. Briefly, the cells were rinsed in ice‐cold PBS, harvested in isolation buffer [50 mM MOPS, 100 mM KCl, 1 mM EGTA, 5 mM MgSO4, 200 mM sucrose, pH 7.4] and then homogenized by passage of 12 times through a 27.5‐guage needle attached to 1‐ml syringe. The homogenates were first centrifuged for 10 min at 800 × g to remove nuclei and debris, after which the supernatant was further centrifuged for 10 min at 8,000 × g, and the pellet was resuspended with the isolation buffer.
BN–PAGE was performed according to the manufacturer's protocol (Invitrogen). The crude mitochondria were solubilized in BN–PAGE sample buffer containing 1% digitonin for 15 min and then centrifuged at 16,000 × g for 30 min at 4°C. The supernatant was then mixed with BN–PAGE 5% G‐250 sample additive to a final concentration of 0.1%. The samples were run on Invitrogen NativePAGE™ Novex® Bis‐Tris Gel. After the electrophoresis was completed, the resolved proteins were transferred on to PVDF membranes and probed with anti‐Flag (F‐3165, Sigma) and anti‐MCU antibodies (HPA016480, Sigma).
Statistics
The experimental values are expressed as means ± SEM. Significance (P < 0.05) was determined using the unpaired two‐sided Student's t‐test.
Author contributions
DHK and SHE planned and organized the experiments. YoL performed purification, crystallization, structure determination, biochemical assays and data analysis. CKM, HKS and YuL performed Ca2+ measurements, data analysis and biochemical assays. TGK conducted in vitro binding assay. MK and Y‐SK generated stable cell lines. JYK carried out gene cloning and expression. YoL, TGK, H‐SY, J‐GL, JYA, KRP, JJL, JHyK and JW conducted the diffraction experiments and structure determination. CKM, DK and KS performed mammalian cell cultures and gene expression. ZYP performed LC‐MS/MS experiments. YoL and JHuK performed bacterial cell cultures and purification. YoL, CKM, JW, DHK and SHE wrote the manuscript.
Conflict of interest
The authors declare that they have no conflict of interest.
Supporting information
Appendix
Expanded View Figures PDF
Review Process File
Acknowledgements
We thank H. J. Youn (SNU; Seoul, South Korea) and Hye‐Yeon Kim (KBSI; Ochang, South Korea) for their support with the data collection and A. G. Murzin (MRC‐LMB; Cambridge, United Kingdom) for assistance with identification of new MCU domain. We also thank the staff at the macromolecular X‐ray facility of the Korea Basic Science Institute (KBSI; Ochang, South Korea), beamline BL‐5C and 7A of the Pohang Accelerator Laboratory (PAL; Pohang, South Korea), beamline NW12A at the Photon Factory (Tsukuba, Japan) and beamline BL26B1 at Spring‐8 (Harima, Japan) for their kind help with data collection. This work was supported by grants from the National Research Foundation (NRF) Grants (2013M3A9A7046297, 2013R1A2A2A01068440, 2007‐0056157, and 2013R1A1A2062629), “BK21 Plus Program” and “GIST Systems Biology Infrastructure Establishment Grant (2015)”, South Korea.
EMBO Reports (2015) 16: 1318–1333
References
- 1. Deluca HF, Engstrom GW (1961) Calcium uptake by rat kidney mitochondria. Proc Natl Acad Sci USA 47: 1744–1750 [DOI] [PMC free article] [PubMed] [Google Scholar]
- 2. Kirichok Y, Krapivinsky G, Clapham DE (2004) The mitochondrial calcium uniporter is a highly selective ion channel. Nature 427: 360–364 [DOI] [PubMed] [Google Scholar]
- 3. Perocchi F, Gohil VM, Girgis HS, Bao XR, McCombs JE, Palmer AE, Mootha VK (2010) MICU1 encodes a mitochondrial EF hand protein required for Ca2+ uptake. Nature 467: 291–296 [DOI] [PMC free article] [PubMed] [Google Scholar]
- 4. Plovanich M, Bogorad RL, Sancak Y, Kamer KJ, Strittmatter L, Li AA, Girgis HS, Kuchimanchi S, De Groot J, Speciner L et al (2013) MICU2, a paralog of MICU1, resides within the mitochondrial uniporter complex to regulate calcium handling. PLoS ONE 8: e55785 [DOI] [PMC free article] [PubMed] [Google Scholar]
- 5. Raffaello A, De Stefani D, Sabbadin D, Teardo E, Merli G, Picard A, Checchetto V, Moro S, Szabo I, Rizzuto R (2013) The mitochondrial calcium uniporter is a multimer that can include a dominant‐negative pore‐forming subunit. EMBO J 32: 2362–2376 [DOI] [PMC free article] [PubMed] [Google Scholar]
- 6. Marchi S, Pinton P (2014) The mitochondrial calcium uniporter complex: molecular components, structure and physiopathological implications. J Physiol 592: 829–839 [DOI] [PMC free article] [PubMed] [Google Scholar]
- 7. Foskett JK, Philipson B (2015) The mitochondrial Ca2+ uniporter complex. J Mol Cell Cardiol 78: 3–8 [DOI] [PMC free article] [PubMed] [Google Scholar]
- 8. Sancak Y, Markhard AL, Kitami T, Kovács‐Bogdán E, Kamer KJ, Udeshi ND, Carr SA, Chaudhuri D, Clapham DE, Li AA et al (2013) EMRE is an essential component of the mitochondrial calcium uniporter complex. Science 342: 1379–1382 [DOI] [PMC free article] [PubMed] [Google Scholar]
- 9. Mallilankaraman K, Cardenas C, Doonan PJ, Chandramoorthy HC, Irrinki KM, Golenar T, Csordas G, Madireddi P, Yang J, Muller M et al (2012) MCUR1 is an essential component of mitochondrial Ca2+ uptake that regulates cellular metabolism. Nat Cell Biol 14: 1336–1343 [DOI] [PMC free article] [PubMed] [Google Scholar]
- 10. Paupe V, Prudent J, Dassa EP, Rendon OZ, Shoubridge EA (2015) CCDC90A (MCUR1) is a cytochrome c oxidase assembly factor and not a regulator of the mitochondrial calcium uniporter. Cell Metab 21: 109–116 [DOI] [PubMed] [Google Scholar]
- 11. Baughman JM, Perocchi F, Girgis HS, Plovanich M, Belcher‐Timme CA, Sancak Y, Bao XR, Strittmatter L, Goldberger O, Bogorad RL et al (2011) Integrative genomics identifies MCU as an essential component of the mitochondrial calcium uniporter. Nature 476: 341–345 [DOI] [PMC free article] [PubMed] [Google Scholar]
- 12. De Stefani D, Raffaello A, Teardo E, Szabo I, Rizzuto R (2011) A forty‐kilodalton protein of the inner membrane is the mitochondrial calcium uniporter. Nature 476: 336–340 [DOI] [PMC free article] [PubMed] [Google Scholar]
- 13. Martell JD, Deerinck TJ, Sancak Y, Poulos TL, Mootha VK, Sosinsky GE, Ellisman MH, Ting AY (2012) Engineered ascorbate peroxidase as a genetically encoded reporter for electron microscopy. Nat Biotechnol 30: 1143–1148 [DOI] [PMC free article] [PubMed] [Google Scholar]
- 14. Hom J, Sheu SS (2009) Morphological dynamics of mitochondria‐a special emphasis on cardiac muscle cells. J Mol Cell Cardiol 46: 811–820 [DOI] [PMC free article] [PubMed] [Google Scholar]
- 15. Kinnally KW, Peixoto PM, Ryu SY, Dejean LM (2011) Is mPTP the gatekeeper for necrosis, apoptosis, or both? Biochim Biophys Acta 1813: 616–622 [DOI] [PMC free article] [PubMed] [Google Scholar]
- 16. Giorgi C, Baldassari F, Bononi A, Bonora M, De Marchi E, Marchi S, Missiroli S, Patergnani S, Rimessi A, Suski JM et al (2012) Mitochondrial Ca2+ and apoptosis. Cell Calcium 52: 36–43 [DOI] [PMC free article] [PubMed] [Google Scholar]
- 17. Mammucari C, Gherardi G, Zamparo I, Raffaello A, Boncompagni S, Chemello F, Cagnin S, Braga A, Zanin S, Pallafacchina G et al (2015) The mitochondrial calcium uniporter controls skeletal muscle trophism in vivo . Cell Rep 10: 1269–1279 [DOI] [PMC free article] [PubMed] [Google Scholar]
- 18. Huang G, Vercesi AE, Docampo R (2013) Essential regulation of cell bioenergetics in Trypanosoma brucei by the mitochondrial calcium uniporter. Nat Commun 4: 2865 [DOI] [PMC free article] [PubMed] [Google Scholar]
- 19. Prudent J, Popgeorgiev N, Bonneau B, Thibaut J, Gadet R, Lopez J, Gonzalo P, Rimokh R, Manon S, Houart C et al (2013) Bcl‐wav and the mitochondrial calcium uniporter drive gastrula morphogenesis in zebrafish. Nat Commun 4: 2330 [DOI] [PubMed] [Google Scholar]
- 20. Murphy E, Pan X, Nguyen T, Liu J, Holmström KM, Finkel T (2013) Unresolved questions from the analysis of mice lacking MCU expression. Biochem Biophys Res Commun 449: 384–385 [DOI] [PMC free article] [PubMed] [Google Scholar]
- 21. Pan X, Liu J, Nguyen T, Liu C, Sun J, Teng Y, Fergusson MM, Rovira II, Allen M, Springer DA et al (2013) The physiological role of mitochondrial calcium revealed by mice lacking the mitochondrial calcium uniporter. Nat Cell Biol 15: 1464–1472 [DOI] [PMC free article] [PubMed] [Google Scholar]
- 22. Holmström KM, Pan X, Liu JC, Menazza S, Liu J, Nguyen TT, Pan H, Parks RJ, Anderson S, Noguchi A et al (2015) Assessment of cardiac function in mice lacking the mitochondrial calcium uniporter. J Mol Cell Cardiol 85: 178–182 [DOI] [PMC free article] [PubMed] [Google Scholar]
- 23. Joiner ML, Koval OM, Li J, He BJ, Allamargot C, Gao Z, Luczak ED, Hall DD, Fink BD, Chen B et al (2012) CaMKII determines mitochondrial stress responses in heart. Nature 491: 269–273 [DOI] [PMC free article] [PubMed] [Google Scholar]
- 24. Settimo L, Donnini S, Juffer AH, Woody RW, Marin O (2007) Conformational changes upon calcium binding and phosphorylation in a synthetic fragment of calmodulin. Biopolymers 88: 373–385 [DOI] [PubMed] [Google Scholar]
- 25. Danielsen JM, Sylvestersen KB, Bekker‐Jensen S, Szklarczyk D, Poulsen JW, Horn H, Jensen LJ, Mailand N, Nielsen ML (2011) Mass spectrometric analysis of lysine ubiquitylation reveals promiscuity at site level. Mol Cell Proteomics 10: M110–M003590 [DOI] [PMC free article] [PubMed] [Google Scholar]
- 26. Schiapparelli LM, McClatchy DB, Liu HH, Sharma P, Yates JR III, Cline HT (2014) Direct detection of biotinylated proteins by mass spectrometry. J Proteome Res 13: 3966–3978 [DOI] [PMC free article] [PubMed] [Google Scholar]
- 27. Andreeva A, Howorth D, Chothia C, Kulesha E, Murzin AG (2014) SCOP2 prototype: a new approach to protein structure mining. Nucleic Acids Res 42: D310–D314 [DOI] [PMC free article] [PubMed] [Google Scholar]
- 28. Holm L, Rosenstrom P (2010) Dali server: conservation mapping in 3D. Nucleic Acids Res 38: W545–W549 [DOI] [PMC free article] [PubMed] [Google Scholar]
- 29. Sillitoe I, Cuff AL, Dessailly BH, Dawson NL, Furnham N, Lee D, Lees JG, Lewis TE, Studer RA, Rentzsch R et al (2013) New functional families (FunFams) in CATH to improve the mapping of conserved functional sites to 3D structures. Nucleic Acids Res 41: D490–D498 [DOI] [PMC free article] [PubMed] [Google Scholar]
- 30. Burroughs AM, Balaji S, Iyer LM, Aravind L (2007) Small but versatile: the extraordinary functional and structural diversity of the beta‐grasp fold. Biol Direct 2: 18 [DOI] [PMC free article] [PubMed] [Google Scholar]
- 31. Bork P, Holm L, Sander C (1994) The immunoglobulin fold. Structural classification, sequence patterns and common core. J Mol Biol 242: 309–320 [DOI] [PubMed] [Google Scholar]
- 32. Negi SS, Schein CH, Oezguen N, Power TD, Braun W (2007) InterProSurf: a web server for predicting interacting sites on protein surfaces. Bioinformatics 23: 3397–3399 [DOI] [PMC free article] [PubMed] [Google Scholar]
- 33. Chen H‐L, Zhou H‐X (2005) Prediction of interface residues in protein‐protein complexes by a consensus neural network method: test against NMR data. Proteins 61: 21–35 [DOI] [PubMed] [Google Scholar]
- 34. Hung V, Zou P, Rhee HW, Udeshi ND, Cracan V, Svinkina T, Carr SA, Mootha VK, Ting AY (2014) Proteomic mapping of the human mitochondrial intermembrane space in live cells via ratiometric APEX tagging. Mol Cell 55: 332–341 [DOI] [PMC free article] [PubMed] [Google Scholar]
- 35. Lam SS, Martell JD, Kamer KJ, Deerinck TJ, Ellisman MH, Mootha VK, Ting AY (2015) Directed evolution of APEX2 for electron microscopy and proximity labeling. Nat Methods 12: 51–54 [DOI] [PMC free article] [PubMed] [Google Scholar]
- 36. Zhao Y, Araki S, Wu J, Teramoto T, Chang YF, Nakano M, Abdelfattah AS, Fujiwara M, Ishihara T, Nagai T et al (2011) An expanded palette of genetically encoded Ca2+ indicators. Science 333: 1888–1891 [DOI] [PMC free article] [PubMed] [Google Scholar]
- 37. Pozzan T, Rizzuto R, Volpe P, Meldolesi J (1994) Molecular and cellular physiology of intracellular calcium stores. Physiol Rev 74: 595–636 [DOI] [PubMed] [Google Scholar]
- 38. Csordas G, Renken C, Varnai P, Walter L, Weaver D, Buttle KF, Balla T, Mannella CA, Hajnoczky G (2006) Structural and functional features and significance of the physical linkage between ER and mitochondria. J Cell Biol 174: 915–921 [DOI] [PMC free article] [PubMed] [Google Scholar]
- 39. de Brito OM, Scorrano L (2008) Mitofusin 2 tethers endoplasmic reticulum to mitochondria. Nature 456: 605–610 [DOI] [PubMed] [Google Scholar]
- 40. Kornmann B, Currie E, Collins SR, Schuldiner M, Nunnari J, Weissman JS, Walter P (2009) An ER‐mitochondria tethering complex revealed by a synthetic biology screen. Science 325: 477–481 [DOI] [PMC free article] [PubMed] [Google Scholar]
- 41. Szabadkai G, Bianchi K, Varnai P, De Stefani D, Wieckowski MR, Cavagna D, Nagy AI, Balla T, Rizzuto R (2006) Chaperone‐mediated coupling of endoplasmic reticulum and mitochondrial Ca2+ channels. J Cell Biol 175: 901–911 [DOI] [PMC free article] [PubMed] [Google Scholar]
- 42. Min CK, Yeom DR, Lee KE, Kwon HK, Kang M, Kim YS, Park ZY, Jeon H, Kim DH (2012) Coupling of ryanodine receptor 2 and voltage‐dependent anion channel 2 is essential for Ca2+ transfer from the sarcoplasmic reticulum to the mitochondria in the heart. Biochem J 447: 371–379 [DOI] [PubMed] [Google Scholar]
- 43. Liao Y, Hao Y, Chen H, He Q, Yuan Z, Cheng J (2015) Mitochondrial calcium uniporter protein MCU is involved in oxidative stress‐induced cell death. Protein Cell 6: 434–442 [DOI] [PMC free article] [PubMed] [Google Scholar]
- 44. Cheng H, Lederer WJ (2008) Calcium sparks. Physiol Rev 88: 1491–1545 [DOI] [PubMed] [Google Scholar]
- 45. Rapizzi E, Pinton P, Szabadkai G, Wieckowski MR, Vandecasteele G, Baird G, Tuft RA, Fogarty KE, Rizzuto R (2002) Recombinant expression of the voltage‐dependent anion channel enhances the transfer of Ca2+ microdomains to mitochondria. J Cell Biol 159: 613–624 [DOI] [PMC free article] [PubMed] [Google Scholar]
- 46. Hayashi T, Rumbaugh G, Huganir RL (2005) Differential regulation of AMPA receptor subunit trafficking by palmitoylation of two distinct sites. Neuron 47: 709–723 [DOI] [PubMed] [Google Scholar]
- 47. Gonnord P, Delarasse C, Auger R, Benihoud K, Prigent M, Cuif MH, Lamaze C, Kanellopoulos JM (2009) Palmitoylation of the P2X7 receptor, an ATP‐gated channel, controls its expression and association with lipid rafts. FASEB J 23: 795–805 [DOI] [PubMed] [Google Scholar]
- 48. van den Bogaart G, Meyenberg K, Risselada HJ, Amin H, Willig KI, Hubrich BE, Dier M, Hell SW, Grubmüller H, Diederichsen U et al (2011) Membrane protein sequestering by ionic protein‐lipid interactions. Nature 479: 552–555 [DOI] [PMC free article] [PubMed] [Google Scholar]
- 49. Pjura PE, Matsumura M, Wozniak JA, Matthews BW (1990) Structure of a thermostable disulfide‐bridge mutant of phage T4 lysozyme shows that an engineered cross‐link in a flexible region does not increase the rigidity of the folded protein. Biochemistry 29: 2592–2598 [DOI] [PubMed] [Google Scholar]
- 50. Tong J, Yang H, Ha S, Lee Y, Eom SH, Im YJ (2012) Crystallization and preliminary X‐ray crystallographic analysis of the oxysterol‐binding protein Osh3 from Saccharomyces cerevisiae . Acta Crystallogr Sect F Struct Biol Cryst Commun 68: 1498–1502 [DOI] [PMC free article] [PubMed] [Google Scholar]
- 51. Otwinowski Z, Minor W (1997) Processing of X‐ray diffraction data collected in oscillation mode. Methods Enzymol 207: 307–326 [DOI] [PubMed] [Google Scholar]
- 52. McCoy AJ, Grosse‐Kunstleve RW, Adams PD, Winn MD, Storoni LC, Read RJ (2007) Phaser crystallographic software. J Appl Crystallogr 40: 658–674 [DOI] [PMC free article] [PubMed] [Google Scholar]
- 53. Winn MD, Ballard CC, Cowtan KD, Dodson EJ, Emsley P, Evans PR, Keegan RM, Krissinel EB, Leslie AG, McCoy A et al (2011) Overview of the CCP4 suite and current developments. Acta Crystallogr D Biol Crystallogr 67: 235–242 [DOI] [PMC free article] [PubMed] [Google Scholar]
- 54. Emsley P, Cowtan K (2004) Coot: model‐building tools for molecular graphics. Acta Crystallogr D Biol Crystallogr 60: 2126–2132 [DOI] [PubMed] [Google Scholar]
- 55. Murshudov GN, Skubák P, Lebedev AA, Pannu NS, Steiner RA, Nicholls RA, Winn MD, Long F, Vagin AA (2011) REFMAC5 for the refinement of macromolecular crystal structures. Acta Crystallogr D Biol Crystallogr 67: 355–367 [DOI] [PMC free article] [PubMed] [Google Scholar]
- 56. Adams PD, Afonine PV, Bunkóczi G, Chen VB, Davis IW, Echols N, Headd JJ, Hung LW, Kapral GJ, Grosse‐Kunstleve RW et al (2010) PHENIX: a comprehensive python‐based system for macromolecular structure solution. Acta Crystallogr D Biol Crystallogr 66: 213–221 [DOI] [PMC free article] [PubMed] [Google Scholar]
- 57. Vagin A, Teplyakov A (2010) Molecular replacement with MOLREP. Acta Crystallogr D Biol Crystallogr 66: 22–25 [DOI] [PubMed] [Google Scholar]
- 58. Kabsch W, Kabsch H, Eisenberg D (1976) Packing in a new crystalline form of glutamine synthetase from Escherichia coli . J Mol Biol 100: 283–291 [DOI] [PubMed] [Google Scholar]
- 59. The PyMOL Molecular Graphics System, Version 1.5.0.4 Schrödinger, LLC Available at www.pymol.org
- 60. Chen VB, Arendall WB III, Headd JJ, Keedy DA, Immormino RM, Kapral GJ, Murray LW, Richardson JS, Richardson DC (2010) MolProbity: all‐atom structure validation for macromolecular crystallography. Acta Crystallogr D Biol Crystallogr 66: 12–21 [DOI] [PMC free article] [PubMed] [Google Scholar]
- 61. Landau M, Mayrose I, Rosenberg Y, Glaser F, Martz E, Pupko T, Ben‐Tal N (2005) ConSurf 2005: the projection of evolutionary conservation scores of residues on protein structures. Nucleic Acids Res 33: W299–W302 [DOI] [PMC free article] [PubMed] [Google Scholar]
Associated Data
This section collects any data citations, data availability statements, or supplementary materials included in this article.
Supplementary Materials
Appendix
Expanded View Figures PDF
Review Process File