

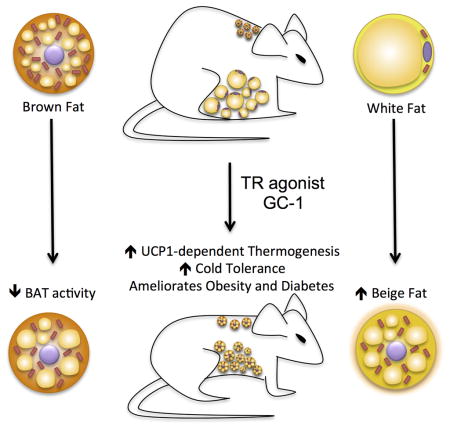
Summary
The functional conversion of white adipose tissue (WAT) into a tissue with brown adipose tissue (BAT)-like activity, often referred to a ‘browning’, represents an intriguing strategy to combat obesity and metabolic disease. We demonstrate that thyroid hormone receptor (TR) activation by a synthetic agonist markedly induces a program of adaptive thermogenesis in subcutaneous WAT that coincides with a restoration of cold tolerance to cold-intolerant mice. Distinct from most other browning agents, pharmacological TR activation dissociates the browning of WAT from activation of classical BAT. TR agonism also induces the browning of white adipocytes in vitro, indicating that TR mediated browning is cell autonomous. These data establish TR agonists as a class of browning agents, implicate the TRs in the browning of WAT, and suggest a profound pharmacological potential of this action.
Graphical Abstract
Introduction
Obesity is an accelerating worldwide health crisis associated with co-morbidities that include diabetes, hyperlipidemia, and hypertension. Obesity is caused by chronic intake of excess energy relative to expenditure, which becomes stored as lipid in white adipose tissue (WAT) and leads to its expansion (Trayhurn & Beattie 2001). While nearly everyone is familiar with WAT, typically referred to simply as ‘fat’, there is less appreciation for brown adipose tissue (BAT), which has the unique capacity to conduct non-shivering adaptive thermogenesis (NSAT), the conversion of excess energy to heat.
Since BAT-mediated adaptive thermogenesis is inherently anti-obesogenic (Lowell et al. 1993), there has long been an interest in harnessing this action to treat obesity. However, until recently, it was generally accepted that adult humans did not possess brown fat (Cannon & Nedergaard 2004). Instead, it was questioned whether WAT could be induced to become more BAT-like (Tiraby & Langin 2003) to increase energy expenditure. The prospect of achieving this was bolstered by the appearance of BAT-like, or ‘beige’ cells in WAT depots in response to cold exposure or treatment with β-adrenergic agonists (Guerra et al. 1998; Cousin et al. 1992). Although tantalizing, the physiological relevance of beige cells was unclear and it was not apparent how to exploit this effect clinically (Arch 2008).
Two events renewed interest in utilizing adaptive thermogenesis to combat obesity. First, several studies have established the existence of active brown fat in adult humans (Sidossis & Kajimura 2015; Nedergaard et al. 2007). Second, several contemporary reports demonstrated the ability to impart BAT-like function to WAT depots in rodents, a process often referred to as ‘browning’ (Harms & Seale 2013). While these examples established induction of BAT-like adaptive thermogenesis in WAT can have anti-obesogenic and anti-diabetic effects, the magnitude of these effects have generally been modest despite the use of genetically engineered mice, leaving the pharmacological potential of browning (Nedergaard & Cannon 2014) unclear.
It is well established that thyroid hormone receptor (TR) signaling regulates thermogenesis, body temperature (Silva 1995), and energy balance (Grover 2003). In both humans and mice, hypothyroidism is associated with hypersensitivity to cold, while hyperthyroid individuals have difficulty tolerating heat (Melish 1990). Although TR signaling has been linked to BAT development (Hall et al. 2010) the relationship between TR activation and thermogenesis is complex and has not been fully resolved. Here, we report TR activation by the synthetic agonist GC-1 elicits a BAT-like program of adaptive thermogenesis in subcutaneous WAT (scWAT). This action, which is accompanied by marked increase in metabolism, fat loss, and increased cold tolerance, suggests browning of WAT may represent an unappreciated component of TR-induced thermogenesis.
Results
The TR agonist GC-1 elicits a BAT-like program of adaptive thermogenesis in scWAT of ob/ob mice
To explore how TR agonists induce thermogenesis in vivo, we treated genetically obese (ob/ob) mice with the synthetic agonist GC-1, and profiled changes in the expression of adaptive thermogenesis genes and mitochondrial function in BAT, epididymal WAT, and scWAT depots (Figure 1A–1C). Surprisingly, GC-1 significantly repressed all markers in BAT (Figure 1A). In contrast, the expression of all genes was strongly induced in scWAT, with levels of Ppargc1a, Elovl3, Cidea, Dio2, Cox5a, and Cebpb increased over 10-fold, and Ucp1 levels increased over 100-fold (Figure 1B). An estimate of absolute transcript levels suggested that, following GC-1 treatment, Ucp1 mRNA levels in scWAT were similar to BAT (Figure S1B). In epididymal WAT, Ucp1 levels were also increased, although expression of all other genes in the thermogenic program were either decreased or unchanged (Figure 1C). GC-1 did alter expression levels of genes implicated in muscle-mediated thermogenesis, although expression of other genes including Ucp1 was unchanged and the magnitude of the observed changes was small relative to the alterations seen in scWAT and BAT (Figure S1A). These data suggest the TR agonist GC-1 induces the adaptive thermogenesis program in scWAT.
Figure 1. The TR agonist GC-1 induces adaptive thermogenesis and increases respiration in scWAT and isolated white adipocytes.

(A – C) Male ob/ob mice were fed a diet either containing GC-1 (3 mg/kg-diet) or without for 21 days (n = 4 – 5). Thermogenic gene expression in BAT (A), scWAT (B), and epiWAT (C) was determined with RT-PCR. Values were normalized to β-actin.
(D) Representative immunoblot and quantification of UCP1 protein expression in scWAT (n = 4 – 5). α-tubulin was used as a loading control.
(E) H&E staining of epiWAT, scWAT, and BAT from ob/ob mice following GC-1 treatment. Scale bar, 100 μm.
(F) UCP1 immunohistochemistry of representative sections of BAT, scWAT and epiWAT of control and GC-1 treated mice. Scale bar, 100 μm.
(G) Mitochondrial DNA content relative to genomic DNA in epiWAT, scWAT, and BAT (n = 4 – 5).
(H) Citrate synthase activity in epiWAT, scWAT, and BAT (n = 4 – 5).
(I – K) Primary stromal vascular cells isolated from scWAT were grown to confluence and then stimulated to differentiate with dexamethasone, insulin, isobutulmethylxanthine, and rosiglitazone for 2 days. Thermogenic gene expression of cultured adipocytes treated with 100 μM GC-1 or vehicle between days 6–12, 2–12 or 0–12 (n = 4) (I). UCP1 immunofluorescence (J) and cellular respiration (K) of white adipocytes treated with GC-1 or vehicle from days 0–12 (n = 4). DAPI (blue), UCP1 (red). Scale bar, 10 μm. Leak and maximum respiration rates were measured following the addition of oligomycin and FCCP, respectively.
Data are mean ± s.e.m. *P < 0.05, **P < 0.01, ***P < 0.001. See also Figure S1.
We next investigated how GC-1 affected UCP1 protein levels in the various adipose tissue depots. While UCP1 protein levels were unaltered in BAT, the effect in scWAT was striking. UCP1 protein, which was undetectable in the scWAT of untreated mice, increased at least 100-fold, reaching a level equivalent to 40% of that found in BAT (Figure 1D and S1C). UCP1 levels were undetectable in epididymal WAT of both treated and untreated animals. Further, histological examination of adipose tissue depots revealed remarkable morphological changes in the scWAT of GC-1 treated mice (Figure 1E). Subcutaneous white adipocytes of treated mice were smaller, contained multilocular lipid droplets, and expressed UCP1 (Figure 1F), all features common to brown adipocytes (Cinti et al. 2001). Conversely, BAT of treated mice appeared to become more white-like, suggesting decreased BAT activity. Adipocytes of epididymal WAT exhibited little morphological change. To investigate changes in the metabolic parameters of various adipose tissue depots, we measured mitochondrial DNA content and citrate synthase activity. Following GC-1 treatment, mitochondrial DNA and citrate synthase increased substantially in scWAT (Figure 1G and 1H), but not epididymal WAT or BAT. Collectively, GC-1 induces genes involved in adaptive thermogenesis, induces mitochondrial biogenesis, increases UCP1 protein, and elicits morphological changes in scWAT consistent with a white to brown-like conversion.
WAT browning by GC-1 is cell autonomous
To test whether the induction of adaptive thermogenesis was a direct action of GC-1 on adipocytes, we examined the ability of GC-1 to increase respiration and induce browning in primary adipocytes derived from mouse scWAT. Cells were treated with GC-1 over different time periods during adipogenic differentiation. All treatments robustly induced thermogenic genes, with longer treatments tending to increase expression levels more highly (Figure 1I). In primary adipocytes treated with GC-1 during the entire course of differentiation, UCP1 and DIO2 expression levels were increased over 7000-fold and immunofluorescence staining revealed a striking proliferation of UCP1-positive mitochondria (Figure 1J). Respiration (basal, leak, and maximal) also increased two-fold in cells treated similarly (Figure 1K). Together, these results reveal TR activation increases respiration in white adipocytes in a cell-autonomous fashion.
GC-1-induced browning of scWAT coincides with marked thermogenesis and metabolic elevation
Almost universally, reports of browning suggest that WAT-mediated thermogenesis elicits anti-obesity and anti-diabetic actions (Harms & Seale 2013). To examine the metabolic effects that coincided with browning, we monitored body temperature and metabolic rate after GC-1 treatment. GC-1 raised metabolic rate by nearly 60% (Figure 2A and 2B), and increased body temperature by 3.8°C (Figure 2C), an increase that was readily apparent when handling animals. The induction of thermogenesis was accompanied by marked weight and fat loss (Figure 2D and 2E). GC-1 treatment did not alter food intake and treated mice were marginally less active than untreated controls (Figure S2A and S2B), indicating weight loss resulted solely from increased metabolic rate. Lean mass increased following GC-1 treatment (Figure 2F), indicating weight loss was due exclusively to a loss of adiposity. GC-1 treatment also led to a substantial decrease in the respiratory exchange ratio (RER), with values approaching the theoretical minimum of 0.7 (Figure 2G), indicating that GC-1 elicited a substantial shift in substrate utilization from carbohydrates to fatty acids. The change in RER is consistent with reports demonstrating that uncoupling of oxidative phosphorylation by either chemical uncouplers (Goldgof et al. 2014) or NSAT (Nguyen et al. 2011) increases the oxidation of fatty acids relative to carbohydrates.
Figure 2. GC-1-mediated browning of WAT coincides with supraphysiological thermogenesis in vivo.

(A) Energy expenditure of GC-1 treated and untreated control (ob/ob) mice was measured by indirect calorimetry at 15 min intervals over 4 days (n = 4).
(B) Average day and night metabolic rates between days 12–14 (n = 4).
(C) Body temperature of GC-1 treated and untreated control mice after 21 days (n = 5).
(D) Representative image of GC-1 treated (right) and untreated (left) control ob/ob mice after 21 days.
(E and F) Body fat (E) and lean mass (F) of GC-1 treated and untreated control mice monitored over the course of the treatment by MRI. Fat and lean mass are expressed as absolute weight (n = 4 – 5).
(G) Respiratory exchange ratio (RER) of GC-1 treated and untreated control mice was measured at 15 min intervals.
(H) Fasting blood glucose in ob/ob mice treated with vehicle or GC-1 for 10–12 days (n = 6).
(I and J) Hyperinsulinemic-euglycemic clamps were performed following 10–12 days of treatment with vehicle or GC-1 (n = 6). Glucose infusion rate (GIR) (J) and glucose disposal rate (GDR) (K) is expressed as mg/mouse/min.
(K and L) Glucose tolerance tests (GTT) performed on GC-1 treated and untreated control ob/ob mice assessed following 20 days of treatment (n = 5 – 6). (M) Area under curve (AUC) values from (L).
Data are mean ± s.e.m. *P < 0.05, **P < 0.01, ***P < 0.001. See also Figure S2.
To determine whether GC-1 induced thermogenesis affected insulin sensitivity and glycemic control, we conducted a hyperinsulinemic-euglycemic clamps study as well as a glucose tolerance test. GC-1 treatment normalized fasting glucose levels (Figure 2H), increased glucose infusion rate (Figure 2I), and improved glucose disposal rate, basal glucose production, and hepatic glucose disposal (Figure 2J, S2C and S2D), all indicative of substantially increased insulin sensitivity. GC-1 treated mice also exhibited markedly improved glycemic control (Figure 2K and Figure 2L). Collectively, these results suggest TR activation by GC-1 induces a thermogenic program that ameliorates obesity and insulin resistance.
GC-1 induces adaptive thermogenesis in scWAT of DIO mice
In addition to defects in BAT function, the leptin deficiency of ob/ob mice perturbs numerous endocrine functions, which prompt questions about thyroid status (Ohtake et al. 1977). To explore the generality of the results obtained with ob/ob mice, we investigated the effects of GC-1 in diet-induced obese (DIO) C57 mice. GC-1 induced thermogenesis in DIO mice, as indicated by increased metabolic rate (Figure S2E and S2F), increased body temperature (Figure S2G) and fat loss (Figure S2H). Similar to the findings in ob/ob mice, genes involved in adaptive thermogenesis were generally increased in scWAT of agonist-treated mice (Figure S2I), while expression of thermogenic genes decreased in BAT (Figure S2J). UCP1 protein, which was undetectable in scWAT of vehicle-treated mice, increased at least 17-fold following GC-1 treatment (Figure S2K). Similar to effects observed in ob/ob mice, BAT levels of UCP1 protein were unchanged (Figure S1C and S2L), despite decreased mRNA levels. Mitochondrial DNA increased in scWAT of mice treated with GC-1, but was unaltered in BAT (Figure S2M). Hyperglycemia of DIO mice was completely normalized following GC-1 treatment and glucose tolerance was markedly increased (Figure S2N and S2O).
GC-1 mediated adaptive thermogenesis is independent of BAT activity
Given the magnitude of GC-1-induced thermogenesis and the high capacity of BAT to mediate thermogenesis in mice, we felt it was important to ask whether BAT contributed to the thermogenic actions of GC-1. We used PET/CT imaging to examine the effects of GC-1 treatment on glucose metabolism in BAT and other peripheral tissues. In untreated mice, 18F-FDG (FDG) uptake in intrascapular BAT was readily apparent (Figure 3A). Following GC-1 treatment, however, FDG uptake in intrascapular BAT became indistinguishable from uptake in surrounding tissue, suggesting that GC-1 strongly decreases the metabolic activity of intrascapular BAT. Instead, GC-1 treated mice exhibited diffuse FDG uptake into extra-abdominal regions corresponding to scWAT. FDG uptake into equivalent regions of untreated mice was undetectable. Similar changes in glucose metabolism were observed during the hyperinsulinemic-euglycemic clamp study. Under hyperinsulinemic conditions, 14C-deoxyglucose uptake into scWAT increased significantly in GC-1 treated mice, while glucose uptake into BAT was decreased (Figure 3B). To more firmly establish that BAT did not contribute to TR mediated thermogenesis, GC-1 was administered to ob/ob and DIO mice in which intrascapular BAT activity was ablated by surgical denervation. While denervation reduced the expression of thermogenic markers in BAT (Figure S3A), GC-1 treatment induced thermogenic gene expression in scWAT (Figure S3B) and resulted in weight (Figure S3C) and fat loss (Figure 3C add S3D) and body temperature elevation (Figure 3D add S3E) that was indistinguishable between BAT-denervated mice and sham treated controls, indicating intrascapular BAT does not measurably contribute to the metabolic effects elicited by GC-1.
Figure 3. GC-1 induced thermogenesis is independent of BAT activity, yet requires UCP1.

(A) Representative 18F-FDG PET-CT image of GC-1 treated (right) and untreated control (left) ob/ob mice. White arrowheads denote iBAT and asterisks (*) represents an extra-abdominal regions corresponding to scWAT.
(B) 14C-deoxyglucose uptake in scWAT and BAT of GC-1 treated and untreated control mice measured during the hyperinsulinemic-euglycemic clamps (n = 6).
(C – D) Male ob/ob mice were subject to either BAT denervation surgery or a sham operation. Following which, they were fed a standard chow diet with or without GC-1 for 21 days (n = 6 per sham group; n = 3 per BAT denervated group). Change in fat mass expressed relative to initial fat mass in BAT-denervated and sham-treated mice during GC-1 treatment (C). Final body temperature of BAT-denervated and sham mice with and without GC-1 (D).
(E – G) Ucp1−/− and littermate controls were treated with GC-1 via injection for 14 days (n = 5 – 7). Metabolic rate (E and F) and final body temperature (G) of wild-type and Ucp1−/− mice.
(H – K) SVFs from WT and Ucp1−/− mice were differentiated with GC-1 or vehicle (n = 4 – 5). Relative gene expression determined by RT-PCR 12 days after the initiation of differentiation (H). Oxygen consumption was performed under basal conditions, following the addition of oligomycin (i) FCCP (ii) and antimycin A + rotenone (iii) (I and J).
Data are mean ± s.e.m. *P < 0.05, **P < 0.01, ***P < 0.001 comparison of GC-1 treated vs untreated. †P < 0.05, ††P < 0.01, †††P < 0.001 comparison Ucp1−/− vs littermate controls. See also Figure S3.
GC-1-mediated thermogenesis is Ucp1-dependent
In order to address whether the ability of GC-1 to induce thermogenesis was an adipose-specific effect, we explored whether GC-1 induced thermogenesis in Ucp1−/− mice, which cannot evoke any NSAT. As expected, GC-1 treatment of control animals induced thermogenesis, as indicated by increased metabolic rate (Figure 3E and 3F) and increased body temperature (Figure 3G). However, GC-1 failed to elicit either effect in Ucp1−/− animals, indicating Ucp1 is required for TR agonist induced thermogenesis (Figure 3E–3G). In order to test whether the ability of GC-1 to induce browning in vitro was also Ucp1 dependent, we treated white adipocytes derived from either Ucp1−/− mice or control animals with the agonist. Although the gene expression program induced by GC-1 was nearly identical in Ucp1−/− derived adipocytes and control cells (Figure 3H), the ability of GC-1 to increase respiration (basal and leak) was lost in cells lacking Ucp1 (Figure 3I and 3J). Thus, the ability of GC-1 to induce both browning in vitro and thermogenesis in vivo requires Ucp1.
GC-1 induced browning in not due to fever
Cold results in increased SNS outflow to adipose tissues, leading to increased BAT activity and WAT browning. It has been suggested that WAT browning is simply a secondary effect of making the mice cold, either by altering the insulating properties of the skin or fur, or by inducing a fever (Nedergaard & Cannon 2014). If increased metabolic rate with GC-1 was due to a direct induction of adaptive thermogenesis in scWAT, increased thermogenic capacity and increased cold tolerance would be expected. Conversely, if WAT browning by GC-1 was a secondary effect of fever or reduced insulation, impaired cold tolerance would be anticipated. Thus, we tested whether GC-1 treatment of ob/ob mice improved or impaired cold tolerance. Almost immediately upon exposure to 4°C untreated mice exhibited pronounced shivering and piloerection and body temperature decreased sharply (Figure 4A). Conversely, GC-1 treated animals experienced no decrease in body temperature after 15 hours at 4°C. Remarkably, treated animals exhibited no apparent shivering or piloerection, suggesting that the adaptive thermogenesis program elicited by GC-1 obviated the need for shivering, generally a key component of heat generation in response to cold (Nedergaard & Cannon 2014). We also looked at norepinephrine levels in WAT and BAT and found that levels decreased substantially in both tissues (Figure 4B) following GC-1 treatment. We also tested the effects of GC-1 on Ucp1−/− mice which cannot induce NSAT. In stark contrast to the effects observed in ob/ob mice, GC-1 treatment of Ucp1−/− mice impaired cold tolerance as indicated by a marked decrease in body temperature when exposed to 4°C (Figure 4C). This data strongly suggests Ucp1, and its induction in peripheral tissues (namely WAT), is required for increased cold tolerance and in the absence of this effect, the increased temperature set-point observed with GC-1 treatment reduces cold tolerance. These results further suggest WAT browning induced by GC-1 is not simply a secondary effect of fever or altered insulating capacity.
Figure 4. TR activation reduces the requirement for SNS/β-AR stimulation to induce browning.

(A) Cold challenge performed on ob/ob mice were treated with or without GC-1 for 21 days. Rectal temperature during exposure to 4°C (n = 4).
(B) DIO Ucp1−/− mice and Ucp1+/+ littermate controls were treated with GC-1 or vehicle for 14 days. Rectal temperature was measured before and after 24-hr cold exposure (4°C) (n = 5–6).
(C) Norepinephrine content in BAT and scWAT of GC-1 treated and untreated ob/ob mice (n = 6).
(D – H) Male C57Bl6 mice housed at thermoneutrality were administered GC-1 (0.3 mg/kg) or vehicle via ip injection for 14 days (n = 5 – 6). Energy expenditure at 15 min intervals (D) and day-night averages (E) were measured by indirect calorimetry. Rectal body temperature (F), thermogenic gene expression (G) and UCP1 immunohistochemistry in scWAT (H). Scale bar, 100 μm.
(I – M) Male ob/ob mice were treated with GC-1 (0.3 mg/kg) or propranolol (Prop, 20 mg/kg) alone, or together for 21 days (n = 4 – 5). Metabolic rate (I and J), body temperature (K), UCP1 staining of scWAT sections (L) and thermogenic gene expression in scWAT (M). Scale bar, 100 μm.
(N) SVFs differentiated in presence of GC-1 or vehicle were pretreated with 50 μM H-89 for 1 hr, followed by 1 uM norepinephrine (NE) for 4 hr (n = 4).
Data are mean ± s.e.m. *P < 0.05, **P < 0.01, ***P < 0.001. †P < 0.05 comparison before vs after cold challenge. See also Figure S4.
TR activation reduces the requirement for SNS/β-AR stimulation to induce browning
The most well established mechanism of WAT browning is via activation of the β-adrenergic receptors (β-AR). To explore the relationship between GC-1 induced browning and β-AR signaling we first examined the effect of GC-1 on mice at thermoneutrality, conditions where β-AR stimulation of adipose tissues is minimal. At thermoneutrality, GC-1 evoked thermogenesis, as indicated by increased metabolic rate (Figure 4D and 4E), elevated body temperature (Figure 4F), changes in gene expression (Figure 4G) and scWAT morphology (UCP1+ multilocular cells) (Figure 4H), consistent with browning. We next investigated how β-AR blockage affected the ability of GC-1 to induce thermogenesis and browning. Treatment of mice with the β-AR blocker propanolol did not affect the ability of GC-1 to increase metabolic rate (Figure 4I and 4J) and body temperature (Figure 4K), although the magnitude of browning, as indicated by morphological changes (UCP1+ multilocular cells) (Figure 4L) and gene expression (Figure 4M) in WAT was decreased in propanolol treated mice. We next explored the necessity of β-AR signaling for TR mediated browning in vitro. In cultured white adipocytes norepinephrine increased Ucp1 levels by 100-fold. As expected, this effect was largely lost when β-AR signaling was blocked by the PKA inhibitor H-89 (Figure 4N). While GC-1 also robustly induced Ucp1 levels, this induction was not affected by PKA inhibition. Collectively, these data indicate GC-1 greatly reduces the necessity of β-AR stimulation to induce WAT browning, either by strongly potentiating β-AR signaling or via an alternative mechanism (Ye et al. 2013) and establishes TR agonists as browning agents.
WAT browning is not a common effect of all TR agonists
In order to see whether WAT browning was a common effect of all TR agonists, we tested the ability of the agonist KB2115 to induce thermogenesis and browning. While KB2115 slightly increased metabolic rate (Figure S4A and S4B), no increase in body temperature was observed (Figure S4C). In scWAT, KB2115 induced thermogenic genes (Figure S4D) at a level far lower than that demonstrated by GC-1. Further, in a related study we found that KB2115 does not elicit any of the anti-diabetic actions observed with GC-1 treatment (Martagón et al. 2015). Thus, the potential to induce browning and concomitant thermogenesis, at least at the magnitude observed with GC-1, is not a common feature of all TR agonists.
Discussion
We believe these data clearly establish that pharmacological activation of TRs can elicit profound changes in white adipocytes in vivo and in vitro consistent with a white to brown-like functional conversion. This effect is restricted to scWAT, with no evidence of browning in epididymal WAT, supporting the idea that WAT browning is largely a subcutaneous phenomenon (Wang et al. 2013). While many studies have now demonstrated the ability to induce a BAT-like program of thermogenesis in WAT depots (Harms & Seale 2013) the metabolic changes that have accompanied most demonstrations of WAT browning have been modest, leading to questions about the pharmacological potential of this action (Nedergaard & Cannon 2014). However, we believe our data demonstrates that WAT browning, if affected to the magnitude observed with GC-1, can indeed afford substantial anti-obesity and anti-diabetic effects. Increased glucose uptake in scWAT, observed via PET imaging and during the hyperinsulinemic-euglycemic clamp study, demonstrates that scWAT contributes to the anti-diabetic actions of GC-1 by mediating increased glucose disposal. Increased respiration, observed in cultured adipocytes, demonstrates TR activation by GC-1 not only induces genes involved in thermogenesis, but elicits a functional increase in the metabolic rate of white adipocytes. That UCP1 is required for the thermogenic effects of GC-1, despite all evidence suggesting a lack of BAT involvement in this process, firmly implicates WAT in mediating the thermogenic actions of GC-1 and links WAT browning to the observed increase in systemic metabolism.
That GC-1 increases metabolic rate in vitro and in vivo demonstrates that the compound not only induces the expression of thermogenic genes, but also activates the program of adaptive thermogenesis. Since this program is normally controlled by β-AR stimulation, it suggested that either SNS outflow to WAT was increased with GC-1 or that the compound lessened the threshold for activation. Our data suggests the latter, that TR agonism in white adipocytes elicits thermogenesis despite reduced β-AR stimulation and establishes TR agonists as a class of browning agent. These data also suggest that GC-1 reduces SNS stimulation of BAT, likely as a compensatory response to the increased thermogenic potential of scWAT. Although GC-1 appears to reduce SNS outflow to adipose tissues, the increased body temperature of treated mice reveals that that the compound does also affect the central regulation of thermal set-point. Thus, the systemic effects of GC-1 likely stem from a combination of central and peripheral actions of the compound. That many of GC-1’s effects are lost or reduced in the absence of Ucp1, such as the increased cold tolerance observed in ob/ob mice, suggests that these particular effects result from direct Ucp1-dependent peripheral actions. Somewhat surprisingly, despite the observed functional differences, GC-1 induced gene expression in white adipocytes was nearly identical in Ucp1−/− and Ucp1+/+ mice and cells (Fig. 3H) indicating that GC-1 treatment of Ucp1−/− mice dissociates cellular changes in white adipocytes, such as mitochondriogenesis and lipolysis, from Ucp1-dependent thermogenesis. This type of WAT remodeling has been suggested to mediate beneficial Ucp1-independent effects of WAT browning (Ukropec et al. 2006) and future studies in Ucp1−/− mice may show brown-like adipocyte remodeling affects systemic metabolic parameters including fat distribution, serum lipid levels and insulin sensitivity. Further studies, particularly those involving Ucp1−/− mice, which are under considerable thermal stress at ambient temperatures, should also be performed at thermoneutrality to minimize central sympathetic involvement and quantitatively assess the contribution of peripheral Ucp1 induction to the observed metabolic effects.
Not all TR agonists share the ability to induce WAT browning at the magnitude observed with GC-1. It was previously thought that differential effects of TR agonists stemmed from a preferential affinity for either the TRα or TRβ isoform of the receptor. However, the discovery that the OATP1 and MCT families of transporters are involved in transporting endogenous and synthetic thyroid hormones has led to an appreciation that tissue selectivity, mediated by these transporters, is also a key contributor to the differential effects of diverse TR agonists (Meyer zu Schwabedissen et al. 2011; Visser et al. 2011). The greater efficacy of GC-1 at inducing browning relative to KB2115, despite both ligands being TRβ selective, suggests to us that tissue selective uptake is likely responsible for the compounds’ capacity to induce browning and offers a potential route to developing improved browning agents.
While these data demonstrate clearly that TR activation can pharmacologically induce WAT browning and thermogenesis, the physiological relevance of this effect is not yet obvious. Although thyroid hormone excess is clearly implicated in thermogenesis, the mechanistic basis for thyroid thermogenesis has never been clear. In vitro, thyroid hormone, and other TR agonists including GC-1, induce thermogenic genes in brown adipocytes and are, in fact, necessary for brown adipocyte cell culture (Guerra et al. 1998; Martinez de Mena et al. 2010). In vivo, however, thyroid thermogenesis is generally accompanied by decreased BAT activity, indicating that the observed thermogenesis must originate from tissues other than BAT (Abelenda & Puerta 1992; Sato et al. 1986). Thus, the decreased BAT activity observed with GC-1 treatment is likely not a cell autonomous effect of the compound, but is instead a result of decreased SNS innervation of BAT. Is WAT browning an unappreciated component of thyroid thermogenesis? As T3 can also induce browning in vitro (Lee et al. 2012; Wang et al. 2014), it is certainly possible. However, since T3 appears to be much less effective at promoting browning than GC-1, further studies will be necessary to determine whether browning is a major contributor to the thermogenesis that accompanies hyperthyroid states or simply an ancillary effect.
In conclusion, TR activation by the synthetic agonist GC-1 induces a genetic program of BAT-like thermogenesis in subcutaneous white adipocytes in vitro and in vivo. WAT browning coincides with increased thermogenic capacity that is sufficient to restore cold tolerance to cold intolerant mice, which we suggest demonstrates the profound pharmacological potential of TR mediated browning. Given that GC-1 can increase adipocyte metabolism in a cell autonomous fashion and has been shown previously to evoke weight loss in non-human primates (Grover 2003), we believe there is strong potential that these results could be translated to man.
Experimental Procedures
Animals
Ucp1−/− mice (Jackson Laboratories), C57Bl/6 (Harlan) and ob/ob mice (Harlan) were housed at 22°C in a 12 hr light/dark cycle and fed ad libitum chow. At six weeks of age, C57Bl/6 and Ucp1−/− mice were fed a 60% kcal high-fat diet (Research Diets) for 8 – 10 wk, unless otherwise noted. For thermoneutrality, mice were individually housed at 30°C in an environment-controlled chamber. All animal experiments were approved by the Institutional Animal Care and Use Committee of Houston Methodist Research Institute.
Treatment
GC-1 was administered via ip injections (0.3 mg/kg/d GC-1) or admixed in chow (3 mg/kg-diet). For β-AR antagonist studies, propranolol (20 mg/kg) was co-administered with GC-1 (0.3 mg/kg) or propranolol alone via ip injection for 21 days. For KB2115 treatment, ob/ob were fed KB2115 admixed in chow (3 mg/kg-diet) for 21 days. Control groups received appropriate vehicle solutions or diets identical to treatment groups.
BAT Denervation
BAT denervation surgery was performed on ob/ob and C57Bl/6 mice at 3 to 4 weeks of age. Mice were anesthetized with isoflurane and body temperature was maintained with a warming pad. Intrascapular BAT lobes were elevated from the underlying cervical and scapular caudally to separate it from the surrounding muscle and expose sympathetic nerves. The five intercostal nerves of each lobe were isolated and a section of each nerve was removed without damaging the vasculature. The sham procedure was identical except nerves were not transected.
Primary Cell Culture
Mouse preadipocytes were collected from inguinal fat depots of 4-week old C57Bl6 or Ucp1−/− mice. Briefly, tissues were digested at 37°C for 45 min with collagenase I (1.5 mg/ml) and dispase (2.5 mg/ul) and then filtered through 100-μm and 40-μm cell strainers. The stromal vascular cells were cultured in DMEM/F-12 containing 10% FBS (Sigma). Confluent cells were exposed to adipocyte differentiation media for 48 hr and received fresh media containing insulin every 2 days. For TR agonist treatment, cells were treated with 100 μM of GC-1 or vehicle for the times indicated. For PKA inhibition, cells were pretreated with H-89 for 1 hr followed by NE for 4 hr.
Statistical Analysis
Data are presented as mean ± SEM. A p-value of less than 0.05 was considered significant. Student’s t-test was used for pairwise comparisons.
Supplementary Material
Acknowledgments
This work was supported in part by NIH RC4 DK090849 (J.D.B. and P.W.). S.M.H. was supported by NIH K01 DK09609 and the Alkek Center for Molecular Discovery with pilot grant funding provided by the Baylor College of Medicine Diabetes and Endocrinology Research Center (P30 DK079638). A.J.M. and D.D.G. were supported in part by Tecnológico de Monterrey, Dirección de Posgrado de la Escuela de Medicina (0020ENS325) and Consejo Nacional de Ciencia y Tecnología (387520). We thank Pradip Saha (BCM DRC; P30 DK079638) for technical support.
Footnotes
Conflict of interest: The authors have declared that no conflict of interest exists.
Author Contributions
Conceptualization, J.Z.L. and K.J.P.; Methodology, J.Z.L. and K.J.P.; Investigation, J.Z.L., A.J.M., S.L.C., D.D.G., D.W.T., and S.M.H; Writing – Original Draft, J.Z.L. and K.J.P.; Writing – Review & Editing, J.Z.L., S.L.C, A.B., and K.J.P.; Funding Acquisition, J.D.B. and K.J.P.; Supervision, J.D.B., K.J.P. and J.Å.G.
Publisher's Disclaimer: This is a PDF file of an unedited manuscript that has been accepted for publication. As a service to our customers we are providing this early version of the manuscript. The manuscript will undergo copyediting, typesetting, and review of the resulting proof before it is published in its final citable form. Please note that during the production process errors may be discovered which could affect the content, and all legal disclaimers that apply to the journal pertain.
References
- Abelenda M, Puerta ML. Brown adipose tissue thermogenesis in T3-treated rats. Hormone and Metabolic Research = Hormon- Und Stoffwechselforschung = Hormones Et Métabolisme. 1992;24(2):60–62. doi: 10.1055/s-2007-1003256. [DOI] [PubMed] [Google Scholar]
- Arch JRS. The discovery of drugs for obesity, the metabolic effects of leptin and variable receptor pharmacology: perspectives from beta3-adrenoceptor agonists. Naunyn-Schmiedeberg’s archives of pharmacology. 2008;378(2):225–240. doi: 10.1007/s00210-008-0271-1. [DOI] [PubMed] [Google Scholar]
- Cannon B, Nedergaard J. Brown adipose tissue: function and physiological significance. Physiological Reviews. 2004;84(1):277–359. doi: 10.1152/physrev.00015.2003. [DOI] [PubMed] [Google Scholar]
- Cinti S, et al. Morphologic Techniques for the Study of Brown Adipose Tissue and White Adipose TissueAdipose Tissue Protocols. Methods in Molecular Biology. 2001:21–51. doi: 10.1385/1-59259-231-7:021. Available at: http://www.springerprotocols.com/Abstract/doi/10.1385/1-59259-231-7:021. [DOI] [PubMed]
- Cousin B, et al. Occurrence of brown adipocytes in rat white adipose tissue: molecular and morphological characterization. Journal of Cell Science. 1992;103(4):931–942. doi: 10.1242/jcs.103.4.931. [DOI] [PubMed] [Google Scholar]
- Goldgof M, et al. The chemical uncoupler, 2, 4-dinitrophenol (DNP) protects against diet-induced obesity and improves energy homeostasis in mice at thermoneutrality. The Journal of Biological Chemistry. 2014;289(28):19341–19350. doi: 10.1074/jbc.M114.568204. [DOI] [PMC free article] [PubMed] [Google Scholar]
- Grover GJ. Effects of the thyroid hormone receptor agonist GC-1 on metabolic rate and cholesterol in rats and primates: selective actions relative to 3,5,3′-triiodo-L-thyronine. Endocrinology. 2003;145(4):1656–1661. doi: 10.1210/en.2003-0973. [DOI] [PubMed] [Google Scholar]
- Guerra C, et al. Emergence of brown adipocytes in white fat in mice is under genetic control. Effects on body weight and adiposity. Journal of Clinical Investigation. 1998;102(2):412–420. doi: 10.1172/JCI3155. [DOI] [PMC free article] [PubMed] [Google Scholar]
- Hall JA, et al. Absence of thyroid hormone activation during development underlies a permanent defect in adaptive thermogenesis. Endocrinology. 2010;151(9):4573–4582. doi: 10.1210/en.2010-0511. [DOI] [PMC free article] [PubMed] [Google Scholar]
- Harms M, Seale P. Brown and beige fat: development, function and therapeutic potential. Nature Medicine. 2013;19(10):1252–1263. doi: 10.1038/nm.3361. [DOI] [PubMed] [Google Scholar]
- Lee J-Y, et al. Triiodothyronine induces UCP-1 expression and mitochondrial biogenesis in human adipocytes. American Journal of Physiology - Cell Physiology. 2012;302(2):C463–C472. doi: 10.1152/ajpcell.00010.2011. [DOI] [PubMed] [Google Scholar]
- López M, et al. Hypothalamic AMPK and fatty acid metabolism mediate thyroid regulation of energy balance. Nature Medicine. 2010;16(9):1001–1008. doi: 10.1038/nm.2207. [DOI] [PMC free article] [PubMed] [Google Scholar]
- Lowell BB, et al. Development of obesity in transgenic mice after genetic ablation of brown adipose tissue. Nature. 1993;366(6457):740–742. doi: 10.1038/366740a0. [DOI] [PubMed] [Google Scholar]
- Martagón AJ, et al. The amelioration of hepatic steatosis by thyroid hormone receptor agonists is insufficient to restore insulin sensitivity in ob/ob mice. PloS One. 2015;10(4):e0122987. doi: 10.1371/journal.pone.0122987. [DOI] [PMC free article] [PubMed] [Google Scholar]
- Martinez de Mena R, Scanlan TS, Obregon M-J. The T3 receptor beta1 isoform regulates UCP1 and D2 deiodinase in rat brown adipocytes. Endocrinology. 2010;151(10):5074–5083. doi: 10.1210/en.2010-0533. [DOI] [PubMed] [Google Scholar]
- Melish JS. Thyroid Disease. In: Walker HK, Hall WD, Hurst JW, editors. Clinical Methods: The History, Physical, and Laboratory Examinations. Boston: Butterworths; 1990. [Accessed June 10, 2013]. Available at: http://www.ncbi.nlm.nih.gov/books/NBK241/ [PubMed] [Google Scholar]
- Meyer zu Schwabedissen HE, et al. Hepatic organic anion transporting polypeptide transporter and thyroid hormone receptor interplay determines cholesterol and glucose homeostasis. Hepatology (Baltimore, Md) 2011;54(2):644–654. doi: 10.1002/hep.24391. [DOI] [PMC free article] [PubMed] [Google Scholar]
- Nedergaard J, Bengtsson T, Cannon B. Unexpected evidence for active brown adipose tissue in adult humans. American Journal of Physiology - Endocrinology And Metabolism. 2007;293(2):E444–E452. doi: 10.1152/ajpendo.00691.2006. [DOI] [PubMed] [Google Scholar]
- Nedergaard J, Cannon B. The Browning of White Adipose Tissue: Some Burning Issues. Cell Metabolism. 2014;20(3):396–407. doi: 10.1016/j.cmet.2014.07.005. [DOI] [PubMed] [Google Scholar]
- Nguyen KD, et al. Alternatively activated macrophages produce catecholamines to sustain adaptive thermogenesis. Nature. 2011;480(7375):104–108. doi: 10.1038/nature10653. [DOI] [PMC free article] [PubMed] [Google Scholar]
- Ohtake M, Bray GA, Azukizawa M. Studies on hypothermia and thyroid function in the obese (ob/ob) mouse. American Journal of Physiology-Regulatory, Integrative and Comparative Physiology. 1977;233(3):R110–R115. doi: 10.1152/ajpregu.1977.233.3.R110. [DOI] [PubMed] [Google Scholar]
- Sato T, et al. Thyroid hormone-catecholamine interrelationship during cold acclimation in rats. Compensatory role of catecholamine for altered thyroid states. Acta Endocrinologica. 1986;113(4):536–542. doi: 10.1530/acta.0.1130536. [DOI] [PubMed] [Google Scholar]
- Sidossis L, Kajimura S. Brown and beige fat in humans: thermogenic adipocytes that control energy and glucose homeostasis. The Journal of Clinical Investigation. 2015;125(2):478–486. doi: 10.1172/JCI78362. [DOI] [PMC free article] [PubMed] [Google Scholar]
- Silva JE. Thyroid hormone control of thermogenesis and energy balance. Thyroid: official journal of the American Thyroid Association. 1995;5(6):481–492. doi: 10.1089/thy.1995.5.481. [DOI] [PubMed] [Google Scholar]
- Tiraby C, Langin D. Conversion from white to brown adipocytes: a strategy for the control of fat mass? Trends in Endocrinology & Metabolism. 2003;14(10):439–441. doi: 10.1016/j.tem.2003.10.001. [DOI] [PubMed] [Google Scholar]
- Trayhurn P, Beattie JH. Physiological role of adipose tissue: white adipose tissue as an endocrine and secretory organ. The Proceedings of the Nutrition Society. 2001;60(3):329–339. doi: 10.1079/pns200194. [DOI] [PubMed] [Google Scholar]
- Ukropec J, et al. UCP1-independent thermogenesis in white adipose tissue of cold-acclimated Ucp1−/− mice. The Journal of Biological Chemistry. 2006;281(42):31894–31908. doi: 10.1074/jbc.M606114200. [DOI] [PubMed] [Google Scholar]
- Visser WE, Friesema ECH, Visser TJ. Minireview: thyroid hormone transporters: the knowns and the unknowns. Molecular Endocrinology (Baltimore, Md) 2011;25(1):1–14. doi: 10.1210/me.2010-0095. [DOI] [PMC free article] [PubMed] [Google Scholar]
- Wang C-Z, et al. Triiodothyronine regulates distribution of thyroid hormone receptors by activating AMP-activated protein kinase in 3T3-L1 adipocytes and induces uncoupling protein-1 expression. Molecular and Cellular Biochemistry. 2014;393(1–2):247–254. doi: 10.1007/s11010-014-2067-6. [DOI] [PubMed] [Google Scholar]
- Wang QA, et al. Tracking adipogenesis during white adipose tissue development, expansion and regeneration. Nature Medicine. 2013;19(10):1338–1344. doi: 10.1038/nm.3324. [DOI] [PMC free article] [PubMed] [Google Scholar]
- Ye L, et al. Fat cells directly sense temperature to activate thermogenesis. Proceedings of the National Academy of Sciences of the United States of America. 2013;110(30):12480–12485. doi: 10.1073/pnas.1310261110. [DOI] [PMC free article] [PubMed] [Google Scholar]
Associated Data
This section collects any data citations, data availability statements, or supplementary materials included in this article.