

Abstract
Background
Chile has recently been reclassified by the World Bank from an upper middle income country to a higher income country. There has been great progress in the last 20–30 years in relation to air and water pollution in Chile. Yet after 25 years of unrestrained growth there remain clear challenges posed by air and water, as well as climate change. Methods: In late 2013 a three-day workshop on environmental health was held in Santiago, bringing together researchers and government policy makers. As a follow-up to that workshop, here we review the progress made in environmental health in the past 20–30 years, and discuss the challenges of the future. We focus on air and water pollution, and climate change, which we believe are among the most important areas of environmental health in Chile.
Results
Air pollution in some cities remains among the highest in the continent. Potable water is generally available, but weak state supervision has led to serious outbreaks of infectious disease and ongoing issues with arsenic exposure in some regions. Climate change modeling in Chile is quite sophisticated, and a number of the impacts of climate change can be reasonably predicted in terms of which areas of the country are most likely to be affected by increased temperature and decreased availability of water, as well as expansion of vector territory. Some health effects, including change vector-borne diseases and excess heat mortality, can be predicted. However, there has yet to be an integration of such research with government planning.
Conclusion
While great progress has been made, currently there are a number of problems. We suspect that the Chilean experience in environmental health may be of some use for other Latin American countries with rapid economic development.
Keywords: air pollution, climate change, water, Chile
Introduction
In 2013 the World Bank reclassified Chile from an upper middle-income country to a high-income country, based on having a gross national product (GNP) per capita level exceeding $12,600. The World Bank does not take economic inequality into account in determining a country’s status; Chile’s 2011 Gini index, an index of inequality (higher indicating more inequality) was 51, among the highest in Latin America, and 10 points higher than the Gini index for the US in 2010.1 In 2010 Chile became a member of the Organization for Economic Cooperation and Development (OECD), a grouping of 36 developed countries; among these countries, which include Turkey and Mexico, Chile has the highest Gini index.
Although a good indicator of overall disparity, the Gini index does not reflect inequalities within regions. In terms of economic activity, the north is dominated by mining. The center (the capital city of Santiago, main ports and agrarian valleys) concentrates political and financial power, as well as agricultural and industrial activity. Cattle, forestry and fishing occur mainly in the south. Population and production are both concentrated in Santiago (49.3% GDP) and Antofagasta, the main mining region in the north (10.4% of GDP) respectively).2 Poverty (defined as <$7,085/year income for a family of four), varies among regions from 4% in Antofagasta, up to 28% in the IX Region of Araucanía where the population of Mapuche ethnic origin is mostly settled (Figure 1). Furthermore, inequality varies distinctly within the country; data from 2003 showed that county-level Gini coefficients (then 55 for the whole country) varied widely across the country, from 41 to 62.3
Figure 1.

Regions of Chile by percentage of people under the poverty line (USD 7,085/year for families of four members) in 2013. Data from Chilean Ministry of Social Development.129
In relation to most countries in Latin America, Chile has had a long history of democracy, prior to the military coup in 1973. The period since 1939 laid the foundations for a successful industrial development under the state patronage, so that by mid-century the state owned or had interests in over a hundred of strategic enterprises such as transport, energy and water. Later, the exacerbation of historical political struggles for more structural changes ended in the 1973 military coup, which interrupted the democratic trail and drastically changed the state-oriented policy to an extreme open market-oriented system.4 Though the military regime was characterized by strong business development, it sharpened the extreme poverty and vulnerability of the poor. The return to democracy in 1990 began with 42% of the population under poverty, and with public social protection systems dismantled.5
Between 1990 and 2015 Chile has experienced an unprecedented growth and has managed to lower poverty to 14.4% (2013)6 however, this growth was mostly based on raw materials. The OECD, in a 2009 report, highlighted the impact of the accelerated growth on natural resources and the environmental burden generated by mining, agricultural and forest over-exploitation, as well as overcrowding in Santiago, which was pointed to as one of most polluted the cities in the world.7
Here we describe the state of environmental health in Chile, which may be seen as a model for the future of other Latin American countries as they become more developed. After the re-establishment of democracy and a period rapid economic growth, but with environmental concerns somewhat on the back burner, now is a good time to assess this the overall picture of environmental health in Chile, and consider how to move forward. We focus on air and water pollution, and on climate change, which are among the most important environmental issues in Chile.
The article reflects the findings of a workshop held in Santiago, Chile in October 2013, “Planning for a Global Environmental Health Hub Based in Chile,” which brought together researchers from around the country, as well as government personnel working in environmental health. The workshop was funded by the U.S. NIH Fogarty International Program, as part of a new initiative to support a multi-national network of regional hubs for Global Environmental and Occupational Health Sciences (GEOHealth).8 For details of the workshop see http://geohealthchile.blogspot.com/p/environmental-and-occupational-health.html. Chile, with a strong group of environmental health researchers, and a nucleus of technicians in government agencies devoted to environmental health, was considered as a possible area for a future GeoHealth Hub; our team was awarded a Fogarty Planning Grant for a GeoHealth Hub in Chile. However, when Chile was re-classified as a rich country in 2013, it became ineligible for Fogarty funding. We now plan that Chile will play an important role of south-south collaboration in environmental health training for a new GeoHealth Hub to be centered in Peru.
I. Air pollution: past and challenges
In the past 40 years, air quality in Chile became an issue of high concern given the growing proportion of population exposed to high levels. Santiago, the capital city with almost seven million inhabitants (40% of the country’s population), is located in a valley surrounded by mountains from the coastal and Andean ranges. Every winter this topography, along with an inverse temperature layer, limited rains, and minimal airstream, results in a low dispersion rate, insufficient to cope with the progressively higher concentration of pollutants emitted.9
As noted above, the country has undergone a period of accelerated economic and industrial growth, with cities occupying land previously used in agriculture.10,11 By the early 1990s Santiago had levels of air pollution comparable to megacities such as Sao Paulo and Mexico City, despite having barely one third of the population of these cities.12
Air quality monitoring in the metropolitan area of Santiago was initiated as early as 1974 and standards for criteria pollutants were established in 1978. However, regulatory plans began only in 1990, after the military dictatorship lost power. Key interventions of those plans aimed at reducing overall emissions, or were directed at specific pollutants such as leaded gasoline and sulfur in diesel fuel. PM10 and PM2.5 data, which were regularly collected only starting in 1989, showed significant reductions of pollutants in Santiago in the early years after policies reducing emissions were enacted (Figure 2). However, current PM2.5 levels in Santiago still surpass the 20 μg/m3 Chilean standard for PM2.5 established in 2012,13 as well as WHOs 10 μg/m3 annual standard.
Figure 2.
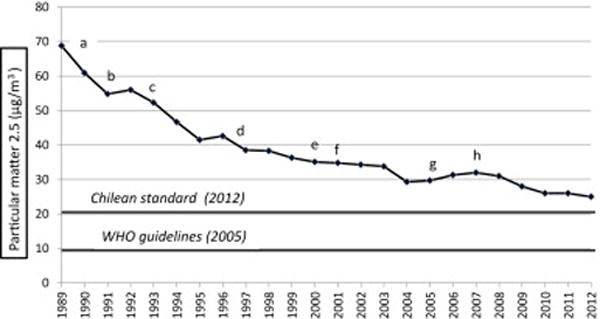
Evolution of annual mean PM2.5 in Santiago, 1989–2012. Interventions: a. 1990, removal of 3000 buses. b. 1991, income catalytic vehicles. c. 1993, sulfur reduction in diesel 5000 to 3000ppm. d. 1997, sulfur reduction in diesel 3000 to 1500ppm. e. 2000, sulfur reduction in diesel 1500 to 1000ppm. f. 2001, removal of lead. g. 2005, removal of 2200 buses. h. 2007, onset of new system of public transport. Source: Ministry of the Environment.16,122
The interventions to reduce air pollution in Santiago, while significant, were not sufficient to offset the growth of the city, particularly the increase of mobile sources and the increased use of wood for heating (due to its lower cost compared with gas or electric energy). The public and private vehicular fleet in Santiago has doubled since 2001, to the current 1,700,000 vehicles, accounting for 40% of the country’s fleet.14 After decades of monitoring and decontamination plans, Santiago in 2011 was still among the top five capitals in Latin America countries with the highest annual mean PM2.5 (Lima, 38 μg/m3; Guatemala city, 33 μg/m3; Tegucigalpa, 32 μg/m3, Bogota, 27 μg/m3, and Santiago, 26 μg/m3).15
In 2004 air monitoring expanded to other regions of the country, mainly due to the mandatory monitoring required for potentially polluting private companies. Currently the network of air quality monitoring has 130 private and 58 public stations nationwide that monitor PM10, PM2.5, CO, SO2, NOx and ozone.16 Five percent of the monitors are in Santiago.16
There are three air pollution areas of concern in Chile: 1): a north-central zone, with mining and thermal power production that generate particulate matter,17,18 as well as heavy metals and sulfur dioxide;19,20 2) a highly populated urban area (including Santiago) of industrial development and large vehicle fleet emitting particulate matter, carbon monoxide, sulfur dioxide and ozone; 3) and a cold-weather central-south area with heavy use of wood for domestic use. As seen in the introduction, the southern area has the largest proportions of poor families determining their higher vulnerability.3
There are very high levels of contaminants in some areas outside of Santiago. Four Chilean cities have been reported by WHO as being among the top five Latin-American cities with highest PM2.5 levels in 2011 (Rancagua 54 μg/m3; Chillán 53 μg/m3; Temuco 48 μg/m3 and Talca 44 μg/m3)21, although these rankings might partly reflect that there is more extensive regional air sampling in Chile compared to other countries. In the southern city of Coyhaique, daily air PM10 surpasses 350 μg/m³ in wintertime, far exceeding the Chilean daily standards for PM10 (150 μg/m³).16 This and other southern cities, where burning wood is common for heating, register more than 30 “emergency” days (with daily values for PM10 higher than 330 μg/m³). This finding has forced the environmental authority to declare decontamination plans for these areas, that over 10 years should bring down the three-year moving average level of the specific contaminant below the annual standard.22
Research on the health effects of air pollution is still relatively sparse. Most of this research had been time series studies on registered emergency visits,23–27 hospitalization28–30 and mortality associated with air pollutants.31–39 In the exposure sphere, some studies have measured personal exposure to particulate matter,40 others have proposed models to predict the levels of pollutants,41 or have identified the source apportionment of outdoor particulate matter.42 Only a few publications have aimed at evaluating the economic significance of contaminants reduction,43 and there are only a few publications dealing with indoor air pollution and its health effects.44,45 As expected, studies concentrate primarily on the Santiago Metropolitan Region,23–27,33,34,44 with a some notable exceptions.35,37,45,46
These studies have reported relative risks (RRs) in Santiago for respiratory mortality in the elderly of 1.05–1.10 for each 100 μg/m3 PM10,47 while in Temuco the RRs were higher, suggesting that particles could be more dangerous due to chemical composition.35 In terms of morbidity, increases of 100 μg/m3 of PM10 were associated with elevated risks of acute respiratory infection (RR 1.16, IC95% 1.14–1.18) and hospital admissions (RR 1.14, IC95% 1.09–1.18) in those >65 year of age.37 Another study conducted in Temuco between August 2009 and June 2011 assessed the daily concentration of ultrafine particles (UFP), i.e. ≤100nm, and its relationship to daily outpatient visits for respiratory causes in health centers. The authors reported UFP values between 1.62 and 25.81 μg/m3 and significant risk in people older than 65 years for each 4.73 μg/m3 (interquartile range) increase (RR=1.15; 95% CI 1.059–1.25).46 Chemical speciation of fine particles has been studied, showing that PM2.5 with high content of zinc, chromium, copper, sodium, and sulfur was more strongly associated with mortality than PM2.5 mass.48 Overall, these reported RRs are consistent with those found in developed industrialized countries, but it has been important to document these effects in Chile in terms of influencing public policy.
Future studies of air pollution effects need to be considered in conjunction with climate change, since sources as burning fossil fuels and biomass are common to both.49–51 For example, a recent study (done outside of Chile) shows that the effect of low or high temperature on mortality is modified by air pollution, and suggests that the reduction in the emission of particulate matter is closely related to a decrease in mortality in extreme temperatures.50
II. Water: past and challenges
In a short time span, water provision and treatment in Chile has changed substantially, from state management with widely subsidized prices, to private sector management. Private companies were granted water rights provide water, sewage, and waste treatment, and are allowed a profit of 7% by law.
By the beginning of the 1970s, concurrent with the high rates of urban expansion, Chilean cities reached 75% coverage of potable water and 40% coverage of sanitation. Thereafter, under the military dictatorship (1973–1990), urban coverage of potable water reached more than 95%. Yet, it should be noted that the official figures did not consider the high degree of disconnection of users for non-payment, which was estimated at 30%, given the low wages and unemployment at the time. This situation led to a system of targeted subsidies for the poor.52
With the return to democracy in 1990, the water sector was modernized.53 By the end of the decade the drinking water systems, still under state management, had achieved high efficiency but with significantly higher tariffs for consumers. This happened in a context of unprecedented economic growth but with high socioeconomic inequality54 (those in the top 10% of income had 45% of national income in 2000)55, thus requiring increased subsidies to the poorest.56
Following proposals from international agencies, the government sold water and infrastructure rights to private enterprises in the late 1990s. The justification, still under debate,57,58 focused on the inability of the state to make investments in wastewater treatment, which at the time was virtually nonexistent.59 The cholera epidemic at the beginning of the 1990s was a potent warning, perhaps more for its impact on exports than for its health significance,60 since the epidemic was promptly stopped with focused interventions.61
Figure 3 shows the evolution of urban coverage of supply, sewerage and wastewater treatment. At the beginning of the 1990s only 2.8% of the urban population lacked access to potable water, but a significant number had no access to sewerage and there was virtually no wastewater treatment. Wastewater treatment was implemented and reached the current coverage close to 98%, but only after users funded the cost.52,62
Figure 3.
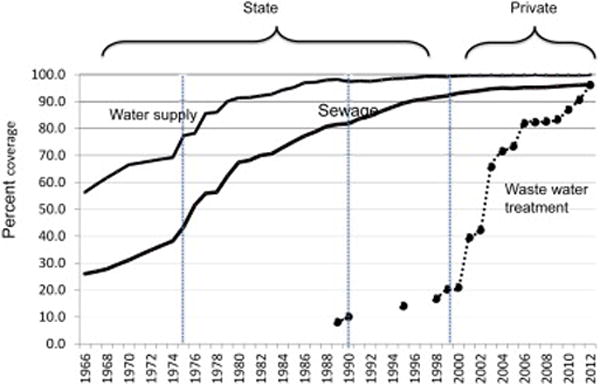
Historical coverage of urban sanitation in Chile 1966–2012.
Data Source: Superintendence of Sanitary Services (SISS).62
The high availability of potable water and adequate sanitation in urban areas, coupled with targeted interventions in children’s health, helped lower infant mortality from 119.5 per 1000 live births (one of the highest in Latin America) in the 1960s to 16.0 in the 1990s and 7.4 in 2012, one of the lowest rates in the continent.63 Two indicators of improved sanitation, typhoid fever and hepatitis rates, fell sharply in the wake of targeted interventions to curb the epidemic of cholera in the country in the early 1990s (Figure 4).64 Although there was one peak of hepatitis in 2002–2003, since then there has been a steady decline. The Hepatitis A vaccine, although available for the wealthy under the private health system (covering 13% of the population in 2011), has not been available to a wider public except for a few targeted campaigns, so it is unlikely that the large fall in hepatitis rates was due to vaccination.
Figure 4.
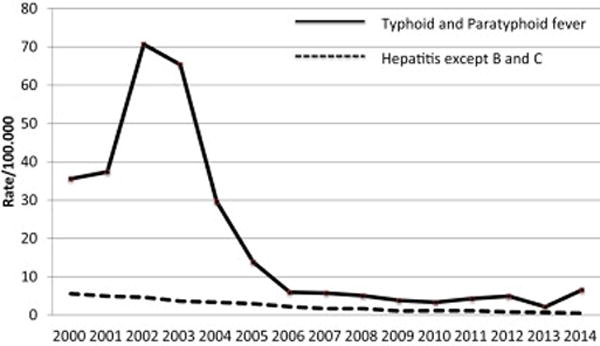
Trends in hepatitis and typhoid fever, Chile 2000–2014.
Source: Department of Statistics Ministry of Health, Chile,130 and National Institute of Statistics.131
Another challenge has been the long-standing problem of arsenic in water, which has affected communities in northern Chile, especially the city of Antofagasta, located in the desert. Between 1958 and 1971, this city had very high water arsenic levels, averaging 0.86 mg/L.65 Strong complaints forced the installation of a first abatement plant in 1970, resulting in a lowering to 0.12 mg/L, still high compared to the WHO 1963 standard of 0.05 mg/L.66 The current Chilean standard was set as 0.01 mg/L in 2005, although allowing temporary levels as high as up to 0.03 for ten years.67 Health effects of arsenic in the highly exposed populations in the north of Chile have been widely documented, with excesses of lung cancer,68 bladder cancer,69 and heart disease, which decreased as arsenic concentrations decreased.70
Overall, Chile appears to have been successful with regard to its water treatment. However, water coverage is still limited in some rural areas. Rural water is supplied through cooperatives, which register 99% coverage in more populated areas but only 7% in semi-populated and 2% in low-populated areas.71 In addition, some rural communities also lack sewerage;72 and in specific northern regions, rural areas are also still exposed to high arsenic content in water.73
The state role remains relatively weak in water regulation; it is focused on commercial aspects such as setting rates, granting concessions, and supervising that services are delivered. On the other hand, surveillance of water quality relies on companies self-monitoring with the support of accredited private laboratories, but with rather loose control from the state. Each company (currently 60 nationwide),74 report compliance (yes/no) of each regulated item in one sample per month.75
Compliance is high for mandatory parameters such as total coliforms, turbidity and residual free chlorine for urban water companies. But other data may be incomplete. For example in December 2013, only 54% of monthly reports (386/720) included arsenic measurement and 2% (8/386) surpassed the current maximum allowance of arsenic in potable water, with levels between 0.01 and 0.03 mg/L.75 Other parameters that occasionally do not meet national regulations are nitrates (88.2% compliance) and sulfates (64.3% compliance), even under considerably more lax standards (respectively 50 mg/L and 500 mg/L) than, for example, the U.S. EPA requirements (10 and 250 mg/L respectively).76,77 Nitrates should be an agent of concern, particularly in agricultural regions, as they can be an indicator of contamination by fertilizers, or organic wastes.78
Furthermore, failures in the current system have occurred. In 2010 and 2013, important norovirus outbreaks occurred in two cities, affecting at least 40,000 persons. In one case, treated wastewater which was still contaminated was used for vegetable irrigation, and entered the food chain, which led to questioning the efficacy of regulations.79 In the other case, the origin of the outbreak was attributed to direct contamination of drinking water, showing failures of surveillance in basic parameters of fecal contamination.80 Both cases affected cities in northern Chile where water is scarce, a situation that according to the scenarios of climate change will get worse (see below).
Chilean water standards have been slow to change, compared to international standards that have become stricter over time. Compared to the current WHO standards, Chilean regulation includes 23 less agents (especially pesticides); and among those which are included, the WHO reference value is between 0.5 and 20 times more stringent than the Chilean national standard.81,82 It seems likely that Chilean standards have been slow to change due to several factors, including insufficient government attention to environmental problems, the opposition of private water companies, and a lack of public pressure.
Finally, as noted below, Chile is affected by natural climatic phenomena and since 2003, by a persistent drought. Rivers, lakes and reservoirs are depleted, a worrying preview of the drying trend expected with climate change (see below). Yet, though scarcity may be a concern, experts have cited good water governance as a key for managing mitigation and adaptation under scientific uncertainties, and have recommend policy changes to promote transparency, accountability, and co-ordination among pertinent institutions.83,84 Among OECD countries, Chile appears as one of the least prepared for water shortages, with high fragmentation among regulatory agencies.85
III. Climate change: past and future
There are unambiguous indications of a planetary-scale climate change, as reflected in the warming of the troposphere and upper ocean, decrease in snow and ice coverage, rise in sea level,86 and an overall global trend towards drying in dry regions and wetting in wet regions.87,88 The magnitude and rate of these changes are unprecedented and largely attributed to the human-driven increase in the atmospheric concentration of greenhouse gases, as well as massive changes in land-use.
Climate change at a regional scale (e.g., subtropical South America) is more complicated than at the global scale, because of more variability in year-to-year and decade-to-decade fluctuations of atmospheric and oceanographic conditions. A 2011 report from Chile to the United Nations Framework Convention on Climate Change provides a good background on climate change on Chile.89 Here we seek to provide a summary and update of this information, as well as to discuss potential health effects of climate change in Chile.
In the case of central and northern Chile, there has been a warming trend of about +0.15°C per decade in the inland valleys and Andean foothills (e.g., Santiago) observed over the last few decades, in sharp contrast with a cooling trend of similar magnitude along the coast and offshore (e.g., Antofagasta) (Figure 5).90,91 Much weaker temperature trends are observed to the south of Santiago (below 35°S). Superimposed on these trends one can observe the impact of ENSO on the temperature record: there is a coastal warming during El Niño years and La Niña years feature an overall cooling.
Figure 5.
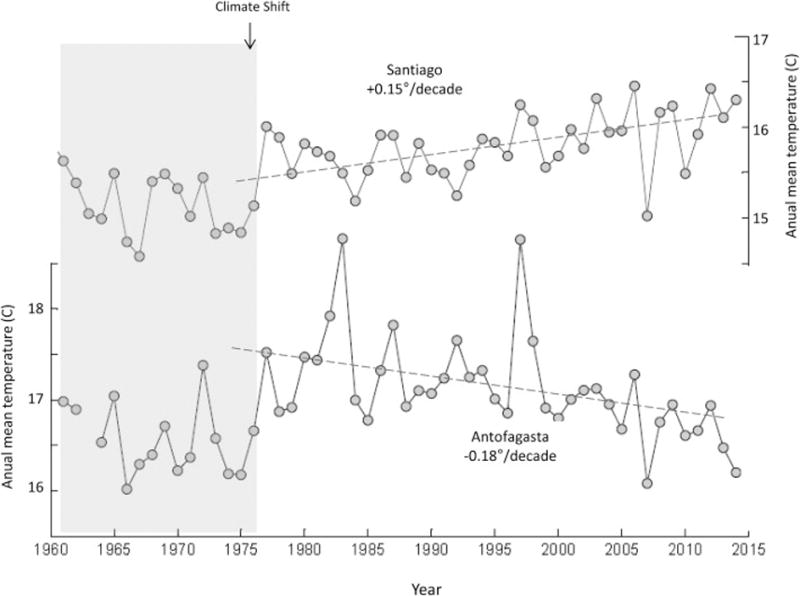
Time series of the annual mean temperature at Santiago (upper red line) and Antofagasta (lower blue line) from 1960 to 2013.
Also prominent in Figure 5 is a climate shift that took place in the mid-1970s both at the coast and inland: the decade after the shift has a mean temperature ∼0.5°C warmer than the mean temperature before. It is thought that such climate shift has a natural origin and exhibits an ENSO-like structure.92
Precipitation records reveal a drying trend in south-central Chile (most pronounced between 37–44°S) during the last four decades. No significant trends are detected in central Chile or farther north where the impact of the ENSO-cycle is particularly prominent.93 As an example, the annual precipitation in Santiago (average 280 mm) varied from 710 mm in 1997 (El Niño year) to 90 mm in 1998 (La Niña year).
Projections for the climate during the rest of 21st century are based on numerical models of the coupled atmosphere-ocean systems, run at global scale (Global Circulations Models: GCM) or regional scale (Regional Circulations Models: RCM). In the current generation of model integrations performed in support of AR5 (the IPCC Fifth Assessment Report), the so-called representative concentration pathways (RCPs) consider a wide range of options of population growth and socioeconomic development, each of them leading to distinct greenhouse gas concentrations in the future. Which RCP will actually occur is unknown, yet has major consequences for the magnitude and timing of the climate change that will be felt in Chile. As an example, the global mean temperature is projected to increase between 0.5°C (under RCP2.6) and 4.0°C (under RCP8.5) towards the end of the century relative to current values.86
Along continental Chile, different GCMs and RCMs produce projections differing in magnitude, but not in direction.86,94 Generally, the projected trends are similar to those observed in the last few decades. Considering a continuation of the heavy emission scenario sustained during the rest of century, there is an overall predicted warming in north-central Chile that is modest along the coast (+1°C above current values) and increases inland to reach a maximum over the Andes (up to +4°C) (Figure 6a), as well as a drying trend in central-south Chile that can reduce annual precipitation to 70–80% of the current values (i.e., a rainfall deficit between 20–30%; see Figure 6b).
Figure 6.
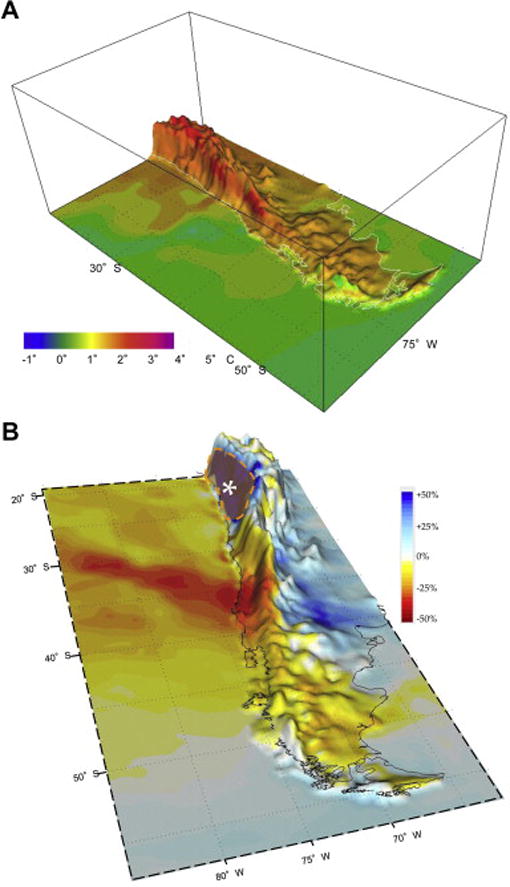
Projected climate change in Chile as simulated by the model PRECIS.132 The Chile-Argentina border (dashed line) follows the crest of the Andes. (a) Difference in annual mean surface temperature (in °C) between the future (average 2070–2100) under the A2 emission scenario, and the baseline period (1960–1990). Note the warming everywhere but most marked over the Andes cordillera. (b) Relative change in precipitation (expressed in %) between the future (average 2070–2100) under the A2 emission scenario and the baseline period (1960–1990). The change is calculated as the difference between the values in future and baseline period divided by the values in the baseline period. This ratio is misleading in northern Chile (signaled by the large asterisk) because the baseline precipitation is very low (Atacama desert).
These projections suggest that some impacts on public health may be expected over the long term (see below). This situation is exemplified by the drought that has afflicted central Chile since 2009, likely due to a persistent La Niña-like condition in the central Pacific. Whether or not this drought continues for the next five years depends on the internal variability of the atmosphere-ocean system. Currently, there is little ability to predict this kind of inter-annual/inter-decadal variability. Likewise, significant year-to-year fluctuations in temperature and precipitation will continue to characterize our climate in the near and far future. These ENSO-related anomalies can produce short-lived but intense climate extremes, with the potential to trigger vector-borne diseases and affect other health outcomes.
While there is a large body of scientific literature on the effect of climate change on the incidence of vector borne diseases, potential impacts in Chile have not been described.95
Chagas disease, transmitted by Triatoma infestans affects 1.5% of rural population, and is endemic north of the capital city.96 Warmer climate has been associated to vector spread of the Chagas vector, including decreased mortality, increased fertility, higher proportion infected and wider breadth of range.97–108 In Chile, unexpected wild foci have been detected in uninhabited rural setting,109,110 suggesting that this new non-domestic rural setting for T. infestans may be related to warming ensuing an ENSO episode. Aedes aegypti, the vector of dengue, was last reported in 1961 in continental Chile but in 2000 new populations were detected in Chile’s Easter Island,111 followed by a severe outbreak in 2002. It reappeared in 2006 and intermittently up to now, giving rise to fear that it could reach the mainland.112 Finally, the rodent-borne Hanta virus disease is endemic in Chile since 1995. Increased rainfalls result in increased plant productivity, which in turn give rise to higher rodent populations ultimately followed by increases in human cases.113,114 This dynamic has been studied in relation to rains during El Niño.115–118 More extreme precipitation events accompanying climate change may increase rodent population and Hanta virus cases.
Regarding the effects of climate change on air and water quality, some educated guesses can be made. In south-central Chile, wintertime air pollution episodes are mostly produced by particulate matter that are associated with cool, stable and dry atmospheric conditions.119 On the other hand, models consistently predict a warming-drying trend for this region. Given the already semi-arid climate of central Chile, the drying trend is likely the most important driver in this region, leading to an increase in wintertime air-pollution episodes in cities like Santiago because of the dramatic reduction of rainfall episodes that tend to clean the troposphere. The warming trend may be the more important driver in the humid southern Chile, and the most probable outcome is a reduction of air pollution episodes in cities like Temuco, by reducing the number of very cold nights, when particulate matter is trapped in the lower troposphere. Summertime air pollution events are largely produced by increase in lower-tropospheric ozone, whose rate of production increases with air temperature. Thus, the projected warming trend is conducive to an increase in this type of episode.
The projected increase in air temperature will also modify the annual cycle of stream flow. Currently, the peak flow occurs around December in Andean valleys of central Chile, but less precipitation and warmer temperatures could lead to a more rapid snowmelt and earlier peak flow, thus causing an extended and more intense dry season.
There are some studies projecting the availability of surface water resources under climate change scenarios.120,121 Given the projected reduction of precipitation (between 20–30% of the baseline values), the annual mean flow in rivers should also drop. The flow reduction is about 10% more acute than its precipitation counterpart, given the increased losses by evaporation in a warmer climate. Reductions in surface water flows would reduce the Chilean capability of hydropower generation, which has the potential to increase greenhouse gas emissions due to increased reliance on thermal energy sources if renewable sources do not emerge as an effective alternative. The fate of Chilean aquifers has not yet been sufficiently investigated, but the drying trend in south-central Chile will eventually reduce groundwater levels. Furthermore, pressure on groundwater will likely intensify with reductions in surface flows, as evidenced by the current prolonged drought period.122 Likewise, less precipitation and higher temperatures will result in shrinking glaciers although a detailed, quantitative estimate of this reduction is not yet known.
Less water in the rivers will have a negative impact especially for agriculture, which currently uses 73% of the available water in Chile.123 The impact would differ in the geographical regions. Decreased quality and quantity of crops may be expected in the north, affected by severe drought, hot temperature in the inland, and decreased availability of water.89 Agricultural areas may be pushed to the south, changing the type of crops as seen lately in southern Araucania (Chile’s poorest region) and Los Lagos Regions, where corn and potatoes production increased up to 200% due to favorable balance of rainfall and maximum-minimum daily temperature range.124 Other anticipated effects include rises of meat prices due to less viability of cattle production, and migration of agricultural workers to southern areas or to the cities.89 Possible adaptation strategies include genetically improved crops, more efficient use of irrigation systems, and sustainable management of groundwater.89
Research on health effects of climate change should incorporate the impact of extreme hydro-climatic events as the one seen recently (March 2015) in the north, where an unexpected rainfall exceeded the 18mm annual average, causing floods of water and mud, killing thirty people and posing serious health risks to the survivors. The most affected are the poor in the north, an area where inequality is very high, who live in areas most likely to be affected by the risks of water scarcity and contamination, and flooding.
Children are of special concern for possible health effects of climate change, since they are more vulnerable to these threats.125 An area of future research should be the differential health impacts of climate change in Chile on children.
Discussion
This overview of the current state of the environment and environmental health research in Chile illustrates the limitations of the “neoliberal” model of development in recent years, i.e., free markets with little state intervention. In the case of water there have been notable successes in terms of basic sanitation and availability of safe drinking water. But state control remains spotty and private water companies may not regulate themselves sufficiently, as the recent outbreaks of norovirus suggest.126
The case of air pollution is another example where Chile has met with some success, but there are still persistently high pollutants in parts of the country. In spite of arduous efforts over 25 years to lower PM2.5 levels, Chile has failed to reach national air pollution standards for PM2.5 (20 μg/m3) in the capital, while other cities are contaminated at even higher levels due to mobile sources, large fossil fuel power plants, and primitive use of wood in homes of central-south Chile. These flaws are likely to be typical of environmental progress in many Latin American countries emerging from poverty: initial successes followed by stagnation.
The threat of climate change adds urgency. As many of the same sources of greenhouse gases (GHG) affect both climate change and air pollution, most experts believe that these issues should be addressed in a coordinated manner.49,127 Climate change is also likely to result in water shortages in southern Chile, again requiring coordination with agencies regulating water, to address this problem.
In 2010 Chile joined the OECD, a group of high-income countries, and recently was officially classified as a high-income country by the World Bank. However, economic inequality is far higher than other OECD countries.125 In our view, Chile should take advantage of its new status to readjust its institutions regarding the environment, in order for them to work in a transparent, coordinated and cooperative manner.85,127 Profound structural changes will be required in Chile to reach the higher environmental standards of OECD countries.128
Research on environmental health to date in Chile has been largely insufficient, and has lacked a multi-disciplinary approach. Lack of funds from the state, lack or difficult access to private and even public data, and unreliable laboratory capabilities pose significant limitations to environmental health research. Chile has one of the leading economies in Latin America, and a growing body of researchers in environmental health. With this strong foundation, the government and the research community of Chile can and should identify and implement necessary changes to move beyond the current somewhat stagnant environmental health situation. It is likely that other emerging economies in Latin America are or soon will be coming to a similar juncture. If Chile can find a way to move forward, perhaps it can be a model not only for economic progress but also for progress in environmental health.
Acknowledgments
To Julio Monreal by his helpful discussion and comments in the water section. To Fernando Muñoz and Ivan Brstilo who provided information regarding the hepatitis A vaccine in Chile. To speakers and attendees of Geo-Hub workshop held in October 2013, for their valuable contributions to the discussion of the issues analyzed in this manuscript.
Funding: This study was supported by NIH Research Grant #D43TW005746-02
Footnotes
Competing interest: The authors have no competing interests to declare.
Role of authors in writing the manuscript: PP, KS, conception, overall writing/editing, review of the manuscript and approval of the final version. KL, LN conception and design of the manuscript, critical review and approval of the final version. VI, RG, SC, MC, SB, WF, writing of specific sections of the manuscript, and approval of the final version.
References
- 1.World Bank. World Development Indicators. 2014 http://datos.bancomundial.org/indicador/NY.GDP.MKTP.KD.ZG/countries/. Accessed March, 1th, 2015.
- 2.Central Bank of Chile. Series of Indicators (Excel) 2015 http://www.bcentral.cl/estadisticas-economicas/series-indicadores/index_aeg.htm. Accessed , April 28, 2015.
- 3.Agostini C, Brown P. Desigualdad geográfica en Chile. Revista de Análisis Económico. 2007;22(1):3–33. http://www.rae-ear.org/index.php/rae/issue/view/13. Accessed April 29, 2015. [Google Scholar]
- 4.Rex A Hudson. Washington: GPO for the Library of Congress; 1994. Chile: A Country Study. http://countrystudies.us/chile/. Accessed , April 30, 2015. [Google Scholar]
- 5.Contreras D. Poverty and inequality in a rapid growth economy: Chile 1990–1996. Journal of Development Studies. 2003;39(3):181–200. [Google Scholar]
- 6.CASEN. Results of Encuesta CASEN 2013: a modern and transparent ssessment of poverty for Chile. 2013 http://observatorio.ministeriodesarrollosocial.gob.cl/documentos/Presentacion_Resultados_Encuesta_Casen_2013.pdf. Accessed , April 20, 2015.
- 7.OECD. OECD Territorial Reviews: Chile. 2009 DOI: http://dx.doi.org/10.1787/9789264060791-en. Accessed , April 28, 2015.
- 8.Rosenthal J, Jessup C, Felknor S, Humble M, Bader F, Bridbord K. International environmental and occupational health: From individual scientists to networked science Hubs. Am J Ind Med Dec. 2012;55(12):1069–1077. doi: 10.1002/ajim.22130. [DOI] [PMC free article] [PubMed] [Google Scholar]
- 9.O’Ryan R, Larraguibel L. Contaminación del aire en Santiago: ¿qué es, qué se ha hecho, qué falta? Revista Perspectivas (Departamento de Ingeniería Industrial, Universidad de Chile) 2000;4(1):153–191. [Google Scholar]
- 10.Ferrando F. Santiago de Chile: antecedentes demográficos, expansión urbana y conflictos. 2008 http://revistaurbanismo.uchile.cl. Accessed March 1st, 2015.
- 11.Ministerio de Agricultura. Estudio de Impacto de la Expansión urbana sobre el sector Agrícola en la Región Metropolitana de Santiago. 2012 http://www.bcn.cl/obtienearchivo?id=documentos/10221.1/36198/9/Estudio_Impacto_Expansi%C3%B3n_Urbana_Producto_N%C2%B08InformeFinal.pdf. Accessed March 1st, 2015.
- 12.Romieu I, Weitzenfeld H, Finkelman J. Urban air pollution in Latin America and the Caribbean: health perspectives. World Health Stat Q. 1990;43(3):153–167. [PubMed] [Google Scholar]
- 13.Ministerio del Medio Ambiente. Establece Norma Primaria de Calidad Ambiental Para Material Particulado Fino Respirable MP2,5. 2011 http://bcn.cl/1m1af. Accessed March 1st, 2015.
- 14.Instituto Nacional de Estadística Chile. Anuarios parque de vehículos en circulació. 2015 http://www.ine.cl/canales/chile_estadistico/estadisticas_economicas/transporte_y_comunicaciones/parquevehiculos.php. Accessed January 30th, 2015.
- 15.World Health Organization. Ambient (outdoor) air pollution database, by country and city. Ambient (outdoor) Air Pollution in Cities Database. 2014 http://www.who.int/entity/quantifying_ehimpacts/national/countryprofile/aap_pm_database_may2014.xls?ua=1. Accessed March 1st, 2015.
- 16.Ministerio del Medio Ambiente. Estadísticas de Parámetros Contaminantes. 2015 http://sinca.mma.gob.cl/index.php/estadisticas. Accessed March 2nd, 2015.
- 17.Generadoras de Chile AG. Boletín del Mercado Electrico, Sector Generació. 2015 http://generadoras.cl/wp-content/uploads/Bolet%C3%ADn-Enero-2015.pdf. Accessed March 17th, 2015.
- 18.US Energy Information Administration. Country Analysis Note: Chile. Countries. 2014 http://www.eia.gov/countries/country-data.cfm?fips=ci. Accessed March 15th, 2015.
- 19.Sanchez J, Romieu I, Ruiz S, Pino P, Gutierrez M. Acute effects of the breathing of industrial waste and of sulfur dioxide on the respiratory health of children living in the industrial area of Puchuncavi, Chile. Revista panamericana de salud publica = Pan American journal of public health. 1999 Dec;6(6):384–391. doi: 10.1590/s1020-49891999001100003. [DOI] [PubMed] [Google Scholar]
- 20.Iglesias V, Burgos S, Marchetti N, Silva C, Pino P. Urinary Nickel in children residing near power plants. Rev Med Chile. 2008;136(8):7. [Google Scholar]
- 21.World Health Organization. Ambient (outdoor) air pollution database, by country and city. Ambient (outdoor) Air Pollution in Cities Database. 2014 ( http://www.who.int/phe/health_topics/outdoorair/databases/cities/en/). Accessed March 1th, 2015.
- 22.Ministerio del Medio Ambiente. Planes de Descontaminación Atmosférica Estrategia. 2014:2014–2018. http://www.mma.gob.cl/1304/articles-56174_PlanesDescontaminacionAtmosEstrategia_2014_2018.pdf. Accessed March 1th, 2015.
- 23.Ilabaca M, Olaeta I, Campos E, Villaire J, Tellez-Rojo MM, Romieu I. Association between levels of fine particulate and emergency visits for pneumonia and other respiratory illnesses among children in Santiago, Chile. J Air Waste Manag Assoc. 1999 Sep;49(9 Spec No):154–163. doi: 10.1080/10473289.1999.10463879. [DOI] [PubMed] [Google Scholar]
- 24.Ostro BD, Eskeland GS, Sanchez JM, Feyzioglu T. Air pollution and health effects: A study of medical visits among children in Santiago, Chile. Environ Health Perspect. 1999 Jan;107(1):69–73. doi: 10.1289/ehp.9910769. [DOI] [PMC free article] [PubMed] [Google Scholar]
- 25.Prieto CM, Mancilla FP, Astudillo OP, Reyes PA, Roman AO. Excess respiratory diseases in children and elderly people in a community of Santiago with high particulate air pollution. Rev Med Chil. 2007 Feb;135(2):221–228. doi: 10.4067/s0034-98872007000200012. [DOI] [PubMed] [Google Scholar]
- 26.Munoz F, Carvalho MS. Effect of exposure time to PM(10) on emergency admissions for acute bronchitis. Cad Saude Publica. 2009 Mar;25(3):529–539. doi: 10.1590/s0102-311x2009000300008. [DOI] [PubMed] [Google Scholar]
- 27.Leiva GM, Santibanez DA, Ibarra ES, Matus CP, Seguel R. A five-year study of particulate matter (PM2.5) and cerebrovascular diseases. Environ Pollut. 2013 Oct;181:1–6. doi: 10.1016/j.envpol.2013.05.057. [DOI] [PubMed] [Google Scholar]
- 28.Dales RE, Cakmak S, Vidal CB. Air pollution and hospitalization for headache in Chile. Am J Epidemiol. 2009 Oct 15;170(8):1057–1066. doi: 10.1093/aje/kwp217. [DOI] [PMC free article] [PubMed] [Google Scholar]
- 29.Cakmak S, Dales RE, Vidal CB. Air pollution and hospitalization for epilepsy in Chile. Environ Int. 2010 Aug;36(6):501–505. doi: 10.1016/j.envint.2010.03.008. [DOI] [PubMed] [Google Scholar]
- 30.Dales RE, Cakmak S, Vidal CB, Rubio MA. Air pollution and hospitalization for acute complications of diabetes in Chile. Environ Int. 2012 Oct 1;46:1–5. doi: 10.1016/j.envint.2012.05.002. [DOI] [PubMed] [Google Scholar]
- 31.Sanhueza P, Vargas C, Jimenez J. Daily mortality in Santiago and its relationship with air pollution. Rev Med Chil. 1999 Feb;127(2):235–242. [PubMed] [Google Scholar]
- 32.Ostro B, Sanchez JM, Aranda C, Eskeland GS. Air pollution and mortality: results from a study of Santiago, Chile. J Expo Anal Environ Epidemiol. 1996 Jan-Mar;6(1):97–114. [PubMed] [Google Scholar]
- 33.Salinas M, Vega J. The effect of outdoor air pollution on mortality risk: an ecological study from Santiago, Chile. World Health Stat Q. 1995;48(2):118–125. [PubMed] [Google Scholar]
- 34.Cifuentes LA, Vega J, Kopfer K, Lave LB. Effect of the fine fraction of particulate matter versus the coarse mass and other pollutants on daily mortality in Santiago, Chile. J Air Waste Manag Assoc. 2000 Aug;50(8):1287–1298. doi: 10.1080/10473289.2000.10464167. [DOI] [PubMed] [Google Scholar]
- 35.Sanhueza P, Vargas C, Mellado P. Impact of air pollution by fine particulate matter (PM10) on daily mortality in Temuco, Chile. Rev Med Chil. 2006 Jun;134(6):754–761. doi: 10.4067/s0034-98872006000600012. [DOI] [PubMed] [Google Scholar]
- 36.Cakmak S, Dales RE, Vidal CB. Air pollution and mortality in Chile: susceptibility among the elderly. Environ Health Perspect. 2007 Apr;115(4):524–527. doi: 10.1289/ehp.9567. [DOI] [PMC free article] [PubMed] [Google Scholar]
- 37.Sanhueza PA, Torreblanca MA, Diaz-Robles LA, Schiappacasse LN, Silva MP, Astete TD. Particulate air pollution and health effects for cardiovascular and respiratory causes in Temuco, Chile: a wood-smoke-polluted urban area. J Air Waste Manag Assoc. 2009 Dec;59(12):1481–1488. doi: 10.3155/1047-3289.59.12.1481. [DOI] [PubMed] [Google Scholar]
- 38.Cakmak S, Dales RE, Rubio MA, Vidal CB. The risk of dying on days of higher air pollution among the socially disadvantaged elderly. Environ Res. 2011 Apr;111(3):388–393. doi: 10.1016/j.envres.2011.01.003. [DOI] [PubMed] [Google Scholar]
- 39.Romieu I, Gouveia N, Cifuentes LA, et al. Multicity study of air pollution and mortality in Latin America (the ESCALA study) Res Rep Health Eff Inst. 2012 Oct;(171):5–86. [PubMed] [Google Scholar]
- 40.Suarez L, Mesias S, Iglesias V, Silva C, Caceres DD, Ruiz-Rudolph P. Personal exposure to particulate matter in commuters using different transport modes (bus, bicycle, car and subway) in an assigned route in downtown Santiago, Chile. Environ Sci Process Impacts. 2014 May;16(6):1309–1317. doi: 10.1039/c3em00648d. [DOI] [PubMed] [Google Scholar]
- 41.Alvarado SA, Silva CS, Caceres DD. Modeling critical episodes of air pollution by PM10 in Santiago, Chile. Comparison of the predictive efficiency of parametric and nonparametric statistical models. Gac Sanit. 2010 Nov-Dec;24(6):466–472. doi: 10.1016/j.gaceta.2010.07.008. [DOI] [PubMed] [Google Scholar]
- 42.Jorquera H, Barraza F. Source apportionment of ambient PM2.5 in Santiago, Chile: 1999 and 2004 results. Sci Total Environ. 2012 Oct 1;435–436:418–429. doi: 10.1016/j.scitotenv.2012.07.049. [DOI] [PubMed] [Google Scholar]
- 43.Cerda AA, Garcia LY. Hypothetical health and economic benefits associated with a reduction in air pollution in a Chilean city (Talca) Rev Med Chil. 2010 Nov;138(11):1395–1402. [PubMed] [Google Scholar]
- 44.Pino P, Walter T, Oyarzun M, Villegas R, Romieu I. Fine particulate matter and wheezing illnesses in the first year of life. Epidemiology. 2004 Nov;15(6):702–708. doi: 10.1097/01.ede.0000142153.28496.d0. [DOI] [PubMed] [Google Scholar]
- 45.Rivas RE, Barrios CS, Dorner PA, Osorio SX. Association between indoor contamination and respiratory diseases in children living in Temuco and Padre Las Casas, Chile. Rev Med Chil. 2008 Jun;136(6):767–774. [PubMed] [Google Scholar]
- 46.Diaz-Robles LA, Fu JS, Vergara-Fernandez A, et al. Health risks caused by short term exposure to ultrafine particles generated by residential wood combustion: a case study of Temuco, Chile. Environ Int. 2014 May;66:174–181. doi: 10.1016/j.envint.2014.01.017. [DOI] [PubMed] [Google Scholar]
- 47.Sanhueza P, Vargas C, Jimenez J. Mortalidad diaria en Santiago y su relación con la contaminación del aire. Rev Med Chil. 1999;127(2):235–242. [PubMed] [Google Scholar]
- 48.Valdes A, Zanobetti A, Halonen JI, Cifuentes L, Morata D, Schwartz J. Elemental concentrations of ambient particles and cause specific mortality in Santiago, Chile: a time series study. Environ Health. 2012;11:82. doi: 10.1186/1476-069X-11-82. 20121212 DCOM- 20130507. (1476-069X (Electronic)) [DOI] [PMC free article] [PubMed] [Google Scholar]
- 49.Pettersen MV, Fleck F. Bringing air pollution into the climate change equation. Bulletin of the World Health Organization. 2014 Aug 1;92(8):553–554. doi: 10.2471/BLT.14.030814. [DOI] [PMC free article] [PubMed] [Google Scholar]
- 50.Li L, Yang J, Guo C, Chen PY, Ou CQ, Guo Y. Particulate matter modifies the magnitude and time course of the non-linear temperature-mortality association. Environ Pollut. 2014 Nov 20;196C:423–430. doi: 10.1016/j.envpol.2014.11.005. [DOI] [PubMed] [Google Scholar]
- 51.Jhun I, Fann N, Zanobetti A, Hubbell B. Effect modification of ozone-related mortality risks by temperature in 97 US cities. Environment international. 2014 Dec;73:128–134. doi: 10.1016/j.envint.2014.07.009. [DOI] [PubMed] [Google Scholar]
- 52.Valenzuela S, Jouravlev A. In: Urban potable water and sewerage services in Chile: determinants of performance. CEPAL, editor. Santiago, Chile: CEPAL/Naciones Unidas; 2007. [Google Scholar]
- 53.Selman V, Cordero J, Larraín P, Salas R, editors. La modernización del sector sanitario en Chile. Chile: Maval; 2006. [Google Scholar]
- 54.De Gregorio J. Economic growth in Chile: evidence, sources and prospects. Vol. 298. Central Bank of Chile; 2004. [Google Scholar]
- 55.Trading Economics. GINI index in Chile. 2015 http://www.tradingeconomics.com/chile/gini-index-wb-data.html. Accessed , April 20, 2015.
- 56.Fischer R, Serra P. Effects of privatization of public services in Chile: sanitary, electricity and telecommunications cases. In: Banco Interamericano de Desarrollo, editor. Serie de Estudios Económicos y Sociales. 2004. BID. [Google Scholar]
- 57.Coleman T. Who owns the water? An analysis of water conflicts in Latin American and modern water law. In. Intersections. 2012;12(2):1–19. [Google Scholar]
- 58.Baer M. Private water, public good: water privatization and state capacity in Chile. Studies in Comparative International Development. 2014;49:141–167. [Google Scholar]
- 59.Selman V, Cordero J, Larraín P, Salas R. The Modernization of the Sanitary Sector in Chile. Santiago, Chile: SEP Sistema de Empresas; 2006. [Google Scholar]
- 60.Jouralev A. Drinking water and sanitation in the threshold of the twenty-first century. Santiago, Chile: United Nations- Economic Commission for Latin America, UNECLAC; 2004. [Google Scholar]
- 61.Medina E. Epidemic of cholera in Chile; 1991. Rev Med Chil. 1991 Aug;119(8):943–956. [PubMed] [Google Scholar]
- 62.Superintendencia de Servicios Sanitarios. Historical coverage of the sanitary sector. 2014 http://www.siss.cl/577/w3-article-3683.html. Accessed , March 5, 2015.
- 63.Jimenez J, Romero MI. Reducing infant mortality in Chile: success in two phases. Health Aff (Millwood) Mar–Apr. 2007;26(2):458–465. doi: 10.1377/hlthaff.26.2.458. [DOI] [PubMed] [Google Scholar]
- 64.Wolff M. Changes in the epidemiology of infectious diseases in Chile from 1990 to 2000. Rev Med Chil. 2002 Apr;130(4):353–362. [PubMed] [Google Scholar]
- 65.Steinmaus CM, Ferreccio C, Romo JA, et al. Drinking water arsenic in northern chile: high cancer risks 40 years after exposure cessation. Cancer epidemiology, biomarkers & prevention: a publication of the American Association for Cancer Research, cosponsored by the American Society of Preventive Oncology. 2013 Apr;22(4):623–630. doi: 10.1158/1055-9965.EPI-12-1190. [DOI] [PMC free article] [PubMed] [Google Scholar]
- 66.World Health Organization. Guidelines for drinking-water quality. 2nd. Geneve, Suiza: WHO; 1963. [Google Scholar]
- 67.Sancha AM, O’Ryan R. Managing hazardous pollutants in Chile: arsenic. Reviews of environmental contamination and toxicology. 2008;196:123–146. [PubMed] [Google Scholar]
- 68.Ferreccio C, Gonzalez C, Milosavjlevic V, Marshall G, Sancha AM, Smith AH. Lung cancer and arsenic concentrations in drinking water in Chile. Epidemiology. 2000 Nov;11(6):673–679. doi: 10.1097/00001648-200011000-00010. [DOI] [PubMed] [Google Scholar]
- 69.Marshall G, Ferreccio C, Yuan Y, et al. Fifty-year study of lung and bladder cancer mortality in Chile related to arsenic in drinking water. Journal of the National Cancer Institute. 2007 Jun 20;99(12):920–928. doi: 10.1093/jnci/djm004. [DOI] [PubMed] [Google Scholar]
- 70.Yuan Y, Marshall G, Ferreccio C, et al. Acute myocardial infarction mortality in comparison with lung and bladder cancer mortality in arsenic-exposed region II of Chile from 1950 to 2000. Am J Epidemiol. 2007 Dec 15;166(12):1381–1391. doi: 10.1093/aje/kwm238. [DOI] [PubMed] [Google Scholar]
- 71.Ministry of Public Works Goverment of Chile. Chile takes care of its water: national strategy of water resources. http://www.mop.cl/Documents/ENRH_2013_OK.pdf. Accessed , March 13, 2015.
- 72.Munoz-Zanzi C, Mason MR, Encina C, Astroza A, Romero A. Leptospira contamination in household and environmental water in rural communities in southern Chile. International journal of environmental research and public health. 2014 Jul;11(7):6666–6680. doi: 10.3390/ijerph110706666. [DOI] [PMC free article] [PubMed] [Google Scholar]
- 73.Diaz OP, Leyton I, Munoz O, et al. Contribution of water, bread, and vegetables (raw and cooked) to dietary intake of inorganic arsenic in a rural village of Northern Chile. J Agric Food Chem. 2004 Mar 24;52(6):1773–1779. doi: 10.1021/jf035168t. [DOI] [PubMed] [Google Scholar]
- 74.Superintendencia de Servicios Sanitarios SISS. Sanitary Concessionaries Directory. 2015 http://www.siss.gob.cl/577/w3-article-8852.html. Accessed , March 20, 2015, 2015.
- 75.Superintendencia de Servicios Sanitarios SISS. Quality service indicators. 2015 http://www.siss.cl/577/w3-propertyvalue-3525.html. Accessed , March 20, 2015, 2015.
- 76.EPA. Sulfate in drinking water. 1999 http://water.epa.gov/drink/contaminants/unregulated/sulfate.cfm. Accessed , February 5, 2015.
- 77.EPA. Basic information about nitrates in drinking water. 1992 http://water.epa.gov/drink/contaminants/basicinformation/nitrate.cfm. Accessed , February 5, 2015.
- 78.Nemcic-Jurec J, Konjacic M, Jazbec A. Monitoring of nitrates in drinking water from agricultural and residential areas of Podravina and Prigorje (Croatia) Environ Monit Assess. 2013 Nov;185(11):9509–9520. doi: 10.1007/s10661-013-3269-1. [DOI] [PubMed] [Google Scholar]
- 79.Díaz J, Solari V, Cáceres O, et al. Outbreaks of acute gastroenteritis in Antofagasta Region. Chile 2010. Revista Chilena de Infectología. 2012;29(1):6. doi: 10.4067/S0716-10182012000100003. [DOI] [PubMed] [Google Scholar]
- 80.Secretaría Regional Ministerial of Coquimbo. Report of an outbreak of acute gastroenteritis caused by norovirus, Region of Coquimbo, Municipality of Ovalleà Report sheet at , September 30, 2013. Unidad de Epidemiología, Secretaría Regional Ministerial (SEREMI); Coquimbo: 2013. [Google Scholar]
- 81.World Health Organization. Guidelines for drinking-water quality. 4th. Geneve, Suiza: WHO; 2011. [Google Scholar]
- 82.Ministry of Health Chile. Regulation of water services for human comsumption. Decreto N° 735 N° 1; Diario Oficial. 1969 Dec 12; Last update , July 30, 2010. [Google Scholar]
- 83.Kashyap A. Water governance: learning by developing adaptive capacity to incorporate climate variability and change. Water Sci Technol. 2004;49(7):141–146. [PubMed] [Google Scholar]
- 84.Doorn N. Governance Experiments in Water Management: From Interests to Building Blocks. Sci Eng Ethics. 2015 Feb 5; doi: 10.1007/s11948-015-9627-3. [DOI] [PMC free article] [PubMed] [Google Scholar]
- 85.OECD. Water Governance in OECD Countries: A Multilevel Approach, OECD Studies on Water. OECD Publishing; 2011. [Google Scholar]
- 86.IPCC. Climate Change 2013: The Physical Science Basis. In: Stocker TF, Qin D, Plattner G-K, Tignor M, Allen SK, Boschung J, Nauels A, Xia Y, Bex V, Midgley PM, editors. Contribution of Working Group I to the Fifth Assessment Report of the Intergovernmental Panel on Climate Change. Cambridge, United Kingdom and New York, NY, USA: IPCC; 2013. [Google Scholar]
- 87.Stocker T, Qin D, Plattner G, et al. Contribution of working group I to the fifth assessment report of the intergovernmental panel on climate change. Cambridge University Press; 2013. IPCC, 2013: climate change 2013: the physical science basis. [Google Scholar]
- 88.Meehl GA, Tebaldi C. More intense, more frequent, and longer lasting heat waves in the 21st century. Science. 2004;305(5686):994–997. doi: 10.1126/science.1098704. [DOI] [PubMed] [Google Scholar]
- 89.Ministerio del Medio Ambiente. 2nd National Communication of Chile to the United Nations Framework Convention on Climate Change. 2011 http://unfccc.int/resource/docs/natc/chinc2e.pdf. Accessed , April 30, 2015.
- 90.Falvey M, Garreaud RD. Regional cooling in a warming world: Recent temperature trends in the southeast Pacific and along the west coast of subtropical South America (1979–2006) Journal of Geophysical Research-Atmospheres. 2009 Feb;114 [Google Scholar]
- 91.Schulz N, Boisier J, Aceituno P. Climate change along the arid coast of northern Chile. International Journal of Climatology. 2011 [Google Scholar]
- 92.Garreaud RD, Battisti DS. Interannual (ENSO) and interdecadal (ENSO-like) variability in the Southern Hemisphere tropospheric circulation. Journal of Climate. 1999 Jul;12(7):2113–2123. [Google Scholar]
- 93.Quintana J, Aceituno P. Changes in the rainfall regime along the extratropical west coast of South America (Chile): 30–43° S. Atmosfera. 2012;25(1):1–22. [Google Scholar]
- 94.Fuenzalida HA, Sanchez R, Garreaud RD. A climatology of cutoff lows in the Southern Hemisphere. Journal of Geophysical Research-Atmospheres. 2005 Sep 21;110(D18) [Google Scholar]
- 95.Pinto J, Bonacic C, Hamilton-West C, Romero J, Lubroth J. Climate change and animal diseases in South America. Revue scientifique et technique. 2008 Aug;27(2):599–613. [PubMed] [Google Scholar]
- 96.Ministerio de Salud. Enfermedad de Chagas. Boletín Epidemiológico Trimestral. 1102014:1–4. [Google Scholar]
- 97.Canals M, Cattan PE, Solis R, Valderas J. Population effects of fluctuation in fecundity and mortality in Triatoma infestans: simulation using Leslie matrices. Rev Med Chil. 1991 Nov;119(11):1239–1242. [PubMed] [Google Scholar]
- 98.Canals M, Cattan PE. Dynamics of Chagas infection transmission in Chile: model and simulation. Rev Med Chil. 1992 Dec;120(12):1359–1365. [PubMed] [Google Scholar]
- 99.Canals M, Cattan PE, Ehrenfeld M. Compared dynamics of Triatoma infestans cohorts in residential environment. Rev Med Chil. 1994 Sep;122(9):993–997. [PubMed] [Google Scholar]
- 100.Ordenes H, Ehrenfeld M, Cattan PE, Canals M. Tripano-triatomine infection of Triatoma spinolai in a zone with epidemiological risk. Rev Med Chil. 1996 Sep;124(9):1053–1057. [PubMed] [Google Scholar]
- 101.Canals M, Solis R, Valderas J, Ehrenfeld M, Cattan PE. Preliminary studies on temperature selection and activity cycles of Triatoma infestans and T. spinolai (Heteroptera:Reduviidae), Chilean vectors of Chagas’ disease. Journal of medical entomology. 1997 Jan;34(1):11–17. doi: 10.1093/jmedent/34.1.11. [DOI] [PubMed] [Google Scholar]
- 102.Ehrenfeld MJ, Canals M, Cattan PE. Population parameters of Triatoma spinolai (Heteroptera: Reduviidae) under different environmental conditions and densities. Journal of medical entomology. 1998 Sep;35(5):740–744. doi: 10.1093/jmedent/35.5.740. [DOI] [PubMed] [Google Scholar]
- 103.Canals M, Solis R, Tapia C, Ehrenfeld M, Cattan P. Comparison of some behavioral and physiological feeding parameters of Triatoma infestans Klug, 1834 and Mepraia spinolai Porter, 1934, vectors of Chagas disease in Chile. Memorias do Instituto Oswaldo Cruz. 1999 Sep-Oct;94(5):687–692. doi: 10.1590/s0074-02761999000500025. [DOI] [PubMed] [Google Scholar]
- 104.Canals M, Ehrenfeld M, Cattan PE. Situation of Mepraia spinolai, a wild vector for Chagas disease in Chile, in relation to others vectors from the perspective of their feeding profile. Rev Med Chil. 2000 Oct;128(10):1108–1112. [PubMed] [Google Scholar]
- 105.Acuna-Retamar M, Botto-Mahan C, Canals M, Correa JP, Cattan PE. Comparative population dynamics of the bug Mepraia spinolai, a sylvatic vector of Chagas’ disease, in different hosts. Medical and veterinary entomology. 2009 Jun;23(2):106–110. doi: 10.1111/j.1365-2915.2009.00795.x. [DOI] [PubMed] [Google Scholar]
- 106.Canals M, Cruzat L, Molina MC, Ferreira A, Cattan PE. Blood host sources of Mepraia spinolai (Heteroptera: Reduviidae), wild vector of chagas disease in Chile. Journal of medical entomology. 2001 Mar;38(2):303–307. doi: 10.1603/0022-2585-38.2.303. [DOI] [PubMed] [Google Scholar]
- 107.Cattan PE, Pinochet A, Botto-Mahan C, Acuna MI, Canals M. Abundance of Mepraia spinolai in a Periurban zone of Chile. Memorias do Instituto Oswaldo Cruz. 2002 Apr;97(3):285–287. doi: 10.1590/s0074-02762002000300001. [DOI] [PubMed] [Google Scholar]
- 108.Botto-Mahan C, Cattan PE, Canals M, Acuna M. Seasonal variation in the home range and host availability of the blood-sucking insect Mepraia Spinolai in wild environment. Acta tropica. 2005 Aug;95(2):160–163. doi: 10.1016/j.actatropica.2005.05.001. [DOI] [PubMed] [Google Scholar]
- 109.Bacigalupo A, Segura JA, Garcia A, Hidalgo J, Galuppo S, Cattan PE. First finding of Chagas disease vectors associated with wild bushes in the Metropolitan Region of Chile. Rev Med Chil. 2006 Oct;134(10):1230–1236. doi: 10.4067/s0034-98872006001000003. [DOI] [PubMed] [Google Scholar]
- 110.Bacigalupo A, Torres-Perez F, Segovia V, et al. Sylvatic foci of the Chagas disease vector Triatoma infestans in Chile: description of a new focus and challenges for control programs. Memorias do Instituto Oswaldo Cruz. 2010 Aug;105(5):633–641. doi: 10.1590/s0074-02762010000500006. [DOI] [PubMed] [Google Scholar]
- 111.Olea P. Primer caso de dengue autóctono atendido en el Hospital de Enfermedades Infecciosas Dr. Lucio Córdova. Revista Chilena de Infectología. 2003;20:4. [Google Scholar]
- 112.Deichmeister T. Abundance of of West Nile virus mosquito vectors in relation to climate and landscape variables. Journal of Vector Ecology. 2010;36(1):10. doi: 10.1111/j.1948-7134.2011.00143.x. [DOI] [PubMed] [Google Scholar]
- 113.Yates TL, Mills JN, Parmenter CA, et al. The Ecology and Evolutionary History of an Emergent Disease: Hantavirus Pulmonary Syndrome. Bioscience. 2002;52(11):989–998. [Google Scholar]
- 114.Mills J. Regulation of rodent-borne virus in the natural host: implications for human disease. Arch Virol. 2005;19:45–57. doi: 10.1007/3-211-29981-5_5. [DOI] [PubMed] [Google Scholar]
- 115.Lima M, Marquet PA, Jaksic FM. El Niño events, precipitation patterns, and rodent outbreaks are statistically associated in semiarid Chile. Ecography. 1998;22:213–218. [Google Scholar]
- 116.Murua R, Gonzalez LA, Lima M. Population dynamics of rice rats (a Hantavirus reservoir) in southern Chile: feedback structure and non-linear effects of climatic oscillations. OIKOS. 2003;102:137–145. [Google Scholar]
- 117.Murua R, Navarrete M, Cadiz R, et al. Hantavirus pulmonary syndrome: current situation among rodent reservoirs and human population in the 10th region, Chile. Rev Med Chil. 2003 Feb;131(2):169–176. [PubMed] [Google Scholar]
- 118.Muñoz-Pedreros A, Rutheford P, Gil C. Mapas de riesgo para hantavirus en el parque nacional Conguillio, sur de Chile. Rev Chil Hist Nat. 2007;80:363–379. [Google Scholar]
- 119.Rutllant J, Garreaud R. Meteorological air pollution potential for Santiago, Chile: Towards an objective episode forecasting. Environ Monit Assess. 1995 Feb;34(3):223–244. doi: 10.1007/BF00554796. [DOI] [PubMed] [Google Scholar]
- 120.Vicuna S, Dracup JA, Lund JR, Dale LL, Maurer EP. Basin-scale water system operations with uncertain future climate conditions: Methodology and case studies. Water Resour Res. 2010 Apr 16;46 [Google Scholar]
- 121.Vicuna S, Garreaud RD, McPhee J. Climate change impacts on the hydrology of a snowmelt driven basin in semiarid Chile. Climatic Change. 2011 Apr;105(3–4):469–488. [Google Scholar]
- 122.Garreaud R. La Mega Sequía 2009–2014 en Chile Central: Causas y Consecuencias; Paper presented at: International expert symposium “Coping with Droughts”; 19th–21st, 2014; Santiago, Chile. [Google Scholar]
- 123.Ministerio de Obras Públicas. Estrategia Nacional de Recursos Hídricos. 2012 http://www.mop.cl/Documents/ENRH_2013_OK.pdf. Accessed , March 23, 2015.
- 124.Ministerio de Agricultura. Cambio Climático Impacto en la Agricultura Heladas y Sequía. 2013 http://www.odepa.cl/wp-content/files_mf/1388169148cambioClimatico.pdf. Accessed , April 28, 2015.
- 125.Xu Z, Sheffield PE, Hu W, et al. Climate change and children’s health–a call for research on what works to protect children. International journal of environmental research and public health. 2012 Sep;9(9):3298–3316. doi: 10.3390/ijerph9093298. [DOI] [PMC free article] [PubMed] [Google Scholar]
- 126.Arellano A, Carvajal V. The bussiness of water: the 26 years law that ensures millionaire utilities to sanitary enterprises. CIPER, Centro de Investigación Periodística. 2014 http://ciperchile.cl/2014/10/22/el-negocio-del-agua-ley-que-rige-hace-26-anos-asegura-millonarias-utilidades-a-sanitarias/. Accessed 2015, March 15.
- 127.Shah K, Sharma PK, Nandi I, Singh N. Water sustainability: reforming water management in new global era of climate change. Environmental science and pollution research international. 2014 Oct;21(19):11603–11604. doi: 10.1007/s11356-014-2812-0. [DOI] [PubMed] [Google Scholar]
- 128.Danielson L, Nelson P, Zubkova M. Current Issues in the Chilean Mining Sector. Prepared for GTZ and Heidi Feldt by Sustainable Development Strategies Group. 2010 [Online document] http://www.sdsg.org/wp-content/uploads/2010/02/10-10-08-CHILE-REPORT.pdf. Accessed March 1th, 2015.
- 129.Ministerio de Desarrollo Social. Encuesta de caracterización socioeconómica nacional. Situación de la pobreza en Chile. 2013 http://observatorio.ministeriodesarrollosocial.gob.cl/documentos/Casen2013_Situacion_Pobreza_Chile.pdf. Accessed , May 2, 2015.
- 130.Ministerio de Salud Departamento de Estadísticas e Información de Salud. Serie histórica de Enfermedades de Declaración Obligatoria. 2000–2010 http://intradeis.minsal.cl/webeno2011/seriehistorica.aspx?ano_inicial=2000&ano_final=2010. Accessed March 10, 2015.
- 131.Intituto Nacional de Estadística Chile. CHILE: Proyecciones y Estimaciones de Població. País y Regiones. 1990–2020 http://palma.ine.cl/demografia/menu/EstadisticasDemograficas/DEMOGRAFIA.pdf.
- 132.Fuenzalida H, Aceituno P, Falvey M, Garreaud R, Rojas M, Sanchez R. Study on Climate Variability for Chile during the 21st century. Technical Report prepared for the National Environmental Committee. 2007 http://www.dgf.uchile.cl/PRECIS. Accessed , March 5, 2015.