

Abstract
Background
Although participation in cancer clinical trials is low, little is known about the number of available clinical trials, and open spots for patients. Moreover, it is unclear what the relationship is between clinical trial openings and the incidence and mortality of cancer subtypes.
Methodology
We identified the number of phase I, phase II, and phase III registered at clinicaltrials.gov by cancer (tumor) type. All counts were over the preceding 5 years (2008 to 2013). We compared these counts against the incidence and prevalence of disease reported by Surveillance, Epidemiology, and End Results (SEER) database for 32 common cancers
Results
From 2008 to 2013, 3879 phase I trials, 4982 phase II trials and 1379 phase III trials concerning a cancer subtype were registered in clinicaltrials.gov. These trials had a cumulative proposed recruitment of 203396, 421502, and 697787 patients, respectively. Trial enrollment varied by tumor type, with both over and under-representation occurring.
Conclusion
Opportunities to enroll in clinical trials vary by phase and tumor type. Oncologists must remain committed to clinical trials.
Indexing: Cancer clinical trials, clinicaltrials.gov, cancer trials, phase I, phase II and phase III, burden of disease, cancer trials portfolio
Introduction
Clinical trials are a major driver of innovation in cancer care, and improved outcomes for patients[1]. Prior investigations have outlined broad themes in the entire registry of cancer clinical trials (registered at clinicaltrials.gov), highlighting that the fact that only a minority of oncology clinical trials are presently funded by governmental agencies, such as the National Cancer Institute (15.3%), and that most trials in oncology are small, single arm studies[2]. Examining all clinical trials by tumor type, prior groups have found that some malignancies (e.g. breast, lymphoma) are overrepresented in trial volume with respect to annual incidence or mortality, while others (e.g. lung, pancreatic) are underrepresented[2]. Other groups have shown that these findings persists when disability adjusted life years lost are substituted for incidence and death[3].
To our knowledge, no prior group has examined the cancer clinical trials portfolio by traditional phase of drug testing (phase I, II, and III), or by considering the size of potential recruitment of a trial. In other words, the cumulative number of spots for patients in a trial may vary greatly from less than fifty to several thousand, and yet prior analyses would treat these trials similarly. Understanding differences in the availability of trial openings, by phase, would precisely identify what stages of drug development are lacking or overrepresented in particular tumor types. For these reasons, we sought to investigate the relationship between potential clinical trial spots by phase of development for 32 common tumor types.
Methods
We began by downloading the most recent list of cancer specific incidence and death statistics from CDC.gov, which at the time of our investigation was the 2014 facts and figures. (Available at: http://www.cancer.org/research/cancerfactsstatistics/cancerfactsfigures2014/ Page 4). Of note, these figures are drawn from and identical to summary statistics of the Surveillance, Epidemiology, and End Results (SEER) database for the United States.
Tumor types
As our dataset was generated automatically using scripted computerized searches, we chose to define searchable tumor categories. From the Cancer Facts and Figures, we consolidated tumors into 32 tumor types reported hereafter. Specifically, tongue, mouth, pharynx, other oral cavity and larynx were grouped as head and neck squamous cell cancer (HNSCC). Cutaneous malignancies were excluded. Colon and rectal cancer were treated both individually, and together as colorectal cancer for all subsequent searches. These choices were made to facilitate accurate capture of ongoing trials. For example, an ongoing phase II trial that would include patients with relapsed larnyx cancer would more likely be listed under HNSCC. For colon, rectal and colorectal cancer—combining the numbers of colon and rectal cancer trials do not sum in part because of different search strategies, and also in part because some clinical trials for rectal cancer may specifically exclude colon cancer, or vice versa.
Programming
Data acquisition and analysis were done using the Python programming language with the pandas, numpy, scipy, and matplotlib extensions. Code is available at github.com/jagstein/Rankings-dz. These scripts download the clinicaltrials.gov database, parse the entries in to searchable code, and then perform the automated searches based on our prespecified search terms.
Clinical trials listed at Clinicaltrial.gov
ClinicalTrials.gov is a trial registry hosted by the US National Library of Medicine. It is estimated to house nearly 100,000 trials from nations around the globe[4]. Over 60% of included trials are studies of medications, and over 60% are primarily conducted in North America[4]. The majority of included trials (70%) are randomized[4].
We searched for all trials at clinicaltrials.gov with the search term ‘cancer’, yielding in 43,339 studies. These trials downloaded in XML format (5/24/2014), and provided data on the trial, start date, study id, phase of drug development, source of funding, number of potential participants, completion status, and lead institution. We considered trials with start dates between 2008 and 2013. A five-year time span was chosen to yield a manageable dataset, and reflect contemporary trial practices.
The disease under study was determined by searching the ‘brief_summary/textblock’, ‘brief_title’, and ‘condition’ fields. Hodgkins disease and non-hodgkins lymphoma were additionally disambiguated (see source code). 31,164 trials were successfully classified in this manner. The number of potential participants for all trials was also determined.
Preliminary analysis of the data showed a disproportionate number of patients in screening trials for colorectal cancer and in biobanking for multiple myeloma. Manual inspection of the trial lists showed that 6 of the 15 largest colorectal cancer trials in the period studied concerned screening. In total, these trials represented 311,555 patients. The largest, the “Pilot Study of a National Screening Programme for Bowel Cancer in Norway” had a size of 140,000 patients, larger than the total number of non-screening trials. Similarly, a single Phase 1 study of multiple myeloma, “Tissue, Blood, and Body Fluid Sample Collection From Patients With Hematologic Cancer” was similarly removed.
Statistical Analysis
Descriptive statistics for the data are provided. A ratio was constructed, by phase, with the cumulative number of clinical trial spots over 5 years (in the numerator), and the annual incidence (adjusted to 5 years) in the denominator. This ratio compares clinical trial opportunities to burden of disease, by phase of testing, and is reported graphically. Linear regression was performed to assess the correlation between cumulative trial enrollment and number of trials by phase, with confidence bands. The cumulative trial enrollment and the annual mortality of each disease was log transformed prior to linear regression, as done by others for such comparisons[5]. Figures and tables were generated with Microsoft Excel (Richmond, Wa), and statistical analysis was performed using STATA Version 13.0 (College Park, Tx)
Results
In a 5-year time span, from 2008 to 2013, 3879 phase I trials, 4982 phase II trials and 1379 phase III trials were registered in clinicaltrials.gov concerning a tumor type. These trials had a cumulative proposed recruitment of 203396, 421502, and 697787 patients, respectively. Thus, on average, a phase I trial proposed to enroll 52 participants; a phase II trial proposed to enroll 85 participants; and, a phase III trial sought to enroll 506 participants. Data were not uniformly reported regarding what percent of trials met enrollment, and were not considered. Descriptive characteristics of the number of trials, and cumulative participant enrollment by percentile are shown in Table 1.
Table 1.
Descriptive characteristics regarding the number of deaths, incidence cases, open clinical trials and cumulative projected enrollment by tumor type among trials registered in ClinicalTrial.gov between 2008 to 2013
| Low | 25th Percentile | Median | 75th Percentile | High | ||
|---|---|---|---|---|---|---|
| Measures of Disease Burden (1 year statistics) | Deaths | 320 | 1665 | 11040 | 17740 | 160000 |
| Incident cases | 1640 | 9920 | 23715 | 67360 | 240000 | |
| Measures of Trial Opportunities (5 Year statistics) | Number of Phase 1 Trials | 0 | 29 | 84 | 188 | 449 |
| Number of Phase 2 Trials | 3 | 48 | 121 | 188 | 713 | |
| Number of Phase 3 Trials | 0 | 11 | 26 | 55 | 241 | |
| Total Number of Patients in Phase 1 Trials | 0 | 1185 | 3892 | 8822 | 36128 | |
| Total Number of Patients in Phase 2 Trials | 155 | 3359 | 7196 | 14588 | 87621 | |
| Total Number of Patients in Phase 3 Trials | 0 | 5071 | 10298 | 24584 | 160000 |
Figure 1 shows the relationship between the cumulative patient enrollment and number of trials available by tumor type. As the number of trials increases, the cumulative enrollment increases, and this occurs more rapidly in later phase trials. For instance, 241 phase III breast cancer trials have a proposed enrollment of 164971 participants, an average of 685 patients per trial. In contrast, 29 phase III pancreatic cancer trials seek a total enrollment of 11254 patients, an average of 388 patients per trial. Linear regressions are plotted in Figure 1, and the coefficients for these regressions, p-values and coefficients of determination are displayed in Table 2.
Figure 1.
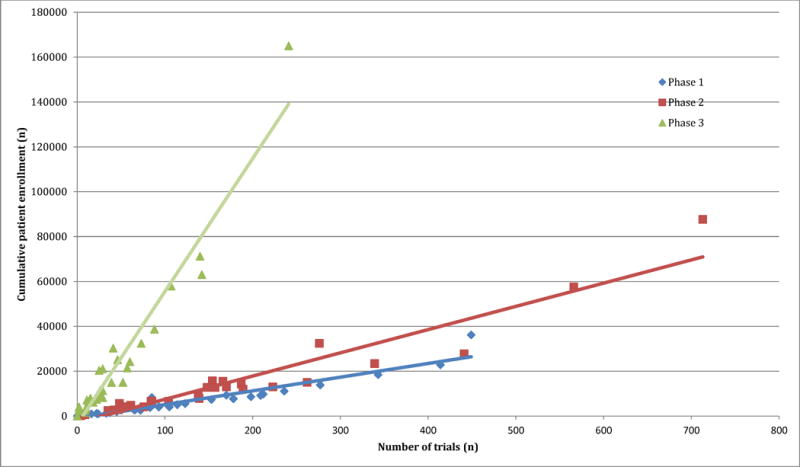
The relationship between the number of trials and their cumulative enrollment by tumor type and phase in the ClinicalTrials.gov database between 2008–2013
Table 2.
Correlation between cumulative trial enrollment and number of studies by tumor type among trials registered in ClinicalTrial.gov between 2008 to 2013. Beta coefficients reflect the average increase in potential cumulative trial enrollment with the addition of one more trial.
| Beta-coefficient | P-value | R^2 | |
|---|---|---|---|
| Phase 1 | 61.2 | <0.001 | 0.91 |
| Phase 2 | 103.7 | <0.001 | 0.91 |
| Phase 3 | 592.8 | <0.001 | 0.94 |
Figure 2 depicts a stacked ratio of available phase I, phase II and phase III trial openings to the annual incidence of a malignancy sorted by cumulative ratio. Acute lymphocytic leukemia yields the highest proportion of new cases that could potentially enroll in a clinical trial, while testicular cancer yields the lowest cumulative ratio.
Figure 2.
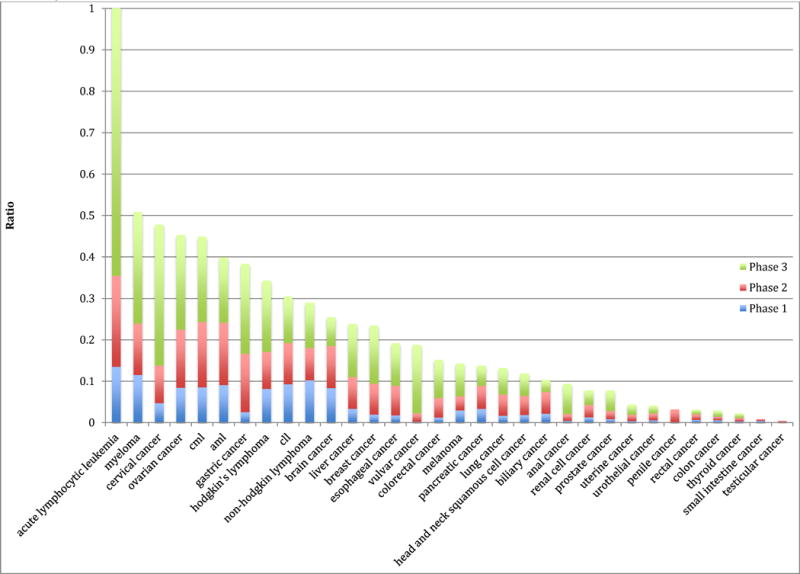
Stacked ratio of the Annual Potential Trial Enrollment (All trials ClinicalTrials.gov) to United States Burden of Disease (measure by Incidence).
Figure 3 (Panels A–C) shows the relationship between annual mortality and cumulative trial enrollment on a logarithmic scale. Linear regressions and 95% confidence intervals are depicted in the figures. Coefficients of determination (R2), the extent to which variability in enrollment is captured in variability in mortality, were 0.52 for phase 1 trials, 0.69 for phase 2 trials, and 0.36 for phase 3 trials. Data are shown for phase I, II and III trials in panels A, B, and C, respectively.
Figure 3.
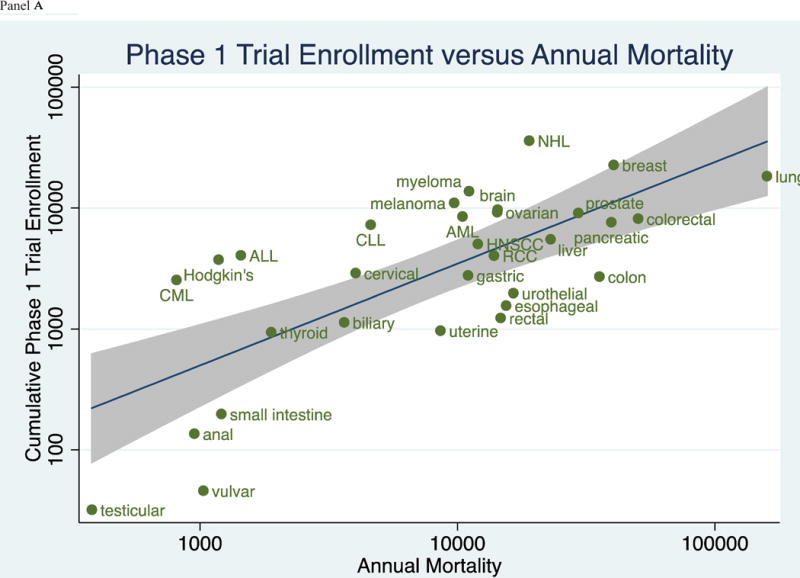
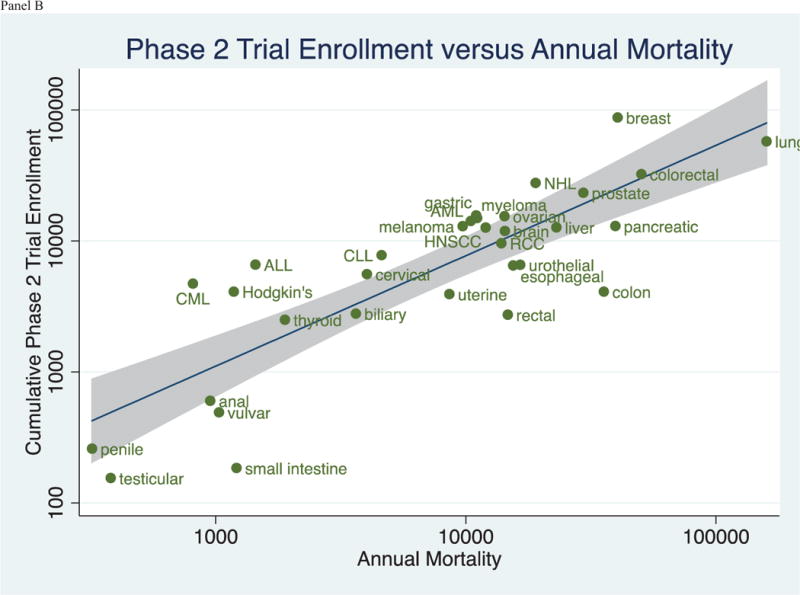
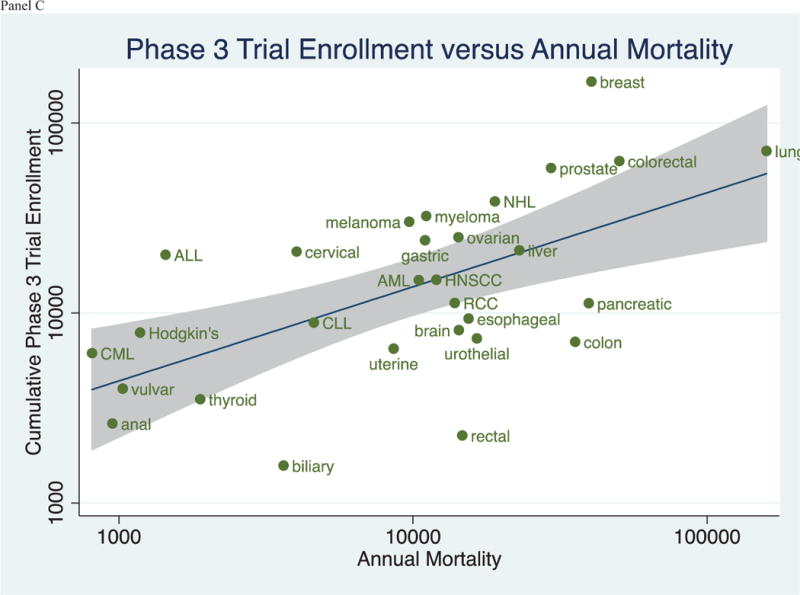
(Panels A–C): Relationship between the Cumulative Trial Enrollment by Phase and the Annual Mortality by Tumor Type in trials registered in ClinicalTrials.gov between 2008 and 2013.
Discussion
To our knowledge, our analysis is the first investigation to describe cumulative trial enrollment by the traditional phases of drug development across of range of malignancies. Our results capture the collective effort of trials across cancers. For instance, multiple myeloma, an incurable malignancy, now boasts a large number of clinical trial openings (Figure 3)—in line with the substantial investment in developing novel therapeutics[6]. Acute lymphoid leukemia remains a leader in available trial spots per incident cases[7], while testicular cancer—a malignancy that is now largely curative[8]– have few ongoing or recent investigations.
Prior research has lamented the poor rate of participation in cancer clinical trials. Analyses suggest that as low as 1.7%[9] to 9%[10] of cancer patients are treated on study. Prior work implicates strict inclusion criteria as a barrier to trial enrollment. A study by Fahrenbacher and colleagues found that less than 25% of Kaiser Permanente enrollees were eligible for one of two contemporary clinical trials[11]. Our results add to this finding, and suggest that for many malignancies, there are few trials for patients to consider.
The stacked ratio of clinical trial openings to annual incidence depicted in Figure 2 represents a theoretical construct. The figure aims to provide a visual representation for, on average, how do clinical trial enrollment opportunities mirror the burden of disease. However, it is important to remember that Figure 2 does not provide an estimate of the number of trial spots for particular patients, as we were unable to restrict trials based on the number of prior rounds of therapy a patient may have had. As such, though Figure 2 captures the relative differences in trial spots to incident cases, it cannot be used to draw firm conclusions regarding the absolute number of clinical trial openings for any cancer indication. Nevertheless, we feel there is unlikely to be a large systematic bias across tumor types, and therefore the figure can be used to make comparisons among malignancies.
Phase I clinical trials present a challenge to our present analysis. While the majority of such studies are tumor agnostic (enroll a variety of tumor types), there is an increasing trend to conduct phase I trials (or phase I expansion cohorts[12]) in one or a few malignancies. At a registry level, the challenge in relying too heavily on the phase I data reported here is that many phase I trials may not be registered in clinicaltrials.gov[13,14]. Nevertheless, we feel that this limitation is unlikely to be systematic among the malignancies described.
Enthusiasm for drug development in a specific tumor type may change over time. Between 2008–2013—the years of our analysis—early phase (phase I and II) testing was particularly robust for Non-Hodgkin’s lymphoma, while late phase (phase III) testing remained on average (Figure 3). This trend may be due to a robust pipeline of preclinical targets explored by researchers during these years, including the developing of b-cell receptor signaling and Phosphoinositide 3-kinase inhibitors, such as ibrutinib[15] and idelalisib[16], among many other putative targets[17].
There is no consensus for what the perfect clinical trials portfolio should look like. Prior investigations have noted that, for some diseases, research funding is not proportionate to disability adjusted life years lost (DALY)[5], or that clinical trial number is not proportionate to the incidence[2], mortality[2], or DALYs[3] of a cancer. In several analyses, lung cancer appears underfunded and under-researched, while breast cancer seems over-funded and over-researched[2,3]. Indeed, this specific observation was also noted in our data set (Figure 3). However, while such observations are worthy of consideration and further debate, it is a mistake to think that research should be proportionate to burden of disease. Instead, ideally, research should be proportionate to the ability of that research to improve human health[18]. In other words, the net improvement in outcomes, irrespective of disease burden, is what must be optimized through research. Although burden of disease and risk reduction are related concepts, there is no canonical rule that one must imply the other. In all cases, the projected gain of research is measured by net expected benefit per dollar spent, which depends to some degree on burden of disease, but is not invariably wedded to it. For this reason, and without greater granular trial details, it is difficult if not impossible to say if the clinical trial landscape we describe is optimal. Nevertheless, this remains one of the most important questions surrounding clinical research.
Limitations
There are several limitations to our project. Foremost is the fact that only certain information is captured within the clinical trials database, and which can be summarized with automatic computer algorithms. For instance, we are unable to delineate the line of therapy being tested (first, second or subsequent), what percent of studies tested first-in-class agents versus next-in-class or “me too” therapies, whether trials were for treatment or chemoprevention, and whether statistical analyses were conducted according to stated design. Ideally, future research will be able to delve further in the cancer clinical trials portfolio into these and other important questions.
Second, returned a large volume of clinical trials, and were designed to capture a breadth of alternate spellings or titles, they are nevertheless incomplete. Other search strategies may have been able to identify additional trials. However, we feel that this would be unlikely to change the general conclusions of the paper. Third, the number of clinical trials, and their accrual does not represent spots that are universally filled, but rather projected openings, typically at time of trial registration. In any given trial, the actual enrollment could exceed the projection (due to protocol amendment) or fall short (due to inadequate recruitment). Given earlier published estimates of actual clinical trial participation[9,10], it is likely that our figures for projected trial enrollment on average overestimate actual enrollment. However, on average, as our project was primarily concerned with the relative differences among malignancies, we feel that there is unlikely to be any systematic bias by tumor type. Nevertheless, this is an assumption and should be stated as such.
Conclusion
Our analysis of cancer clinical trial cumulative enrollment by phase of drug development shows marked differences in the number of available openings by tumor type. For some cancers, there is an abundance of clinical trial options, while other tumor types suffer from a paucity of options. Further research is needed to explore whether and to what extent this is driven by political and financial pressures or, instead, biological differences.
Highlights.
Clinical trials vary widely in terms of the number of positions for patients by cancer tumor type.
Trial enrollment varies by tumor types
For some cancers, nearly all afflicted patients have a trial option; for other cancers, options exist for only a fraction of patients
Examining clinical trials by open positions is a useful strategy
Footnotes
Publisher's Disclaimer: This is a PDF file of an unedited manuscript that has been accepted for publication. As a service to our customers we are providing this early version of the manuscript. The manuscript will undergo copyediting, typesetting, and review of the resulting proof before it is published in its final citable form. Please note that during the production process errors may be discovered which could affect the content, and all legal disclaimers that apply to the journal pertain.
COI form
Neither author has any financial conflict of interest.
Vinay Prasad
Contributor Information
Vinay Prasad, Email: vinayak.prasad@nih.gov, Medical Oncology Branch, National Cancer Institute, National Institutes of Health, 10 Center Dr. 10/12N226, Bethesda, MD 20892, Phone: 219.229.0170.
Jeffery A. Goldstein, Email: jeffery.a.goldstein@vanderbilt.edu, Department of Pathology, Microbiology and Immunology, Vanderbilt University Medical Center, Nashville, TN 37232.
References
- 1.Fojo T, Giannakakou P. Decade in review—funding in cancer research: National Cancer Institute awards—a work in progress. Nat Rev Clin. 2014 doi: 10.1038/nrclinonc.2014.173. Oncol advance online publication. [DOI] [PubMed] [Google Scholar]
- 2.Hirsch BR, Califf RM, Cheng SK, et al. Characteristics of oncology clinical trials: Insights from a systematic analysis of clinicaltrials.gov. JAMA Intern Med. 2013;173:972–979. doi: 10.1001/jamainternmed.2013.627. [DOI] [PubMed] [Google Scholar]
- 3.Dear RF, Barratt AL, McGeechan K, Askie L, Simes J, et al. Landscape of cancer clinical trials in Australia: using trial registries to guide future research. Med J Aust. 2011;194:387–391. doi: 10.5694/j.1326-5377.2011.tb03027.x. [DOI] [PubMed] [Google Scholar]
- 4.Califf RM, Zarin DA, Kramer JM, Sherman RE, Aberle LH, et al. CHaracteristics of clinical trials registered in clinicaltrials.gov, 2007–2010. JAMA. 2012;307:1838–1847. doi: 10.1001/jama.2012.3424. [DOI] [PubMed] [Google Scholar]
- 5.Gross CP, Anderson GF, Powe NR. The Relation between Funding by the National Institutes of Health and the Burden of Disease. New England Journal of Medicine. 1999;340:1881–1887. doi: 10.1056/NEJM199906173402406. [DOI] [PubMed] [Google Scholar]
- 6.Ocio EM, Richardson PG, Rajkumar SV, Palumbo A, Mateos MV, et al. New drugs and novel mechanisms of action in multiple myeloma in 2013: a report from the International Myeloma Working Group (IMWG) Leukemia. 2014;28:525–542. doi: 10.1038/leu.2013.350. [DOI] [PMC free article] [PubMed] [Google Scholar]
- 7.Inaba H, Greaves M, Mullighan CG. Acute lymphoblastic leukaemia. The Lancet. 381:1943–1955. doi: 10.1016/S0140-6736(12)62187-4. [DOI] [PMC free article] [PubMed] [Google Scholar]
- 8.Hanna N, Einhorn LH. Testicular Cancer: A Reflection on 50 Years of Discovery. Journal of Clinical Oncology. 2014 doi: 10.1200/JCO.2014.56.0896. [DOI] [PubMed] [Google Scholar]
- 9.Murthy VH, Krumholz HM, Gross CP. Participation in cancer clinical trials: Race-, sex-, and age-based disparities. JAMA. 2004;291:2720–2726. doi: 10.1001/jama.291.22.2720. [DOI] [PubMed] [Google Scholar]
- 10.Unger JM, Hershman DL, Albain KS, Moinpour CM, Petersen JA, et al. Patient Income Level and Cancer Clinical Trial Participation. Journal of Clinical Oncology. 2013;31:536–542. doi: 10.1200/JCO.2012.45.4553. [DOI] [PMC free article] [PubMed] [Google Scholar]
- 11.Fehrenbacher LA, Somkin C. Randomized clinical trial eligibility rates for chemotherapy (CT) and antiangiogenic therapy (AAT) in a population-based cohort of newly diagnosed non-small cell lung cancer (NSCLC) patients. J Clin Oncol. 2009;27:15s. 2009 (suppl; abstr 6538) [Google Scholar]
- 12.Brahmer JR, Tykodi SS, Chow LQM, Hwu W-J, Topalian SL, et al. Safety and Activity of Anti–PD-L1 Antibody in Patients with Advanced Cancer. New England Journal of Medicine. 2012;366:2455–2465. doi: 10.1056/NEJMoa1200694. [DOI] [PMC free article] [PubMed] [Google Scholar]
- 13.Decullier E, Chan AW, Chapuis F. Inadequate dissemination of phase I trials: a retrospective cohort study. PLoS Med. 2009;6:e1000034. doi: 10.1371/journal.pmed.1000034. [DOI] [PMC free article] [PubMed] [Google Scholar]
- 14.Sim I, Chan AW, Gulmezoglu AM, Evans T, Pang T. Clinical trial registration: transparency is the watchword. Lancet. 2006;367:1631–1633. doi: 10.1016/S0140-6736(06)68708-4. [DOI] [PubMed] [Google Scholar]
- 15.Wang ML, Rule S, Martin P, Goy A, Auer R, et al. Targeting BTK with Ibrutinib in Relapsed or Refractory Mantle-Cell Lymphoma. New England Journal of Medicine. 2013;369:507–516. doi: 10.1056/NEJMoa1306220. [DOI] [PMC free article] [PubMed] [Google Scholar]
- 16.Gopal AK, Kahl BS, de Vos S, Wagner-Johnston ND, Schuster SJ, et al. PI3Kδ Inhibition by Idelalisib in Patients with Relapsed Indolent Lymphoma. New England Journal of Medicine. 2014;370:1008–1018. doi: 10.1056/NEJMoa1314583. [DOI] [PMC free article] [PubMed] [Google Scholar]
- 17.Intlekofer AM, Younes A. Precision therapy for lymphoma—current state and future directions. Nat Rev Clin Oncol. 2014;11:585–596. doi: 10.1038/nrclinonc.2014.137. [DOI] [PubMed] [Google Scholar]
- 18.Prasad V. Baseline event rate, the Concorde fallacy, and the topography of cardiac risk. Med Hypotheses. 2010;75:639–641. doi: 10.1016/j.mehy.2010.08.005. [DOI] [PubMed] [Google Scholar]