Abstract
Objective
To develop a radiographic atlas of osteoarthritis (OA) for use as a template and guide for standardized scoring of radiographic features of OA of the ankle and hindfoot joints.
Method
Under Institutional Review Board approval, ankle and hindfoot images were selected from a cohort study and from among cases that underwent ankle radiography during a 6-month period at Duke University Medical Center. Missing OA pathology was obtained through supplementation of cases with the assistance of a foot and ankle specialist in Orthopaedic surgery and a musculoskeletal radiologist. Images were obtained and reviewed without patient identifying information. Images went through multiple rounds of review and final images were selected by consensus of the study team. For intra-rater and inter-rater reliability, the kappa statistic was calculated for two readings by 3 musculoskeletal radiologists, a minimum of two weeks apart, of ankle and hindfoot radiographs from 30 anonymized subjects.
Results
The atlas demonstrates individual radiographic features (osteophyte and joint space narrowing) and Kellgren Lawrence grade for all aspects of the talocrural (ankle joint proper) and talocalcaneal (subtalar) joints. Reliability of scoring based on the atlas was quite good to excellent for most features indicated. Additional examples of ankle joint findings are illustrated including sclerosis, os trigonum, subchondral cysts and talar tilt.
Conclusions
It is anticipated that this atlas will assist with standardization of scoring of ankle and hindfoot OA by basic and clinical OA researchers.
Keywords: osteoarthritis, ankle, hindfoot, talocrural, tibiotalar, subtalar, radiograph, atlas, osteophyte, joint space narrowing
Introduction
Ankle osteoarthritis (OA), although relatively uncommon in the general population compared to OA affecting the knees, hands, and hips, is an important contributor to disability [1, 2]. It is difficult to know the true prevalence of ankle OA due to use different diagnostic criteria across studies, however, specific subgroups, such as soccer players, dancers and individuals with knee OA appear to have a high prevalence of ankle OA [2–4]. Analyses by Muehleman, et al. suggest that severe cartilage degeneration rarely occurs in the ankle [5]. It is not entirely clear why this small vulnerable appearing joint, is relatively protected from OA; suggestions range from differences in metabolic, biochemical and biomechanical properties that protect the ankle from OA (summarized in [2, 6]. Most cases of ankle OA are considered to be secondary to trauma, involving fractures or instability due to chronic ankle ligament laxity [7–9].
Although multiple grading systems have been previously proposed for ankle OA [10–15], to our knowledge based on literature searches, there are no comprehensive radiographic atlases for standardized ankle and subtalar joint OA research grading that are akin to the Osteoarthritis Research Society International (OARSI) pictorial atlas for hand, hip and knee OA grading [16]. In addition, a radiographic atlas of five foot joints was published online in 2007 [17] for scoring osteophytes and joint space narrowing of the first metatarsophalangeal joint, the first cuneo-metatarsal joint, the second cuneo-metatarsal, the navicular-first cuneiform joint and the talonavicular joint), it did not include the tibiotalar, talofibular or talocalcaneal (subtalar) joints as proposed for our ankle and hindfoot atlas.
This therefore represents a new tool for standardized scoring of foot and ankle OA. In addition, we evaluated the intra- and inter-rater reliability of the scoring of each feature of the atlas to aid in selection of the most reliable components for research purposes.
Methods
Subjects
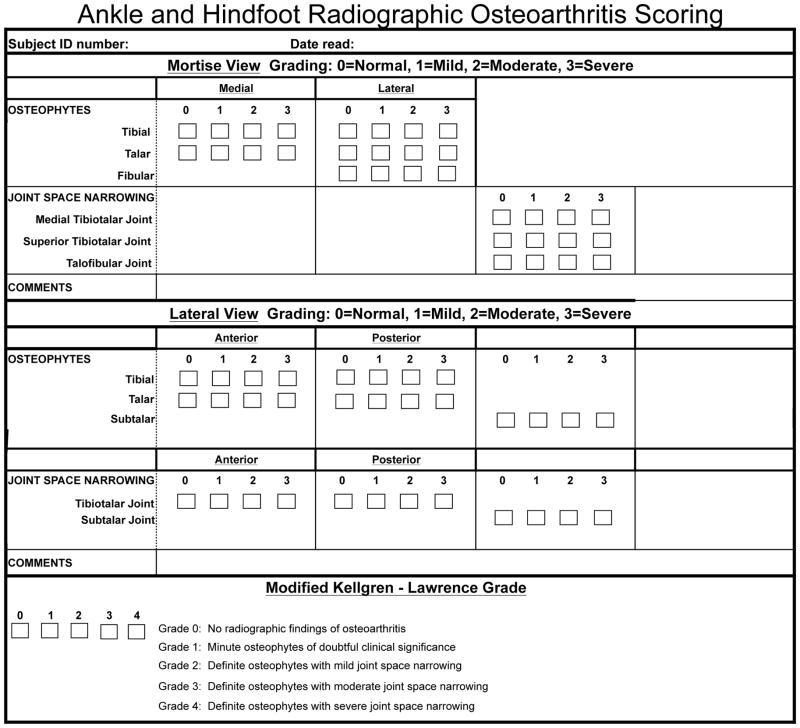
The core set of ankle and hindfoot radiographs (n=276) was obtained from the 138 participants who returned for follow-up as part of the NIH-funded Prediction of OA Progression (POP) study (a knee OA cohort further described in [1]). Initial scoring (by JR), using a standardized radiograph scoring form (Figure 1), revealed that the POP ankle radiographs did not include all of the radiographic features (primarily lacking severe grades) necessary for a comprehensive atlas. We hypothesized that the worst cases of ankle OA might be found among the patients evaluated for Orthopaedic interventions. We therefore screened additional deidentified radiographs of the ankle and hindfoot (n=785 patients) obtained during the course of clinical orthopaedic care during a 6-month period at Duke University Medical Center. The few additional missing grades were supplemented with the assistance of a foot and ankle specialist in Orthopaedic surgery (SA, 5 cases reviewed) and a musculoskeletal radiologist (TH, 13 cases reviewed). Of the 80 images needed for the main features (Figures 2, 3, 4, 5, 6, 7, 8, 9, 10, 11, 12, 13, 14, 15, 16, 17, 18, 19, 20), 66 were obtainable from the POP cohort and 14 were obtained using these other screening methods. All study procedures were approved by the Duke Institutional Review Board. All radiographs were anonymized for review and processing.
Figure 1.
Sample scoring form to facilitate grading of ankle and hindfoot radiographs for features demonstrated in atlas.
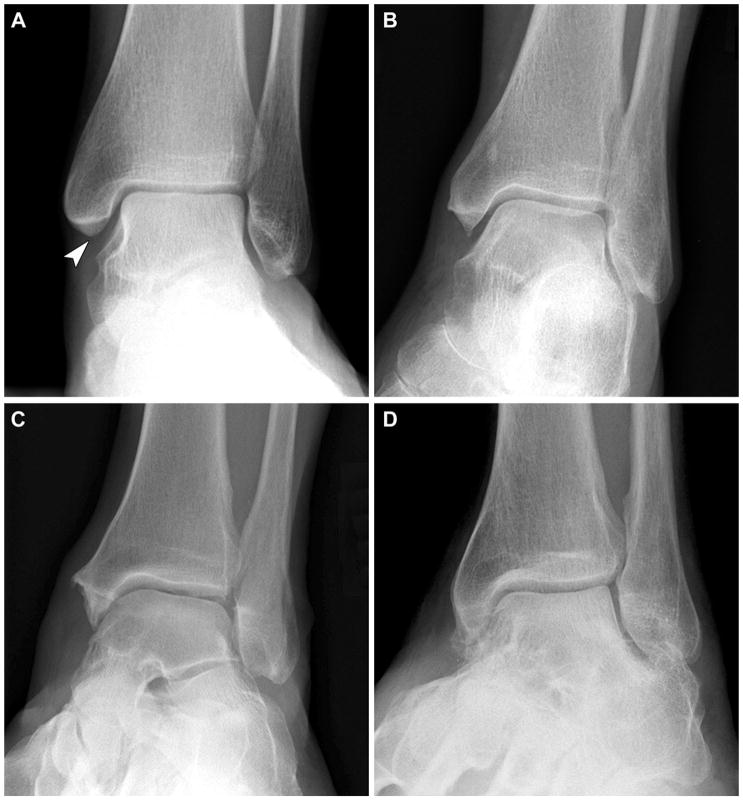
Figure 2.
Ankle Joint - Mortise view: (A) grade 0 normal, (B) grade 1 medial tibial osteophyte, (C) grade 2 medial tibial osteophyte, and (D) grade 3 medial tibial osteophyte.
Figure 3.
Ankle Joint - Mortise view: (A) grade 0 normal, (B) grade 1 lateral tibial osteophyte, (C) grade 2 lateral tibial osteophyte, and (D) grade 3 lateral tibial osteophyte.
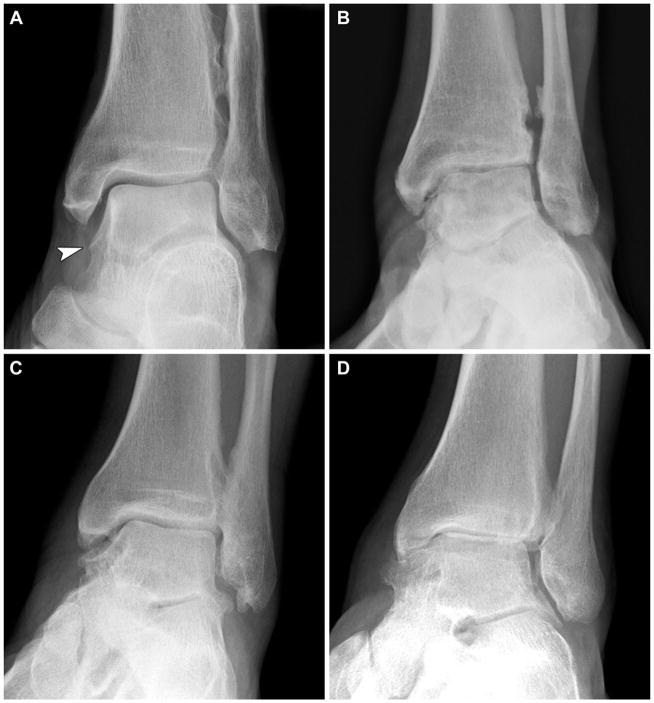
Figure 4.
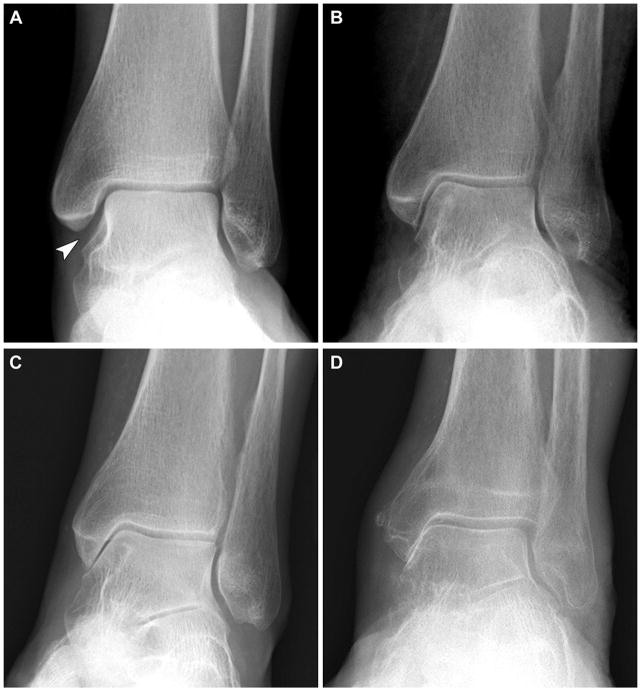
Ankle Joint - Mortise view: (A) grade 0 normal, (B) grade 1 medial talar osteophyte, (C) grade 2 medial talar osteophyte, and (D) grade 3 medial talar osteophyte.
Figure 5.
Ankle Joint - Mortise view: (A) grade 0 normal, (B) grade 1 lateral talar osteophyte, (C) grade 2 lateral talar osteophyte, and (D) grade 3 lateral talar osteophyte.
Figure 6.
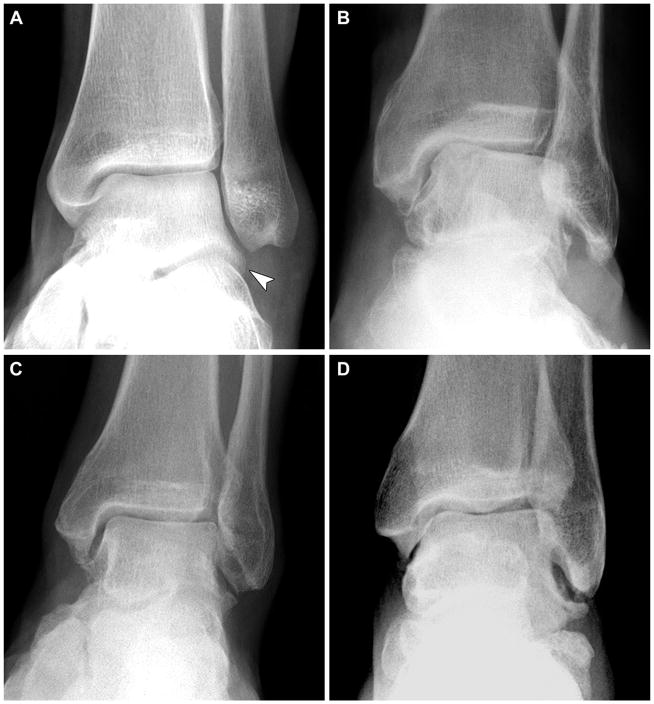
Ankle Joint - Mortise view: (A) grade 0 normal, (B) grade 1 distal fibular osteophyte, (C) grade 2 distal fibular osteophyte, and (D) grade 3 distal fibular osteophyte.
Figure 7.
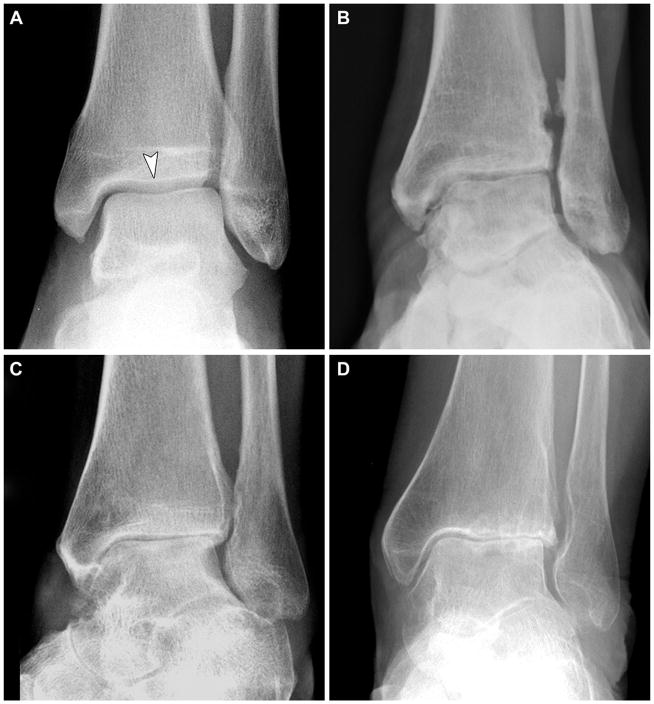
Ankle Joint - Mortise view: (A) grade 0 normal, (B) grade 1 medial tibiotalar joint space narrowing, (C) grade 2 medial tibiotalar joint space narrowing, and (D) grade 3 medial tibiotalar joint space narrowing.
Figure 8.
Ankle Joint - Mortise view: (A) grade 0 normal, (B) grade 1 superior tibiotalar joint space narrowing, (C) grade 2 superior tibiotalar joint space narrowing, and (D) grade 3 superior tibiotalar joint space narrowing.
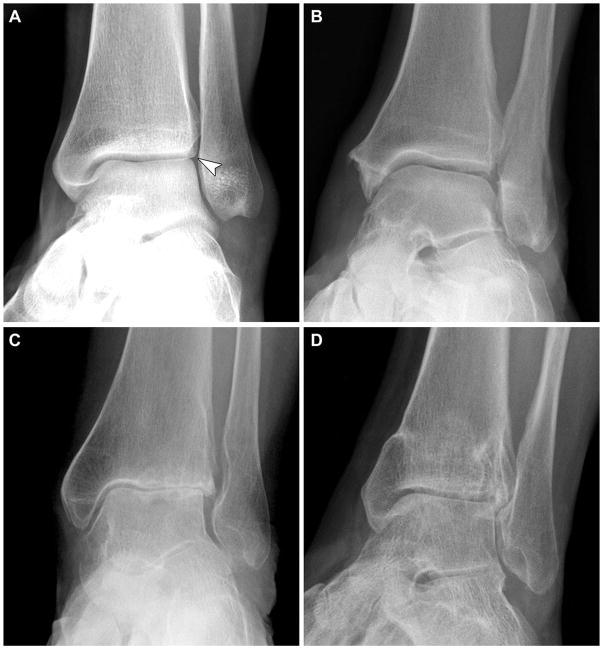
Figure 9.
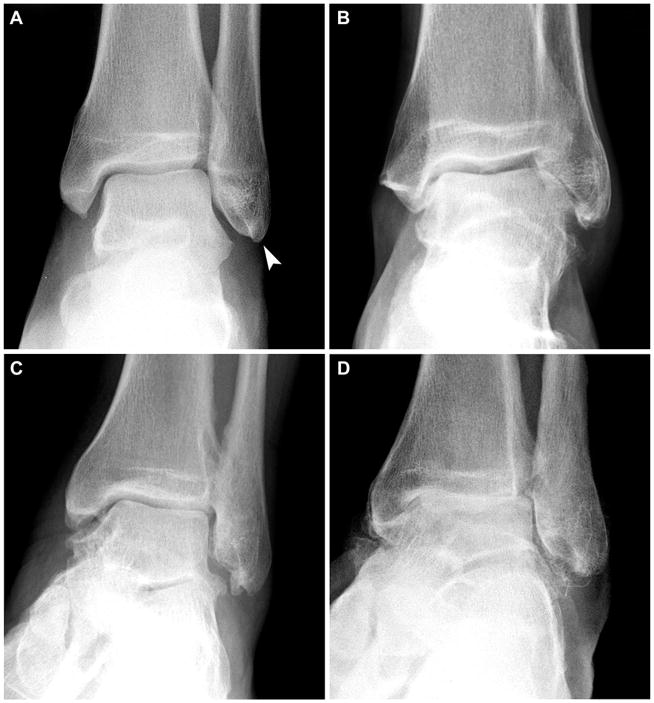
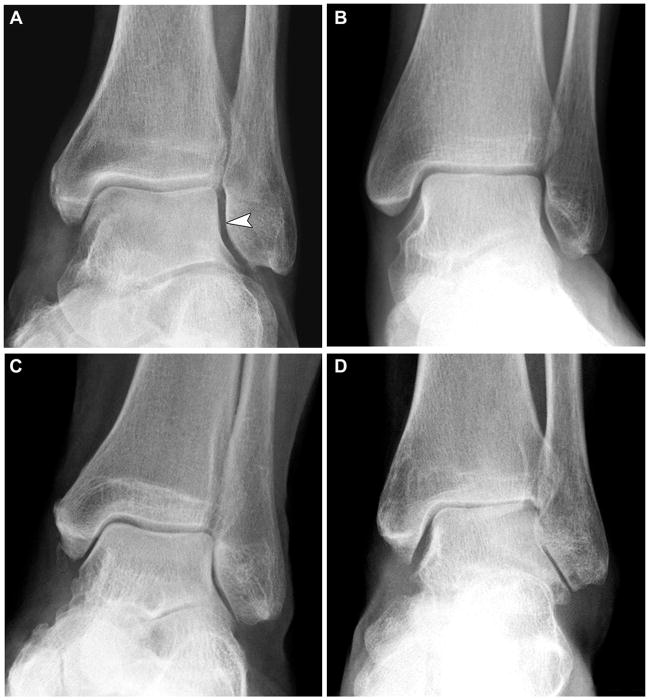
Ankle Joint - Mortise view: (A) grade 0 normal, (B) grade 1 talofibular joint space narrowing, (C) grade 2 talofibular joint space narrowing, and (D) grade 3 talofibular joint space narrowing.
Figure 10.
Ankle Joint - Lateral view: (A) grade 0 normal, (B) grade 1 anterior tibial osteophyte, (C) grade 2 anterior tibial osteophyte, and (D) grade 3 anterior tibial osteophyte.
Figure 11.
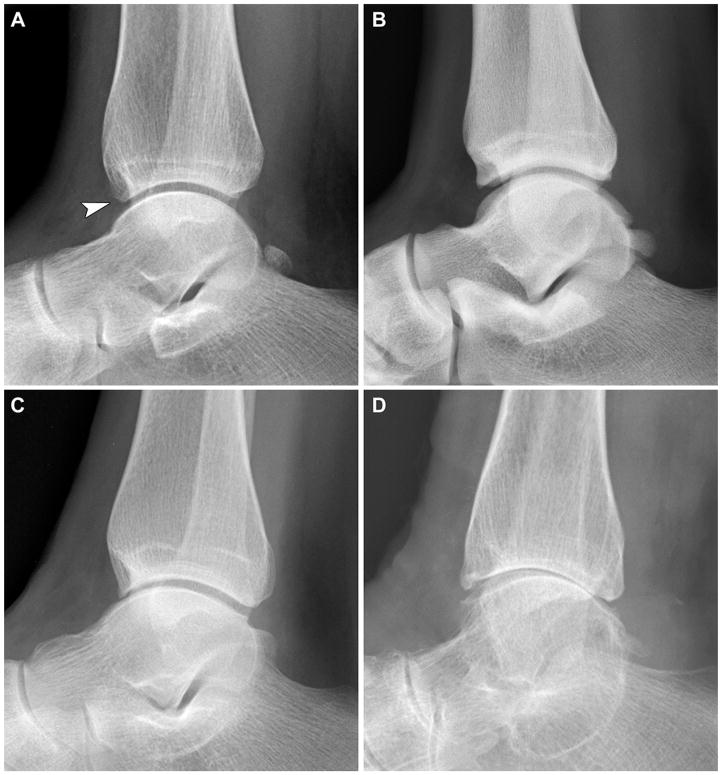
Ankle Joint - Lateral view: (A) grade 0 normal, (B) grade 1 posterior tibial osteophyte, (C) grade 2 posterior tibial osteophyte, and (D) grade 3 posterior tibial osteophyte.
Figure 12.
Ankle Joint - Lateral view: (A) grade 0 normal, (B) grade 1 anterior talar osteophyte, (C) grade 2 anterior talar osteophyte, and (D) grade 3 anterior talar osteophyte.
Figure 13.
Ankle Joint - Lateral view: (A) grade 0 normal, (B) grade 1 posterior talar osteophyte, (C) grade 2 posterior talar osteophyte, and (D) grade 3 posterior talar osteophyte.
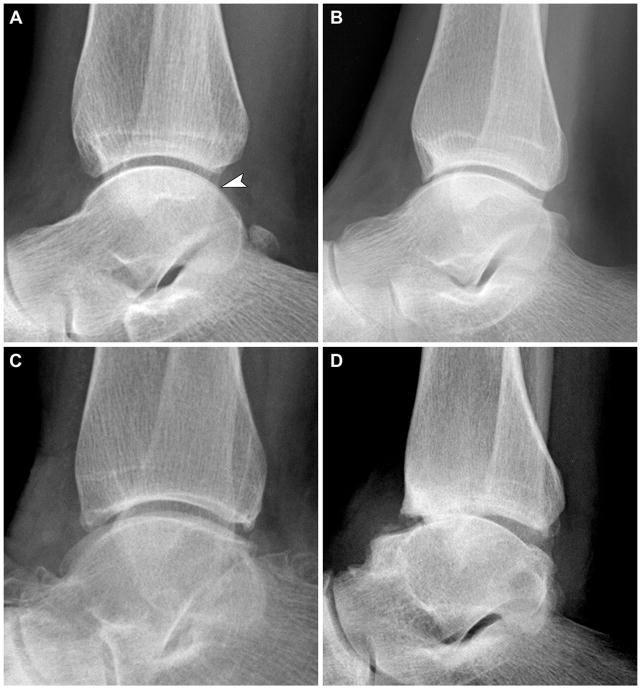
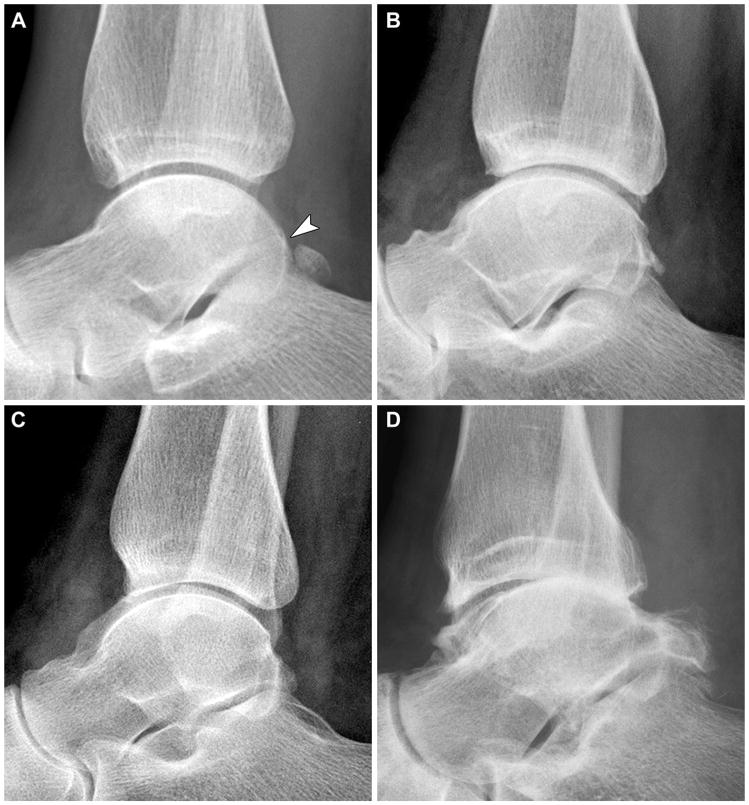
Figure 14.
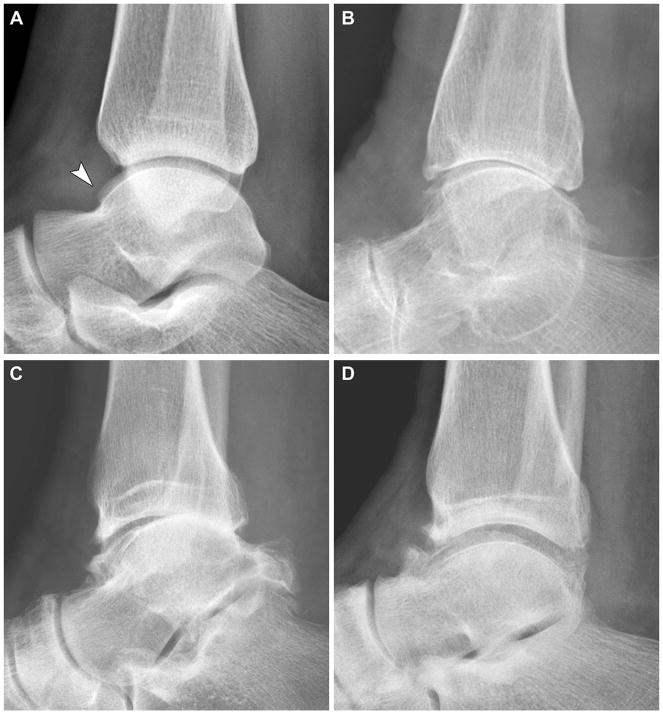
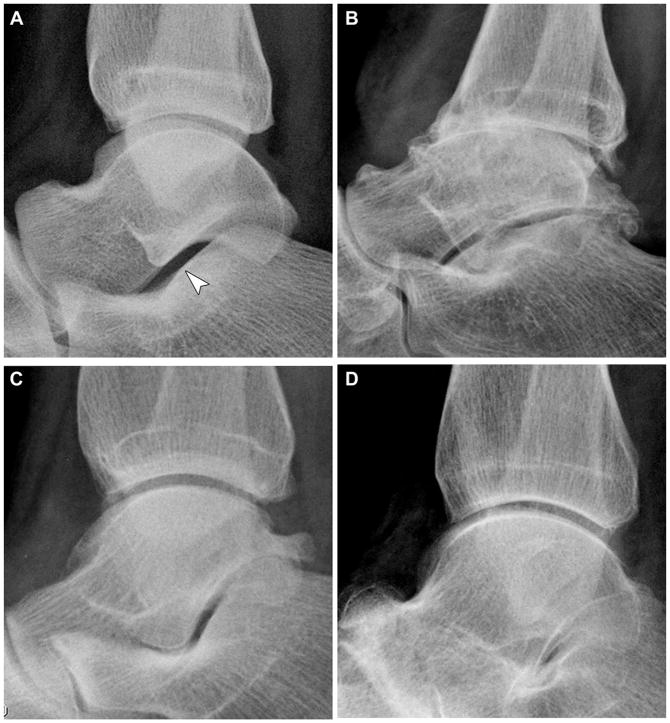
Subtalar Joint - Lateral view: (A) grade 0 normal, (B) grade 1 posterior talar osteophyte, (C) grade 2 posterior talar osteophyte, and (D) grade 3 posterior talar osteophyte.
Figure 15.
Ankle Joint - Lateral view: (A) grade 0 normal, (B) grade 1 anterior tibiotalar joint space narrowing, (C) grade 2 anterior tibiotalar joint space narrowing, and (D) grade 3 anterior tibiotalar joint space narrowing.
Figure 16.
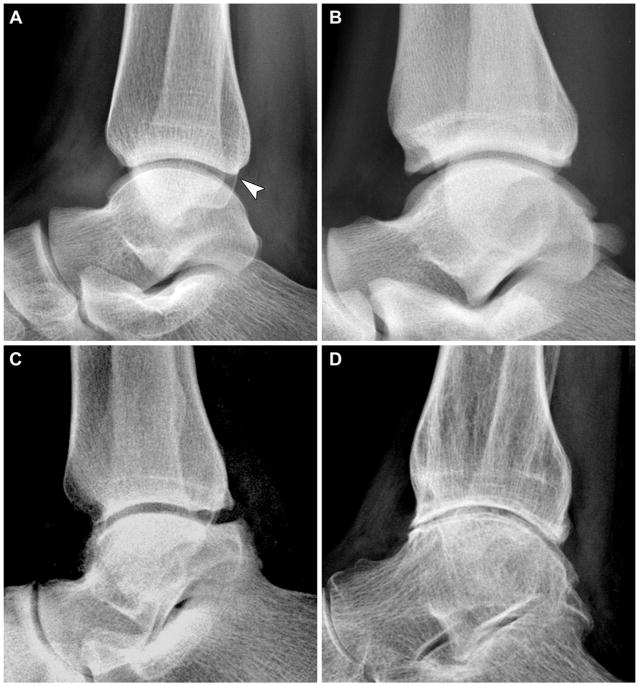
Ankle Joint - Lateral view: (A) grade 0 normal, (B) grade 1 posterior tibiotalar joint space narrowing, (C) grade 2 posterior tibiotalar joint space narrowing, and (D) grade 3 posterior tibiotalar joint space narrowing.
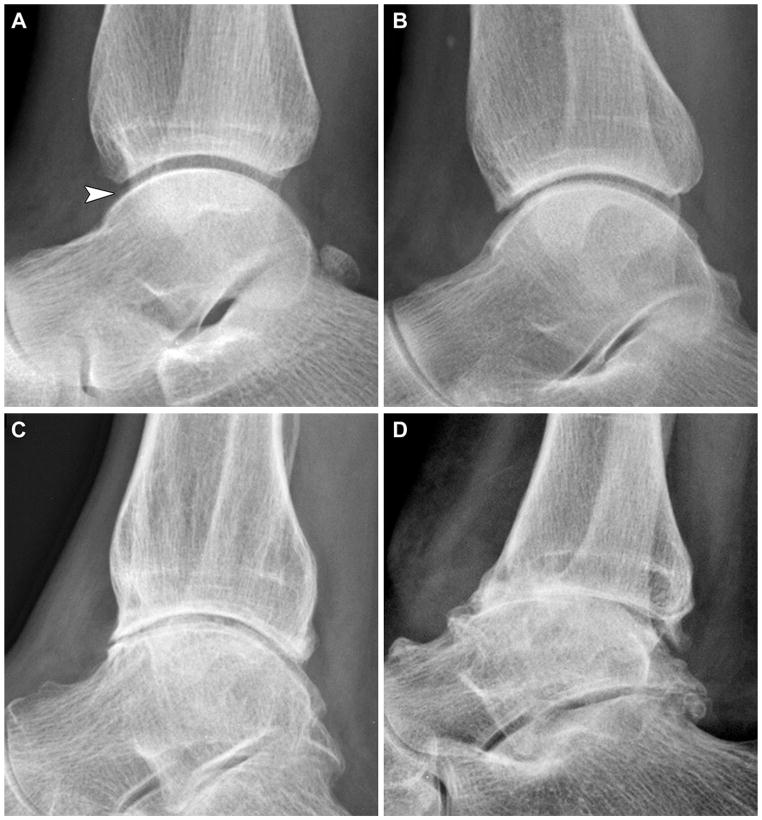
Figure 17.
Subtalar Joint - Lateral view: (A) grade 0 normal, (B) grade 1 subtalar joint space narrowing, (C) grade 2 subtalar joint space narrowing, and (D) grade 3 subtalar joint space narrowing.
Figure 18.
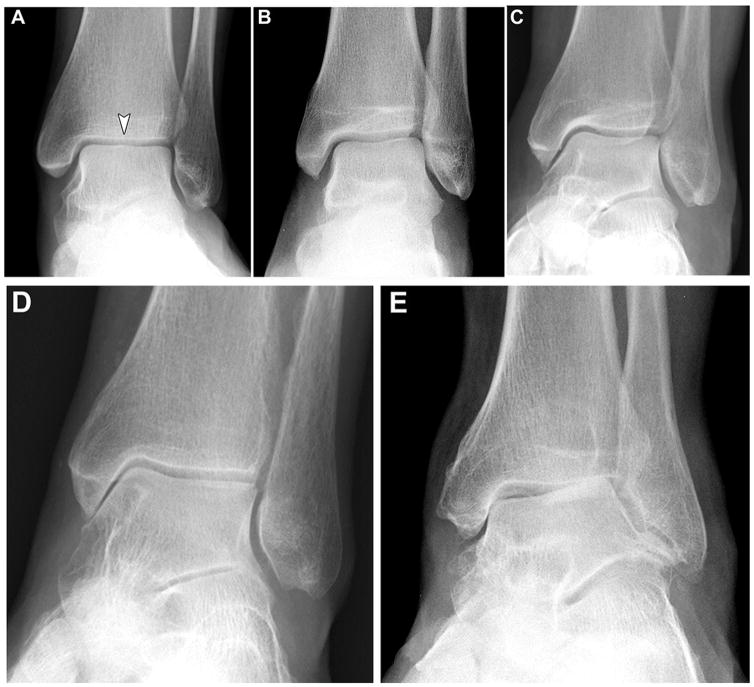
Ankle Joint - Mortise view: (A) grade 0 normal, (B) Kellgren-Lawrence grade 1, (C) Kellgren-Lawrence grade 2, (D) Kellgren-Lawrence grade 3, and (E) Kellgren-Lawrence grade 4.
Figure 19.
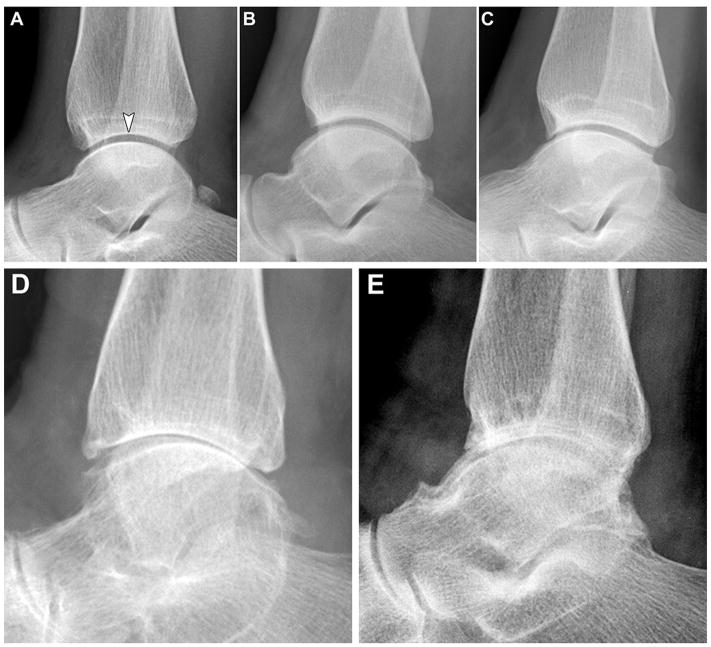
Ankle Joint - Lateral view: (A) grade 0 normal, (B) Kellgren-Lawrence grade 1, (C) Kellgren-Lawrence grade 2, (D) Kellgren-Lawrence grade 3, and (E) Kellgren-Lawrence grade 4.
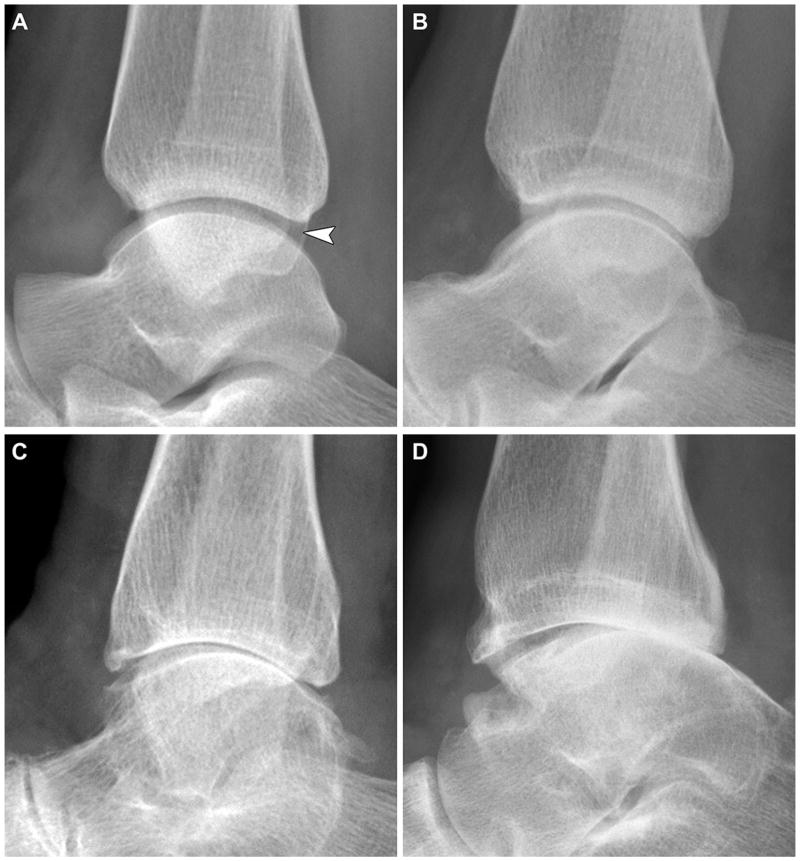
Figure 20.
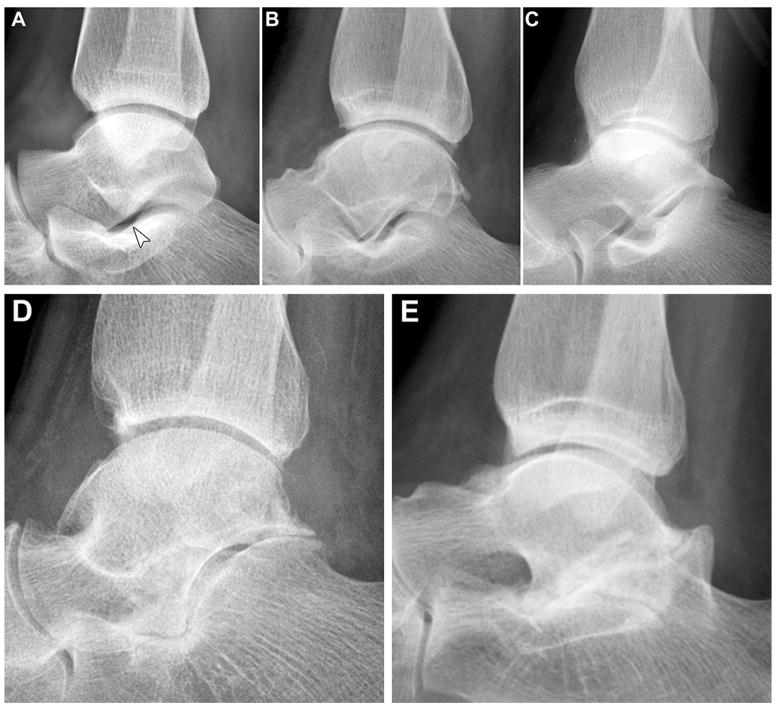
Subtalar Joint - Lateral view: (A) grade 0 normal, (B) Kellgren-Lawrence grade 1, (C) Kellgren-Lawrence grade 2, (D) Kellgren-Lawrence grade 3, and (E) Kellgren-Lawrence grade 4.
Radiograph Acquisition
In the POP study, individual weight-bearing ankle radiographs were performed with equal distribution of weight on both legs without footwear and 10 degrees internal rotation of the foot/ankle (mortise view) with the beam centered on the ankle. Lateral weight-bearing ankle radiographs were obtained individually with the beam centered on the medial aspect of the ankle joint with the foot/ankle in 15 degrees external rotation as is routinely performed for a lateral radiograph of the ankle and subtalar joints. Of note, the mortise and lateral views of the ankle are routinely performed in the clinical setting when ankle or subtalar joint pathology is suspected. It was therefore possible to obtain ankle radiographs that approximated the positioning characteristics of the POP cohort radiographs when supplemental images (as described above) were needed to represent specific features in the atlas.
Radiograph Image Selection and Evaluation
Each radiograph was selected to best represent each of the severity grade categories. and a preliminary atlas was developed. A series of sessions were held to review and refine the preliminary atlas followed by further review with two musculoskeletal radiologists (JBR and TWH). When disagreements existed, a radiograph was replaced with another radiograph considered to be a better representation of the finding in question until full consensus was achieved for each image. All of the radiographs that were reviewed by the authors had been previously de-identified and there was no clinical data available relating to any patient’s history of trauma or past surgeries. The only indication of these events was the presence of hardware, which served to eliminate the image from consideration for the atlas. The images included in the atlas were reviewed on multiple occasions by TMK, VBK, TWH, and JBR in order to assure that findings of interest were compatible with OA as opposed to other etiologies.
Three joints were included for grading in the final atlas: the tibiotalar joint (TTJ, Figures 2–5, 7–8, 10–13, 15–16, 18–19), the talofibular joint (TFJ, Figures 6 and 9), and the subtalar joint (STJ or talocalcaneal joint, Figures 14, 17 and 20). These joints were selected for their ability to be affected by OA and their ability to be well visualized on either mortise and/or lateral radiographs.
For each joint, the presence and severity of joint space narrowing (JSN) was graded as none (score=0), mild (score=1), moderate (score=2), or severe (score=3). In assessing JSN, involvement of the TTJ was further subdivided into JSN of the medial (Figure 7) and superior (Figure 8) aspects of the ankle TTJ joint (using mortise projections), as well as anterior (Figure 15) and posterior (Figure 16) aspects of the ankle TTJ joint (using lateral projections). JSN of the ankle TFJ was not further subdivided and was assessed using mortise projections only (Figure 9). Likewise, JSN of the STJ was not further subdivided and was assessed using lateral projections only (Figure 17). Clinically, the STJ is routinely only evaluated on the lateral projection.
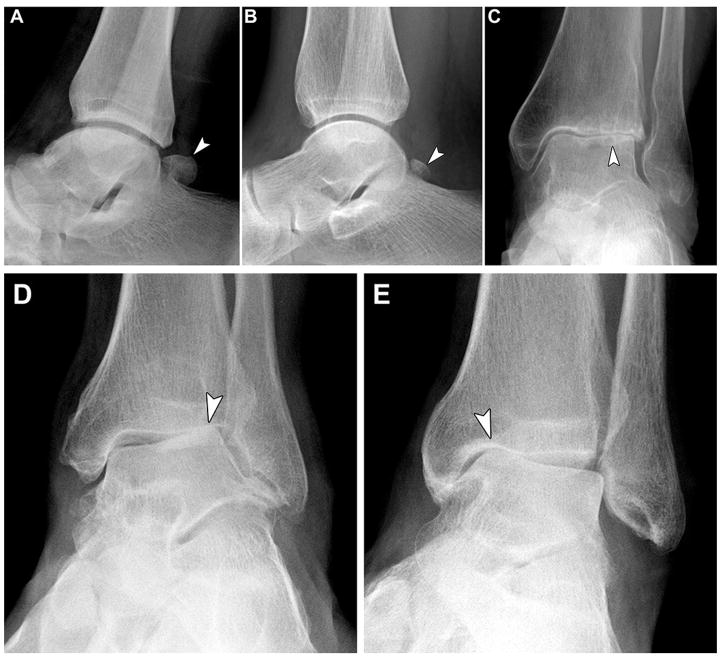
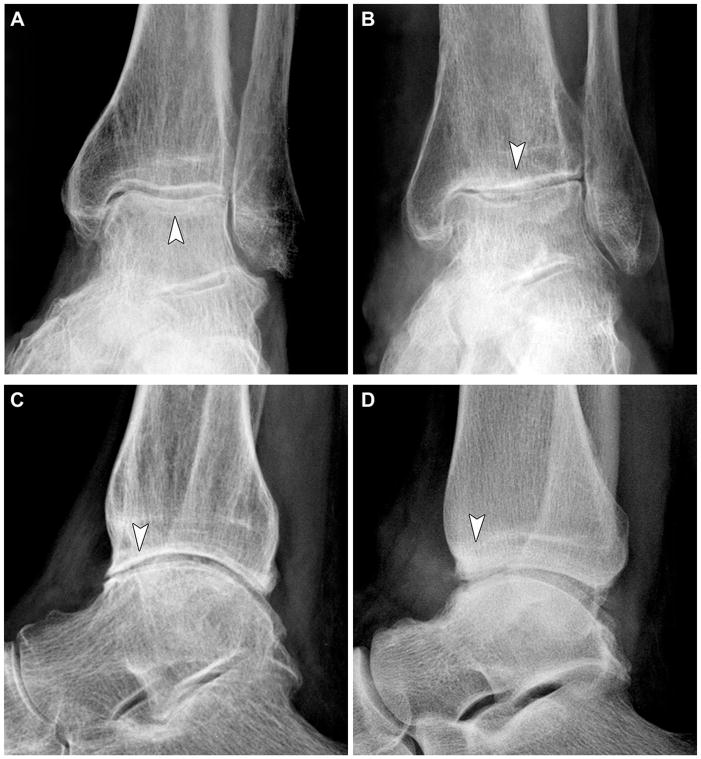
The presence and severity of osteophytes (OST) were graded as absent (score=0), small (score=1), moderate (score=2), or large (score=3). Osteophytes were graded at the medial, lateral, anterior, and posterior tibia (Figures 2, 3, 10 and 11, respectively), the distal fibula (Figure 6), and the medial, lateral, anterior, and posterior talus (Figures 4, 5, 12 and 13, respectively). In addition, osteophytes of the posterior talus were also graded at the level of the subtalar joint (Figure 14). OST of the distal fibula as well as medial and lateral tibia and talus were graded using mortise projections. OST of the anterior and posterior tibia and talus were graded using lateral projections. Similar to the grading of JSN, OST of the STJ were graded using lateral projections. Other abnormalities of the ankle were scored as either present or absent; these abnormalities were presence of an os trigonum, subchondral cysts (geodes), talar tilt (Figure 21) and sclerosis of the TTJ (Figure 22).
Figure 21.
Ankle: (A) os trigonum, (B) os trigonum, (C) subchondral cysts, (D) lateral talar tilt, (E) medial talar tilt.
Figure 22.
Ankle: (A–D) examples of subchondral sclerosis.
Finally, the Kellgren-Lawrence scale for grading the TTJ and STJ was modified (Table 1). The TTJ was graded in both mortise and lateral views (Figures 18–19) and the STJ was graded on the lateral view only (Figure 20).
Table 1.
Proposed modified Kellgren-Lawrence grade for ankle osteoarthritis.
| Grade | Description |
|---|---|
| 0 | No radiographic findings of osteoarthritis |
| 1 | Minute osteophytes of doubtful clinical significance |
| 2 | Definite osteophytes with mild joint space narrowing |
| 3 | Definite osteophytes with moderate joint space narrowing |
| 4 | Definite osteophytes with severe joint space narrowing |
Reliability of the Atlas
To assess inter- and intra-rater reliability of ankle and hindfoot grading with the atlas, mortise and lateral radiographs of the ankle (from 30 individuals) that did not appear in the atlas were selected by TMK for grading by three musculoskeletal radiologists. An effort was made to select radiographs demonstrating a full range of severity of both OST and JSN in all joints. However, grade 3 findings of both OST and JSN were uncommon, and the majority of radiographs demonstrated scores of 0 – 2 in all joints assessed. One radiologist (A) is extensively involved in radiographic image scoring for OA research. A second radiologist (B) is primarily employed as a clinical musculoskeletal radiology. These two radiologists (A and B) assisted with assembly of the atlas and its review. The third clinical radiologist (C), not involved in the atlas development process, was sent a copy of the images as pdfs for review as needed for image scoring but was purposefully not provided with training on the atlas. Using the atlas as a reference, these three examiners independently rated ankle radiographs from the 30 subjects (3 subjects had lateral views only, the remainder had mortise and lateral views) to determine intra- and inter-rater reliability for each of the OA characteristics featured semi-quantitatively in the atlas (see Figure 1 for sample scoring form). No questions or discussion were allowed during grading. The images were read on diagnostic quality monitors in low ambient light. To assess intra-rater reliability, the radiographs were regraded by each observer a minimum of 2 weeks later (range 2–25 weeks), without reference to previous ratings. All radiology examiners are fellowship-trained musculoskeletal radiologists with several years’ experience in evaluating ankle radiographs.
Statistical Analysis
Intra- and inter-rater reliability was evaluated by the kappa (κ) statistic using the contingency platform in JMP Pro (version 11.2.1, SAS Institute). The κ statistic is an appropriate statistic to assess the level of agreement between observers when using ordinal data.
Reliability Results
A total of 3 radiologists scored the ankle and hindfoot radiographs of 30 anonymized subjects for the features presented in the accompanying atlas. Results of intra-rater and inter-rater reliability κ values for each feature are shown in Table 2. In general and as expected, the two radiologists who had advance training on the atlas (A and B) had the higher intra-rater reliability scores of the three raters (Table 2). The OA research radiologist had substantial intrarater reliability (κ 0.69–1.00) for all features except lateral tibial osteophyte (κ 0.46). Joint space narrowing of the superior aspect of the tibiotalar joint yielded the highest intra- and inter-rater reliability scores.
Table 2.
Intra-rater and inter-rater reliability of ankle radiograph scoring by three musculoskeletal radiologists.
| Mortise View | All Views | |||||||||
|---|---|---|---|---|---|---|---|---|---|---|
| Ankle OST | Ankle JSN | KL | ||||||||
| Tibia (med) | Tibia (lat) | Talus (med) | Talus (lat) | Distal Fibula | TTJ (med) | TTJ (superior) | TFJ (lat) | All Joints | ||
| Rater | Atlas Figure | 2 | 3 | 4 | 5 | 6 | 7 | 8 | 9 | 18–20 |
| A | Intra-rater κ | 0.72 | 0.46 | 0.78 | 0.81 | 0.83 | 0.94 | 1 | 0.77 | 0.91 |
| B | 0.57 | 0.5 | 0.64 | 0.39 | 0.28 | 0.56 | 0.64 | 0.69 | 0.58 | |
| C | 0.29 | 0.58 | 0.56 | 0.24 | 0.17 | 0.15 | 0.8 | 0.36 | 0.37 | |
| A, B, C (min/max) | Inter-rater κ | 0.17/0.54 | 0.52/0.54 | 0.21/0.40 | 0.21/0.35 | 0.17/0.71 | 0.24/0.37 | 0.47/0.86 | 0.27/0.36 | 0.22/0.40 |
| Lateral View | |||||||||
|---|---|---|---|---|---|---|---|---|---|
| Ankle OST | Subtalar OST | Ankle JSN | Subtalar JSN | ||||||
| Tibia (ant) | Tibia (post) | Talus (ant) | Talus (post) | Talus (post) | TTJ (ant) | TTJ (post) | STJ | ||
| Rater | Atlas Figure | 10 | 11 | 12 | 13 | 14 | 15 | 16 | 17 |
| A | Intra-rater κ | 0.69 | 0.88 | 0.79 | 0.76 | 0.79 | 0.88 | 0.85 | 0.84 |
| B | 0.65 | 0.89 | 0.66 | 0.80 | 0.48 | 0.59 | 0.79 | 0.64 | |
| C | 0.63 | 0.28 | 0.74 | 0.47 | 0.66 | 0.59 | 0.49 | 0.53 | |
| A, B, C (min/max) | Inter-rater κ | 0.45/0.72 | 0.37/0.71 | 0.47/0.56 | 0.34/0.47 | 0.27/0.36 | 0.12/0.48 | 0.23/0.58 | 0.09/0.46 |
TTJ=tibiotalar joint; STJ=subtalar joint; TFJ=talofibular joint; KL=Kellgren-Lawrence grade; OST=osteophyte; JSN=joint space narrowing med=medial; lat=lateral; ant=anterior; post=posterior
Discussion
Based on the amount of effort needed to identify the various features represented in the atlas, it appeared that certain findings, particularly severe grades of OA features, were less common than others. This experience corroborated the general impression that severe (grades 3 and 4) degeneration rarely occurs in the ankle [5]. Although all degrees of joint space narrowing severity were found fairly frequently in all joints, certain areas of the ankle rarely displayed osteophytes. For instance, posterior talar osteophytes were unusual, especially those of grade 2 or 3 severity. Lateral tibial osteophytes were also uncommon, and very difficult to visualize by standard antero-posterior (AP) or mortise views, as the fibula frequently overlaps the lateral tibia on these views (termed tibiofibular overlap) and sits into a groove in the tibia called the incisura fibularis. With respect to the distal fibula, a few instances of pseudo-osteophyte (arising from a healed fracture) were observed that could be distinguished from a true osteophyte by evaluating alternative views besides the mortise view. The subtalar joint is very irregular and most of the joint lies oblique to the x-ray beam on a lateral projection. Although severe “bone on bone” joint space narrowing can still be readily apparent, grading subtle degrees of joint space narrowing of the subtalar joint is particularly challenging. This difficulty was reflected in the range of inter-rater kappa scores ranging from 0.09 (lowest kappa for any feature) to 0.46. The subtalar joint can be better visualized on a series of Broden’ views [18]. However, we chose not to include these views in the atlas because they are not routinely performed in the orthopaedic foot and ankle clinical setting and are not weight-bearing views.
We recommend excluding subchondral sclerosis as a feature of an ankle Kellgren-Lawrence grade. The presence of subchondral sclerosis by the original Kellgren-Lawrence grade necessitates a grade of 4, implying severe OA. However, subchondral sclerosis is frequently seen in mild ankle OA, in association with OST and JSN scores of 1 or 2, and is not uncommonly the only finding suggestive of OA in the ankle. As the presence of subchondral sclerosis does not necessarily correlate with the presence or severity of OST or JSN, the exclusion of sclerosis from the Kellgren-Lawrence grading scale decreases the potential for confusion and increases the clinical relevance of the ankle Kellgren-Lawrence scale.
We also modified grade 2 of the Kellgren-Lawrence grading scale. Originally, grade 2 was defined as “definite osteophytes with unimpaired joint space”; whereas the presence of joint space narrowing, albeit mild, necessitated a Kellgren-Lawrence grade of 3 or 4. Our modification describes grade 2 as “definite osteophytes with mild joint space narrowing”. This change improves the ability to use Kellgren-Lawrence grades to score ankle pathology incrementally. We believe that interpretation of the Kellgren-Lawrence score of the ankle is fairly straightforward when assessing the lateral view, where two discrete joint spaces are evaluated, the tibiotalar joint and the subtalar joint. However, assessing the Kellgren-Lawrence score of an ankle by the mortise view can be challenging, as different findings with different degrees of severity may be seen in the talofibular joint, and superior or medial tibiotalar joint. In the case of an ankle radiograph that has different Kellgren-Lawrence scores in the above named areas, we believe that it is reasonable to grade the mortise view of the ankle by the most severe joint area involved.
The ankle atlas was built using images, either lateral or mortise, in isolation, as opposed to paired lateral and mortise views from the same patient. Clearly, the mortise view provides the greatest clarity for some joints, while the lateral projection is most suitable for others. Often, but not always, severe osteoarthritic changes were evident on both projections. In clinical practice, when both lateral and mortise views are available for a given patient, it may perhaps be argued that Kellgren-Lawrence scores of both views in the same patient would provide a degree of redundancy that is not clinically meaningful. As discussed for the different joints visualized on the mortise view, we believe that it is reasonable to grade a patient’s overall ankle by the most severe joint area involved, whether on mortise or lateral views.
Several radiographic grading systems have been previously proposed to evaluate OA of the ankle and select between treatment options [10–14]. Takakura et al [10] used weight-bearing ankle radiographs to classify varus ankle arthritis into four stages. However, Takakura provided only 4 low-resolution single view anteroposterior ankle images corresponding to each of these stages. Valgus ankle arthritis was not included. His monograph is therefore not suited to being a radiographic atlas. Tanaka et al [11] utilized the Takakura grading method but further subdivided stage 3 into stages 3a and 3b. Tanaka provided only two images each of stage 3a and 3b ankle radiographs; therefore it is also not suited to be a radiographic atlas. Moon et al. [12] summarized the various grading systems available for the ankle including a modified Kellgren-Lawrence scale by Kijowski [13], the Takakura scale, a modified version of the Takakura system by Pagenstert et al. [14], and a scale by van Dijk [15]. Based on weighted kappa scores, inter- and intra-rater reliabilities ranged from 0.51 to 0.89 for all these grading systems; the correlation of radiographic and arthroscopic scores were similar for the grading systems (r=0.42–0.53 based on 98 ankles from 83 patients). However, Moon et al. did not provide any radiographs and the study therefore also does not fulfill the need for an ankle radiographic atlas.
In conclusion, this radiographic atlas has been developed to facilitate standardized grading of OA from ankle and subtalar joint radiographs. It represents the first comprehensive pictorial radiographic atlas for the ankle and hindfoot. The overall intra- and inter-rater reliability of radiograph grading using the atlas was high. We recommend weight-bearing radiographs centered on the ankle to provide the best determination of joint space narrowing. We found mortise and lateral views of the ankle to provide optimal visualization of OA features. In the absence of the mortise view, AP views could be substituted. It is anticipated that this atlas will assist with standardization of scoring of ankle and hindfoot OA by basic and clinical OA researchers.
Acknowledgments
We wish to acknowledge funding by NIH/NIAMS R01-AR48769 that supported the costs of acquisition of the majority of the ankle radiographs. We also wish to thank OARSI for supporting the production of high quality tif images for this atlas. The views expressed in this article are those of the author(s) and do not necessarily reflect the official policy or position of the Department of the Navy, Department of Defense, or the United States Government.
We wish to thank Steve Conlon, Department of Pathology at Duke University for his expert assistance with processing the medical images. We also wish to thank Cecil Charles and Maureen Ainslie for assistance with acquisition and deidentification of a portion of the images. We wish to acknowledge NIH R01-AR48769 for funding to acquire the majority of ankle radiographs and OARSI for funding high quality tiff image production. The views expressed in this article are those of the author(s) and do not necessarily reflect the official policy or position of the Department of the Navy, Department of Defense, or the United States Government.
Footnotes
Author contributions:
VBK conceived of the atlas; VBK, TK, GM, TH and SA acquired the images for the atlas; VBK, TK, GM, JBR, TH and SA developed the atlas; JBR, TH and JC scored all images; all authors assisted with drafting the manuscript, reviewing and approving the manuscript and atlas for submission.
Conflicts of Interest:
No authors have any conflict of interest or competing interests with respect to this work.
Publisher's Disclaimer: This is a PDF file of an unedited manuscript that has been accepted for publication. As a service to our customers we are providing this early version of the manuscript. The manuscript will undergo copyediting, typesetting, and review of the resulting proof before it is published in its final citable form. Please note that during the production process errors may be discovered which could affect the content, and all legal disclaimers that apply to the journal pertain.
References
- 1.McDaniel G, Renner JB, Sloane R, Kraus VB. Association of knee and ankle osteoarthritis with physical performance. Osteoarthritis Cartilage. 2011;19:634–638. doi: 10.1016/j.joca.2011.01.016. [DOI] [PMC free article] [PubMed] [Google Scholar]
- 2.Kraus VB, Worrell TW, Renner JB, Coleman RE, Pieper CF. High prevalence of contralateral ankle abnormalities in association with knee osteoarthritis and malalignment. Osteoarthritis Cartilage. 2013;21:1693–1699. doi: 10.1016/j.joca.2013.07.008. [DOI] [PMC free article] [PubMed] [Google Scholar]
- 3.Kuijt MT, Inklaar H, Gouttebarge V, Frings-Dresen MH. Knee and ankle osteoarthritis in former elite soccer players: a systematic review of the recent literature. J Sci Med Sport. 2012;15:480–487. doi: 10.1016/j.jsams.2012.02.008. [DOI] [PubMed] [Google Scholar]
- 4.Rietveld AB. Dancers' and musicians' injuries. Clin Rheumatol. 2013;32:425–434. doi: 10.1007/s10067-013-2184-8. [DOI] [PubMed] [Google Scholar]
- 5.Muehleman C, Margulis A, Bae WC, Masuda K. Relationship between knee and ankle degeneration in a population of organ donors. BMC Med. 2010;8:48. doi: 10.1186/1741-7015-8-48. [DOI] [PMC free article] [PubMed] [Google Scholar]
- 6.Thomas RH, Daniels TR. Ankle arthritis. J Bone Joint Surg Am. 2003;85-A:923–936. doi: 10.2106/00004623-200305000-00026. [DOI] [PubMed] [Google Scholar]
- 7.Huch K, Kuettner KE, Dieppe P. Osteoarthritis in ankle and knee joints. Semin Arthritis Rheum. 1997;26:667–674. doi: 10.1016/s0049-0172(97)80002-9. [DOI] [PubMed] [Google Scholar]
- 8.Cushnaghan J, Dieppe P. Study of 500 patients with limb joint osteoarthritis. I. Analysis by age, sex, and distribution of symptomatic joint sites. Ann Rheum Dis. 1991;50:8–13. doi: 10.1136/ard.50.1.8. [DOI] [PMC free article] [PubMed] [Google Scholar]
- 9.Valderrabano V, Hintermann B, Horisberger M, Fung TS. Ligamentous posttraumatic ankle osteoarthritis. Am J Sports Med. 2006;34:612–620. doi: 10.1177/0363546505281813. [DOI] [PubMed] [Google Scholar]
- 10.Takakura Y, Tanaka Y, Kumai T, Tamai S. Low tibial osteotomy for osteoarthritis of the ankle. Results of a new operation in 18 patients. J Bone Joint Surg Br. 1995;77:50–54. [PubMed] [Google Scholar]
- 11.Tanaka Y, Takakura Y, Hayashi K, Taniguchi A, Kumai T, Sugimoto K. Low tibial osteotomy for varus-type osteoarthritis of the ankle. J Bone Joint Surg Br. 2006;88:909–913. doi: 10.1302/0301-620X.88B7.17325. [DOI] [PubMed] [Google Scholar]
- 12.Moon JS, Shim JC, Suh JS, Lee WC. Radiographic predictability of cartilage damage in medial ankle osteoarthritis. Clin Orthop Relat Res. 2010;468:2188–2197. doi: 10.1007/s11999-010-1352-2. [DOI] [PMC free article] [PubMed] [Google Scholar]
- 13.Kijowski R, Blankenbaker D, Stanton P, Fine J, De Smet A. Arthroscopic validation of radiographic grading scales of osteoarthritis of the tibiofemoral joint. AJR Am J Roentgenol. 2006;187:794–799. doi: 10.2214/AJR.05.1123. [DOI] [PubMed] [Google Scholar]
- 14.Pagenstert GI, Hintermann B, Barg A, Leumann A, Valderrabano V. Realignment surgery as alternative treatment of varus and valgus ankle osteoarthritis. Clin Orthop Relat Res. 2007;462:156–168. doi: 10.1097/BLO.0b013e318124a462. [DOI] [PubMed] [Google Scholar]
- 15.van Dijk CN, Verhagen RA, Tol JL. Arthroscopy for problems after ankle fracture. J Bone Joint Surg Br. 1997;79:280–284. doi: 10.1302/0301-620x.79b2.7153. [DOI] [PubMed] [Google Scholar]
- 16.Altman RD, Gold GE. Atlas of individual radiographic features in osteoarthritis, revised. Osteoarthritis Cartilage. 2007;15(Suppl A):A1–56. doi: 10.1016/j.joca.2006.11.009. [DOI] [PubMed] [Google Scholar]
- 17.Menz HB, Munteanu SE, Landorf KB, Zammit GV, Cicuttini FM. Radiographic classification of osteoarthritis in commonly affected joints of the foot. Osteoarthritis Cartilage. 2007;15:1333–1338. doi: 10.1016/j.joca.2007.05.007. [DOI] [PubMed] [Google Scholar]
- 18.Kwon DG, Chung CY, Lee KM, Kim TW, Sung KH, Kim DH, et al. Revisit of Broden's view for intraarticular calcaneal fracture. Clin Orthop Surg. 2012;4:221–226. doi: 10.4055/cios.2012.4.3.221. [DOI] [PMC free article] [PubMed] [Google Scholar]


