

Abstract
Purpose of the study
This study determined whether the NYU Caregiver Intervention for Adult Children (the NYUCI-AC) significantly reduced depressive symptoms and improved quality of life for adult child caregivers of persons with dementia.
Design and methods
The NYUCI-AC was evaluated within a single blinded randomized controlled trial. The sample included 107 adult child caregivers of persons with dementia (n = 54 assigned to the multi-component treatment group; n = 53 assigned to a contact control group). Participants completed comprehensive assessments every four months during the first year and every six months thereafter for at least two years and up to 3.79 years.
Results
Individual growth curve models found that caregivers in the NYUCI-AC treatment condition indicated statistically significant (p < .05) curvilinear decreases in symptoms of depression indicating withdrawal, apathy, and lack of vigor and increases in perceptions of overall quality of life over a three-year period in comparison to control caregivers.
Implications
The NYUCI-AC offered adult child caregivers the capacity, via individual and family counseling as well as ongoing support, to enhance their quality of life and overcome their social withdrawal and apathy over time. These findings lend additional support to the NYUCI as an evidence-based approach to support family caregivers of persons with dementia.
Keywords: Alzheimer’s disease, caregiving, depression
Introduction
The extent of unpaid help family caregivers provide their relatives with Alzheimer’s disease or a related dementia (ADRD) places them at considerable risk for increased depressive symptoms, psychiatric morbidity, and poor health.1-4 The costs of providing care to persons with ADRD is $4,766 more per year when compared to non-ADRD caregivers.5 Such costs are exacerbated for ADRD caregivers who experience depressive symptoms or decreased quality of life.4 While quality of life (QoL) is widely viewed as one of the key outcomes of healthcare promotion, empirical descriptions of QoL and clinical interventions to enhance QoL among ADRD caregivers have only recently emerged.6,7
Clinicians and researchers have developed a number of supportive interventions to improve ADRD caregivers’ emotional and psychological well-being. Among the most effective are approaches that combine multiple treatment modalities, such as the Resources for Enhancing Alzheimer Caregiver Health II8,9 and the NYU Caregiver Intervention (NYUCI). The NYUCI, originally created by Mary Mittelman and her clinical colleagues at NYU School of Medicine, combines individual counseling, family counseling, support group referral, and additional counseling for as long as a caregiver participates in the program. The NYUCI’s counseling structure is designed to build and enhance ADRD caregivers’ feelings of psychosocial support and thereby improve their emotional and physical well-being. The efficacy of the NYUCI was evaluated for spouse caregivers of persons with Alzheimer’s disease in New York City; results demonstrated that the multi-component intervention protocol was successful in reducing depressive symptoms for more than three years after baseline compared to usual care.10
The NYUCI’s positive effects resulted in it its recommendation as an evidence-based intervention for ADRD caregivers by the Administration on Aging and other organizations.11 However, the original study was conducted with spouse caregivers, and the translational potential of the NYUCI can be broadened via high quality evidence of efficacy for non-spouse family caregivers. This single-blinded, randomized controlled evaluation thus sought to determine whether the NYUCI approach resulted in reduced depressive symptoms and increased quality of life for adult child caregivers of persons with ADRD.
There are key differences in how spousal and adult child caregivers of persons with ADRD deliver and experience caregiving. Spouses are generally older than adult children, more likely to live with the person with ADRD, provide more extensive direct help with activities of daily living, and have less choice in whether to assume care responsibilities. For these reasons, spousal caregivers are at-risk for health complications themselves and are less likely to recognize or report the strain of care demands than other caregivers.12-14 However, adult children may experience greater family conflict or work disruption due to the need to balance multiple-life responsibilities.15-17 Although there are important differences in the caregiving experiences of spouses and adult children, few studies have examined whether specific interventions are equally effective for caregivers of varying kin relationship to the person with ADRD. Available findings are inconsistent.8,18,19
Conceptualization
The NYUCI is conceptually grounded in the stress process model for ADRD caregivers.20 The stress process model is guided by the mechanism of proliferation, where care demands necessitated by the illness of the care recipient (e.g., dementia severity) exacerbate primary subjective stress on the part of dementia family caregivers. Primary subjective stressors include feelings of exhaustion and fatigue related to dementia care responsibilities (role overload) or feelings of entrapment in the family caregiving role (role captivity). Heightened primary subjective stress is then postulated to proliferate, or spread, to more global domains of health of the ADRD caregiver such as depressive symptomatology or quality of life. Resources can stem the proliferation of stress in dementia caregiving: social support or formal services are two resources that may do so. The NYUCI is designed to build and improve the resources of ADRD caregivers by enhancing their feelings of adequate support and assisting them in adapting to and managing care demands.
Research Focus
Sustaining or improving caregiver mental health and quality of life throughout the dementia caregiving trajectory is likely to affect quality of care for the person with dementia.21 The multi-component NYUCI significantly reduced depressive symptoms among spousal caregivers, but few evaluations of whether a similar clinical approach could reduce depressive symptoms and improve QoL of adult child dementia caregivers exist. Our preliminary work found that the NYUCI adapted for adult children in Minnesota (the NYUCI-AC) delayed residential care placement of parents with dementia22 as well as reduced stress related to the management of disruptive behavior problems23 when compared to usual care controls; these results at least in part paralleled those of the original NYUCI.24,25 The focus of the current evaluation was to extend this work to determine whether adult children who received the NYUCI-AC in Minnesota would report greater decreases in depressive symptoms and greater improvement in overall quality of life than usual-contact controls over a 3-year follow-up period.
Methods
Procedure and Sample
A single blind, randomized controlled study design was utilized to evaluate the NYUCI-AC. Informed consent was obtained from all participants and the research protocol received approval from the University of Minnesota Institutional Review Board (IRB# 0508S72389). The sample included 107 adult child caregivers of parents with ADRD from the Minneapolis/St. Paul area and its outlying regions. The following criteria were used to identify eligible caregivers: a) the care recipient had to have a physician diagnosis of ADRD and live at home in the community at the time of the initial assessment; and b) the adult child caregiver had to self-identify as the primary caregiver, visit the care recipient at least once a week, and could not have received professional counseling for problems arising from being a caregiver in the year prior to enrollment. Recruitment was largely community-based and included mailed and online flyers distributed by community organizations and educational conferences in the Minneapolis/St. Paul region. Figure 1 presents a participant study flow diagram. A group assignment list was generated (using http://randomizer.org) to randomly assign adult child caregivers to the NYUCI-AC treatment condition (n = 54) or the contact control group (n = 53) following the baseline assessment.
Figure 1.
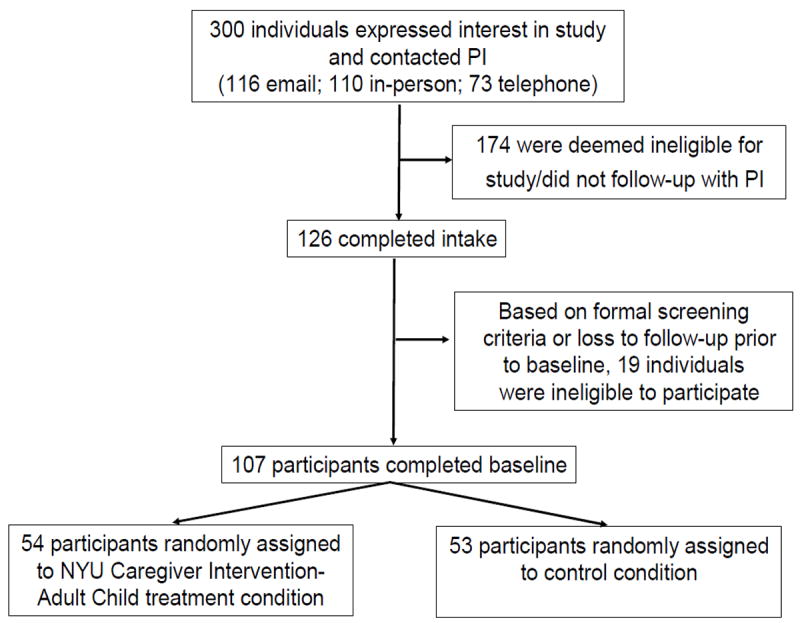
Participant recruitment process, NYU Caregiver Intervention-Adult Child
A rater initially blinded to random group assignment administered questionnaires to participating caregivers at baseline and every four months during the first year of participation and every six months thereafter for a minimum of two years. Follow-up questionnaires were administered in person or via telephone or mail if participants could not appear in person. Participation continued until the study ended, the caregiver died, the caregiver refused to participate, or two years after the death of the parent with ADRD. The maximum time of participation was 3.79 years after enrollment. Participants who completed mail questionnaires sometimes returned them later than the scheduled follow-up interval, accounting for the 3.79 year maximum time to follow-up.
Intervention
The NYUCI-AC consisted of three components as did the original NYUCI: individual and family counseling, support group participation, and ad hoc counseling. Adult child caregivers were asked to participate in six individual and family sessions with one of two trained study counselors (both Master’s-level psychotherapists) during the initial four-month period after enrollment. In the original NYUCI (designed for spouse or partner caregivers) there was one individual session, followed by four sessions with the caregiver and other family members, and then a second individual session. However, many adult children who enrolled in the NYUCI-AC were resistant to including other family members. Therefore, the individual and family counseling protocol for the NYUCI-AC was modified to begin with two individual sessions with the adult child caregiver, followed by three with the adult child caregiver and one or more family members, and a concluding session with the adult child caregiver alone. While this apportioning of individual and family counseling sessions deviated from the original NYUCI, the clinical content remained similar: the education and psychosocial support provided by the NYUCI-AC was individualized to meet the needs of each caregiver, based on the baseline questionnaire as well as problems and goals identified in the initial individual counseling sessions. NYUCI-AC caregivers were also encouraged to build and utilize social support from family and friends, improve interactions with other family members, and communicate their needs to family members, care providers, or others involved in the care and treatment of the person with ADRD.
Caregivers in the treatment condition were referred to local support groups (provided by local Area Agencies on Aging and the Minnesota-North Dakota Alzheimer’s Association regional office) after the first follow-up assessment. The NYUCI-AC counselors also moderated an adult child-specific support group for treatment group participants (as few adult child-only support groups were available). NYUCI-AC counselors provided ad hoc counseling in-person, over the phone, or via email throughout the project and offered ongoing guidance and support to address emerging crises or needs.
Adult child caregivers in the usual care control group received “check-in” calls from NYUCI-AC counselors every four months. Controls also were sent a bi-annual project newsletter. Counselors were instructed to offer brief consultation and referral to appropriate resources in the community if a critical need arose for a control group participant.
Multiple strategies were utilized to assess treatment fidelity.26 The book Counseling the Alzheimer’s Caregiver, authored by the NYUCI investigators and counselors, was primarily used as a training resource for NYUCI-AC counselors and to ensure that implementation of the NYUCI-AC was consistent in principle with the original NYUCI.27 Regular meetings between the counselors and the first author also took place to review counselors’ performance and challenging clinical issues as they emerged. Records of the frequency, duration, and types of contact between counselors and caregivers/family members were collected and maintained using modified forms initially deployed in the NYUCI. Field notes and documentation collected by counselors were examined to assess treatment delivery and receipt. Caregivers in the NYUCI-AC treatment condition also completed surveys consisting of close-ended and open-ended items that assessed their satisfaction with and perceptions of the NYUCI-AC utility for each of the intervention’s components (individual/family counseling, support groups, and ad hoc counseling) at each follow-up. NYUCI-AC counselors reviewed this feedback to ensure the delivery and content of their consultation was effectively received by adult child caregivers.
Measures
Context of care
Information about caregiver and care recipient sociodemographic and background characteristics was collected during the baseline assessment (see Table 1). Care recipient dispositional status (whether residential care placement or care recipient death occurred) was determined at each follow-up assessment.
Table 1.
Baseline Descriptive Information and Bivariate Comparisons, NYU Caregiver Intervention-Adult Child Treatment and Control Groups (N = 107).
| Variable | Total (N = 107) | Control (n = 53) | Treatment (n = 54) |
|---|---|---|---|
| Context of Care | |||
| Caregiver age (in years)a (df = 104) | M = 50.46 | M = 49.68 | M = 51.23 |
| SD = 8.24 | SD = 9.36 | SD = 6.95 | |
| Caregiver is female*,b | 94.3% | 100% | 88.7% |
| Caregiver is Caucasianb | 94.4% | 94.3% | 94.4% |
| Caregiver household annual incomec,d | M = 6.95 | M = 6.90 | M = 7.00 |
| SD = 1.33 | SD = 1.30 | SD = 1.36 | |
| Caregiver completed high school or more | 100% | 100% | 100% |
| Caregiver is employed | 100% | 100% | 100% |
| Caregiver is marriede (df = 1) | 71.0% | 69.8% | 72.2% |
| Caregiver number of childrenc | M = 1.68 | M = 1.90 | M = 1.46 |
| SD = 1.57 | SD = 1.77 | SD = 1.33 | |
| Care recipient number of childrenc | M = 3.57 | M = 3.54 | M = 3.59 |
| SD = 1.93 | SD = 1.92 | SD = 1.97 | |
| Care recipient lives alonee (df = 1) | 17.0% | 13.5% | 20.4% |
| Care recipient is on Medicaide (df = 1) | 25.5% | 26.9% | 24.1% |
| Dementia Severity | |||
| Global Deterioration Scale scorea (df = 98) | M = 4.89 | M = 4.97 | M = 4.80 |
| SD = 0.90 | SD = 0.87 | SD = 0.92 | |
| Revised Memory Problem Checklist-Frequencya (df = 105) | M = 38.64 | M = 38.38 | M = 38.89 |
| SD = 12.00 | SD = 12.01 | SD = 12.09 | |
| Caregiver Stress | |||
| Role overloada (df = 105) | M = 7.39 | M = 7.52 | M = 7.26 |
| SD = 2.06 | SD = 2.04 | SD = 2.09 | |
| Role captivitya (df = 105 | M = 7.60 | M = 7.35 | M = 7.85 |
| SD = 2.39 | SD = 2.50 | SD = 2.28 | |
| Revised Memory Problem Checklist-Reactiona (df = 105) | M = 26.17 | M = 25.07 | M = 27.25 |
| SD = 14.17 | SD = 14.00 | SD = 14.38 | |
| Support Resources | |||
| Stokes Social Network: Number of close friends*,c | M = 3.96 | M = 4.65 | M = 3.28 |
| SD = 3.17 | SD = 3.59 | SD = 2.54 | |
| Stokes Social Network: Number of close relativesa (df = 104) | M = 4.11 | M = 4.25 | M = 3.98 |
| SD = 3.29 | SD = 3.11 | SD = 3.48 | |
| Overall satisfaction with social network**,a,f (df = 105) | M = 2.54 | M = 2.12 | M = 2.94 |
| SD = 1.47 | SD = 1.27 | SD = 1.55 | |
| Satisfaction with emotional support*,c,f | M = 2.39 | M = 2.14 | M = 2.63 |
| SD = 1.44 | SD = 1.39 | SD = 2.39 | |
| Satisfaction with assistance a,f (df = 105) | M = 3.40 | M = 3.22 | M = 3.57 |
| SD = 1.60 | SD = 1.50 | SD = 1.69 | |
| Number of community-based and psychosocial services useda | M = 0.96 | M = 1.09 | M = 0.83 |
| SD = 1.19 | SD = 1.26 | SD = 1.11 | |
| Depressive Symptoms | |||
| Total Geriatric Depression Scalec | M = 5.79 | M = 5.48 | M = 6.11 |
| SD = 4.99 | SD = 4.59 | SD = 5.39 | |
| Geriatric Depression Scale: Dysphoriac | M = 1.21 | M = 1.26 | M = 1.15 |
| SD = 1.54 | SD = 1.43 | SD = 1.65 | |
| Geriatric Depression Scale: Withdrawal-Apathy-Vigora (df = 104) | M = 1.96 | M = 1.84 | M = 2.08 |
| SD = 1.58 | SD = 1.47 | SD = 1.68 | |
| Geriatric Depression Scale: Worryc | M = 0.72 | M = 0.71 | M = 0.73 |
| SD = 0.80 | SD = 0.85 | SD = 0.75 | |
| Geriatric Depression Scale: Cognitive Impairmentc | M = 0.86 | M = 0.74 | M = 0.97 |
| SD = 0.85 | SD = 0.73 | SD = 0.95 | |
| Quality of Life: Cantril Ladderc | M = 75.71 | M = 76.77 | M = 74.63 |
| SD = 13.95 | SD = 10.62 | SD = 16.71 |
NOTE: M = mean; SD = standard deviation;
p < .05;
p < .01;
p < .001;
df = degrees of freedom;
Independent samples T-Test;
Fisher’s exact test;
Mann Whitney U test;
1 = None, 2 = Under $5,000, 3 = $5,000 to $9,999, 4 = $10,000 to $14,999, 5 = $15,000 to $24,999, 6 = $25,000 to $49,999, 7 = $50,000 to $74,999, 8 = $75,000 or more;
Pearson chi-square test;
1 = Very satisfied, 2 = Moderately satisfied, 3 = Slightly satisfied, 4 = Slightly dissatisfied, 5 = Moderately dissatisfied, 6 = Very dissatisfied
Dementia severity
The global severity of dementia of the person with ADRD was categorized with the Global Deterioration Scale,28 a semi-structured rating of global functional status indicated by the caregiver in discussion with the rater. The frequency of care recipient behavior problems was measured with the Revised Memory and Behavior Problems Checklist (RMBPC; α = .80)29 which consists of a list of 24 problem behaviors common among persons with dementia. The number of specific care tasks provided to the care recipient during a typical week was summed (e.g., activity of daily living and instrumental activity of daily living tasks).30 A single-item, caregiver-rated measure of the person with ADRD’s health was also administered.31
Measures of subjective stress
Three indices of subjective stress were utilized and summed. A four-item scale assessed the involuntary aspects of the caregiving role (i.e., role captivity, α =.81),20 a three-item scale measured caregivers’ feelings of emotional and physical fatigue (i.e., role overload; α = .79),20 and adult child caregivers’ stress appraisals of problem behaviors were assessed via the overall reaction measure of the RMPBC (α = .87).
Resources
The number of close friends and relatives of the caregiver was measured with The Stokes Social Network List (α = .92).32 In addition, three items determined the caregiver’s satisfaction with her/his overall social support, emotional social support, and the assistance offered by her/his social network. Adult child caregivers also indicated the number of community-based and psychosocial services they were currently using (e.g., adult day services, in-home health, personal care, support groups, and other psychosocial services).
Depressive symptoms
The Geriatric Depression Scale (GDS; α=.97),33 a 30-item yes/no measure specifically designed for the aging population, was used to assess depressive symptoms of caregivers as this measure was used in the original NYUCI. In addition to the total summed score, we utilized several previously identified and tested sub-scales of the GDS: Dysphoric Mood (nine items, α =.93), Withdrawal–Apathy–Vigor (vigor refers to lack of vigor on this scale; six items, α =.84), Hopelessness (nine items, α =.70), and Cognitive Symptoms (three items, α =.73).34
Quality of life
Adult child caregivers were asked to rate their overall quality of life at the present time on a Cantril ladder.35 Quality of life ratings ranged from 0 (the worst quality of life imaginable) to 100 (the highest quality of life imaginable). The Cantril ladder is among the most extensively tested, validated, and utilized measures of general quality of life in populations across life-span and disease contexts.36
Analysis
In order to ascertain whether the NYUCI-AC treatment and control groups significantly differed at baseline, a series of bivariate comparisons (chi-squares, independent sample T-tests) were conducted. In instances where cell sizes had a value of less than 5 for nominal/categorical variables, Fisher’s exact tests were used. For non-normally distributed ordinal or continuous measures, Mann-Whitney U tests were conducted (see Table 1). Any baseline measures that significantly varied (p < .05) between groups were then included as covariates in all adjusted longitudinal models testing the efficacy of the NYUCI-AC on caregivers’ depressive symptoms and QoL.
Multi-level growth curve models were used to determine whether the NYUCI-AC influenced change in depressive symptoms or QoL over the course of the intervention.37,38 The first stage of the growth curve model, the within-subjects Level-1 model, determined whether linear or curvilinear parameterizations of depressive symptoms and quality of life provided the best fit to the longitudinal data available.39 Cubic/curvilinear models demonstrated appropriate empirical fit to the observed data for quality of life, total Geriatric Depression Scale score, and subscales of the Geriatric Depression Scale. The cubic Level 1 growth model is as follows:37, p. 77; 39, p. 46
Yij is caregiver i’s value of quality of life or a depression symptom score on occasion j. π0i is caregiver i’s true initial status, or the value of a quality of life or a depression symptom score when Timeij = 0. π1i represents caregiver i’s true rate of change/linear change throughout the study period; π2i represents caregiver i’s quadratic change; and π3i represents cubic change on a quality of life or depression symptom score throughout the period under study. εij reflects the portion of caregiver i’s quality of life or depression symptom score that is unexplained on occasion j.
The between subjects, or Level 2, models determined whether NYUCI-AC group membership (intervention or control) significantly influenced linear, quadratic, or cubic rate of change in depression symptom and quality of life score throughout the period under study. The cubic Level 2 growth curve model is as follows:
This equation form is the composite specification of the multi-level model of change favored by SPSS and other statistical programs.37 Within the Level 2 sub-models, γ00, γ10, γ20, and γ30 are the initial status, linear rate of change, quadratic change, and cubic change for caregivers assigned to the NYUCI-AC control group, respectively. γ01, γ11, γ21, and γ31 reflect the effects of assignment to the NYUCI-AC treatment condition initial status, linear rate of change, quadratic, and cubic change on quality of life or depressive symptom scale scores, respectively. ζ0i, ζ1i, ζ2i, and ζ3i represent the Level 2 residuals, respectively, and are the portions of initial status and linear, quadratic, or cubic rate of change that are unexplained in the Level-2 growth curve models. As with standard regression models, the Level-2 sub-models can incorporate other covariates as part of the larger composite model.37, pp. 79-81, 223
A strength of the NYUCI-AC assessment protocol was that QoL and depressive symptom data were collected on caregivers after a relative’s admission to a residential care setting or a relative’s death. This meant that right censoring in the follow-ups beyond two years after baseline was not due to the relative’s disposition but instead due to time of enrollment, as caregivers who were enrolled in the later stages of the evaluation could only be followed for a maximum of two years. Adult child caregivers had 6.21 data collection points (completed assessments) available, on average (SD = 1.81). For more details on residential care placement and right censoring in the NYUCI-AC data, see Table 2 and Gaugler, Reese, and Mittelman (2013).22
Table 2.
Care Recipient Residential Care Placement and Death, NYU Caregiver Intervention-Adult Child Treatment and Control Groups (N = 107).
| Variablea | Total (N = 107) | Control (n = 53) | Treatment (n = 54) |
|---|---|---|---|
| Care Recipient Diedb (df = 1) | 35.5% | 30.2% | 40.7% |
| Care Recipient Entered Residential Care**, b (df = 1) | 51.4% | 66.0% | 37.0% |
NOTE:
p < .05;
p < .01;
p < .001;
df = degrees of freedom;
Based on last available assessment within each panel;
Pearson chi-square test; Wave 1 N = 107, Wave 2 N = 102, Wave 3 N = 97, Wave 4 N = 95, Wave 5 N = 90, Wave 6 N = 81, Wave 7 N = 55, Wave 8 N = 38;
The primary reason that growth curve modeling was selected for the current analysis was the variability in number of data points and time between assessment intervals. Growth curve modeling is recommended as an analytic option in such circumstances. 37,38,40 Time-varying covariates of residential care placement and care recipient death were entered into the Level-2 models to provide additional control for the effects of these transitions. IBM SPSS version 21 was used to estimate all growth curve models.39,41
Results
Process Data
Adult child caregivers in the treatment group who received the NYUCI-AC completed their six individual and family counseling sessions almost a year after baseline assessments, on average (M = 11.10; SD = 8.95). Participants in the NYUCI-AC completed a mean of 5.19 (SD = 1.54) counseling sessions; 3.96 of these were individual sessions (SD = 1.86) and 1.22 were family sessions (SD = 1.56). Twenty-five participants (46.3%) did not utilize family sessions and relied only on individual counseling sessions. One-hundred and forty-five ad hoc sessions (M = 2.65 ad hoc sessions, SD = 3.22; M = 59.21 minutes each, SD = 36.25) were completed by the 54 treatment group participants. Nineteen (35.2%) treatment group participants utilized the counselor-provided support groups an average of 7.44 times each (SD = 9.80). A large number of emails were exchanged between NYUCI-AC treatment group participants and study counselors (N = 1,678); 25% involved counseling-related issues. Other emails largely addressed scheduling or reminders (for additional process data, see Gaugler et al., 2013).22
Study counselors initiated a total of 704 contacts with caregivers in the control group; 566 of these contacts were phone calls, 137 were email exchanges, and 1 was an in-person session. Among these contacts, 142 were administrative, 460 were quarterly follow-up contacts (i.e., “check-ins”), and 102 were for other purposes. The average length of each phone call that resulted in contact was 21.80 minutes (SD = 17.27). In addition to administrative concerns, 160 contacts included emotional support, 12 dealt with managing the care recipient’s behavior, 48 included referral to other services, 12 addressed physical illness concerns on the part of the caregiver, and 24 involved residential long-term care placement issues.
Growth Curve Models: Test of Hypotheses
As suggested by Singer and Willet and others, 37,39 prior to fitting growth curve models it is important to first fit and compare the model fit between an “unconditional means model” (where variation in outcome is partitioned across people without regard to time) and an “unconditional growth model” (where outcome variation is partitioned across people and time; or, the Level 1 model). Comparing the difference between the -2Log-Likelihood (-2LL) scores of the unconditional means model and the unconditional growth model of each outcome provided a simultaneous, joint test of the time (linear), quadratic (Time2), and cubic (Time3) growth parameters for each outcome variable (the GDS and its subscales and Cantril Quality of Life). As the unconditional means model is obtained from implementing five constraints (see Singer and Willett37, p. 119, p. 223), the differences in -2LL scores were compared to a χ2 distribution on 5 degrees of freedom. Table 3 presents the results of these comparisons. For all outcomes, their unconditional growth models offered a better fit than their respective unconditional means model, allowing for a rejection of the null hypothesis that the time parameters are simultaneously equal to 0.37, p. 119 Table 3 also demonstrates that, with the exception of the GDS-Hopelessness subscale (where only linear change was significant), linear, quadratic, and cubic change parameters were statistically significant (p < .05) for quality of life, the GDS, and other GDS subscales across the period of study.
Table 3.
3-Year Unconditional Means and Growth Curve Models: Geriatric Depressive Symptoms and Cantril Quality of Life (Joint Parameter Test of Overall Time Effect; N = 107).
| Unconditional Means Model | Unconditional Growth Curve Model | |||||||||
|---|---|---|---|---|---|---|---|---|---|---|
|
| ||||||||||
| Parameter | -2LL | df† | B | SE | F | -2LL | df† | B | SE | F |
| GDS | 3646.71 | 3593.56 | ||||||||
| Intercept | 109.40 | 6.95*** | .46 | 233.19 | 139.06 | 6.02*** | .51 | 140.25 | ||
| Time | 531.80 | 3.15*** | .81 | 15.25 | ||||||
| Time squared | 520.07 | -1.87** | .63 | 8.90 | ||||||
| Time cubed | 535.88 | .29* | .13 | 4.79 | ||||||
| -2LL Difference (df = 5) = 53.15*** | ||||||||||
| GDS-Dysphoria | 2281.20 | 2250.64 | ||||||||
| Intercept | 109.91 | 1.55*** | .14 | 118.14 | 151.68 | 1.27*** | .17 | 55.50 | ||
| Time | 538.57 | 1.12*** | .30 | 13.66 | ||||||
| Time squared | 542.66 | -.72** | .24 | 9.28 | ||||||
| Time cubed | 556.56 | .12* | .05 | 5.49 | ||||||
| -2LL Difference (df = 5) = 30.56*** | ||||||||||
| GDS-WAV | 2115.51 | 2080.10 | ||||||||
| Intercept | 107.28 | 2.24*** | .13 | 285.85 | 144.46 | 2.00*** | .15 | 171.76 | ||
| Time | 533.62 | .90** | .26 | 11.67 | ||||||
| Time squared | 527.93 | -.64** | .21 | 9.64 | ||||||
| Time cubed | 543.09 | .12** | .04 | 7.90 | ||||||
| -2LL Difference (df = 5) = 35.41*** | ||||||||||
| GDS-Hopelessness | 1092.70 | 1080.08 | ||||||||
| Intercept | 110.85 | .43*** | .05 | 62.53 | 164.59 | .35*** | .07 | 27.08 | ||
| Time | 563.60 | .28* | .13 | 4.62 | ||||||
| Time squared | 562.99 | -.15 | .10 | 2.35 | ||||||
| Time cubed | 534.82 | .02 | .02 | .91 | ||||||
| -2LL Difference (df = 5) = 12.62* | ||||||||||
| GDS-CS | 1447.96 | 1428.96 | ||||||||
| Intercept | 110.66 | 1.03*** | .08 | 183.46 | 161.30 | .88*** | .09 | 103.79 | ||
| Time | 550.51 | .50** | .17 | 8.89 | ||||||
| Time squared | 557.59 | -.31* | .13 | 5.87 | ||||||
| Time cubed | 560.75 | .06* | .03 | 4.26 | ||||||
| -2LL Difference (df = 5) = 19.00*** | ||||||||||
| Cantril Quality of Life | 5224.56 | 5193.64 | ||||||||
| Intercept | 107.78 | 74.66*** | 1.30 | 3277.83 | 149.00 | 75.96*** | 1.60 | 27.08 | ||
| Time | 526.76 | -8.04** | 2.94 | 4.62 | ||||||
| Time squared | 523.78 | 6.02** | 2.28 | 2.35 | ||||||
| Time cubed | 541.16 | -1.05* | .48 | .91 | ||||||
| -2LL Difference (df = 5) = 30.92*** | ||||||||||
NOTE: -2LL = -2 Log Likelihood;
p < .05;
p < .01;
p < .001;
df = degrees of freedom; df† = numerator degrees of freedom; GDS = Geriatric Depression Scale; WAV = Withdrawal-Apathy-Vigor subscale; CS = Cognitive Symptoms subscale
A similar model comparison was conducted to examine whether the addition of the NYUCI-AC treatment variable and its interactions with the linear, quadratic, and cubic parameters offered a significantly improved model fit when compared to the unconditional growth curve models. As four independent constraints are involved when comparing the unconditional growth curve model to a model that includes the NYUCI treatment variable and the various time*treatment interactions, the differences in -2LL statistics were compared to a χ2 distribution on 4 degrees of freedom. Table 4 presents the results of these comparisons; growth curve models that include the NYUCI-AC treatment variable and time*treatment interactions did not provide a statistically significant improved fit when compared to unconditional growth curve models, although the fit for Cantril quality of life approached significance (p<.10). This was somewhat surprising for two of the outcomes, as the NYUCI-AC did exert significant time by treatment effects on the linear, quadratic, and cubic parameters of the GDS-Withdrawal, Apathy, and Vigor subscale. In addition, the NYUCI-AC treatment*time interactions were significantly associated with linear and quadratic change in quality of life (see Table 4).
Table 4.
3-Year Individual Growth Curve Models: Geriatric Depressive Symptoms and Cantril Quality of Life, Joint Parameter Tests of Time by Treatment Effects (N = 107).
| Parameter | -2LL | df† | B | SE | F |
|---|---|---|---|---|---|
| GDS | 3590.18 | ||||
| Intercept | 138.93 | 6.01*** | .51 | 141.02 | |
| Time | 529.48 | 3.24*** | .81 | 16.21 | |
| Time squared | 516.21 | -1.96** | .63 | 9.83 | |
| Time cubed | 532.36 | .31* | .13 | 5.56 | |
| Treatmenta | 138.93 | .07 | .51 | .02 | |
| Time*treatment | 529.48 | 1.21 | .81 | 2.24 | |
| Time squared*treatment | 516.21 | -1.07 | .63 | 2.92 | |
| Time cubed*treatment | 532.36 | .23 | .13 | 3.07 | |
| -2LL Difference with Unconditional Growth Curve Model (seeTable 3; df = 4) = 3.38 | |||||
| GDS-Dysphoria | 2248.26 | ||||
| Intercept | 151.45 | 1.26*** | .17 | 55.49 | |
| Time | 535.44 | 1.15*** | .30 | 14.13 | |
| Time squared | 538.41 | -.74** | .24 | 9.74 | |
| Time cubed | 553.95 | .12* | .05 | 5.87 | |
| Treatmenta | 151.45 | -.15 | .17 | .73 | |
| Time*treatment | 535.44 | .45 | .30 | 2.21 | |
| Time squared*treatment | 538.41 | -.31 | .24 | 1.71 | |
| Time cubed*treatment | 553.95 | .06 | .05 | 1.41 | |
| -2LL Difference with Unconditional Growth Curve Model (see Table 3; df = 4) = 2.38 | |||||
| GDS-WAV | 2073.45 | ||||
| Intercept | 144.39 | 2.00*** | .15 | 173.74 | |
| Time | 530.51 | .94*** | .26 | 12.74 | |
| Time squared | 523.48 | -.67** | .21 | 10.82 | |
| Time cubed | 539.47 | .13** | .04 | 9.05 | |
| Treatmenta | 144.39 | .03 | .15 | .03 | |
| Time*treatment | 530.51 | .57* | .26 | 4.74 | |
| Time squared*treatment | 523.48 | -.48* | .21 | 5.49 | |
| Time cubed*treatment | 539.47 | .10* | .04 | 4.92 | |
| -2LL Difference with Unconditional Growth Curve Model (see Table 3; df = 4) = 6.65 | |||||
| GDS-Hopelessness | 1079.86 | ||||
| Intercept | 164.50 | .34*** | .07 | 27.03 | |
| Time | 559.80 | .28* | .13 | 4.73 | |
| Time squared | 564.28 | -.16 | .10 | 2.45 | |
| Time cubed | 546.62 | .02 | .02 | .99 | |
| Treatmenta | 164.50 | .01 | .07 | .01 | |
| Time*treatment | 559.80 | .04 | .13 | .11 | |
| Time squared*treatment | 564.28 | -.04 | .11 | .17 | |
| Time cubed*treatment | 546.62 | .01 | .02 | .67 | |
| -2LL Difference with Unconditional Growth Curve Model (see Table 3; df = 4) = 0.22 | |||||
| GDS-CS | 1425.94 | ||||
| Intercept | 162.50 | .88*** | .09 | 105.36 | |
| Time | 547.42 | .51** | .17 | 9.24 | |
| Time squared | 554.57 | -.32* | .13 | 6.21 | |
| Time cubed | 560.81 | .06* | .03 | 4.59 | |
| Treatmenta | 162.50 | .11 | .09 | 1.59 | |
| Time*treatment | 547.42 | .07 | .17 | .16 | |
| Time squared*treatment | 554.57 | -.09 | .13 | .43 | |
| Time cubed*treatment | 560.81 | .02 | .03 | .50 | |
| -2LL Difference with Unconditional Growth Curve Model (see Table 3; df = 4) = 3.02 | |||||
| Cantril Quality of Life | 5185.86 | ||||
| Intercept | 148.82 | 76.01*** | 1.59 | 2288.07 | |
| Time | 524.14 | -8.38** | 2.93 | 8.17 | |
| Time squared | 520.88 | 6.33** | 2.28 | 7.71 | |
| Time cubed | 539.10 | -1.12* | .48 | 5.43 | |
| Treatmenta | 148.82 | -.21 | 1.59 | .02 | |
| Time*treatment | 524.14 | -6.11* | 2.93 | 4.33 | |
| Time squared*treatment | 520.88 | 4.84* | 2.28 | 4.51 | |
| Time cubed*treatment | 539.10 | -.88 | .48 | 3.33 | |
| -2LL Difference with Unconditional Growth Curve Model (see Table 3; df = 4) = 7.78± |
NOTE: -2LL = -2 Log Likelihood;
p < .10;
p < .05;
p < .01;
p < .001;
df = degrees of freedom; †df = degrees of freedom (denominator); GDS = Geriatric Depression Scale; WAV = Withdrawal-Apathy-Vigor subscale; CS = Cognitive Symptoms subscale
Due to the high empirical association between satisfaction with emotional support and overall satisfaction with social network (r = .78) and in order to retain statistical power, only overall satisfaction was included as a baseline covariate in the final adjusted Level 2 models. As shown in Table 5 and Figure 2, the NYUCI-AC intervention had significant effects on the Withdrawal–Apathy–Vigor subscale of depressive symptoms over time for all of the growth curve parameters [df = 19, -2LL (Log Likelihood) = 2025.09; AIC (Akaike’s Information Criterion) = 2063.09; Schwarz’s Bayesian Criterion (BIC) = 2148.56)] following adjustment of baseline covariates and time-varying care recipient placement and death covariates. Specifically, caregivers in the NYUCI-AC treatment group reported significant increases in withdrawal–apathy–vigor initially, and this increase reversed by the midway point of the three-year study follow-up when scores on this scale improved. In the final follow-up intervals, the treatment group reported a greater increase in withdrawal–apathy–vigor than the control group; nevertheless, their scores remained lower in the latter intervals of the study. While two of three change parameters in total depressive symptoms were significant (see Table 5), growth curve parameters for other depression subscales were not significant. Table 5 and Figure 3 also show that following covariate adjustment, NYUCI-AC treatment assignment had significant effects on adult child caregivers’ quality of life over time across the linear, quadratic, and cubic growth curve parameters (df = 19, -2LL = 5139.62; AIC = 5177.62; BIC = 5262.89). Initially, adult child caregivers in the NYUCI treatment condition indicated decreases in quality of life. These changes reversed, however, so that by the later intervals of the evaluation adult child caregivers in the NYUCI-AC indicated significantly greater increases in quality of life when compared to usual care controls.
Table 5.
3-Year Adjusted Individual Growth Curve Models: Geriatric Depressive Symptoms and Cantril Quality of Life (N = 107).
| Parameter | GDS | GDS-Dysphoria | ||||||
|---|---|---|---|---|---|---|---|---|
|
| ||||||||
| df† | B | SE | F | df† | B | SE | F | |
| Intercept | 124.76 | 2.13 | 1.92 | 1.22 | 129.83 | .46 | .63 | .53 |
| Time | 529.10 | 3.00*** | .85 | 12.61 | 530.58 | .99** | .32 | 9.68 |
| Time squared | 513.92 | -1.83** | .68 | 7.23 | 524.65 | -.70** | .26 | 7.33 |
| Time cubed | 510.13 | .34* | .15 | 5.31 | 523.18 | .13* | .06 | 5.44 |
| Treatmenta | 145.49 | -.65 | .47 | 1.94 | 160.41 | -.38* | .16 | 5.75 |
| Time*treatment | 534.84 | 1.36 | .81 | 2.84 | 540.29 | .51 | .30 | 2.85 |
| Time squared*treatment | 526.66 | -1.25* | .63 | 3.90 | 545.22 | -.37 | .24 | 2.39 |
| Time cubed*treatment | 541.96 | .28* | .14 | 4.28 | 558.62 | .07 | .05 | 2.12 |
| Residential care placement | 577.67 | 1.23 | .80 | 2.37 | 589.88 | .65* | .30 | 4.72 |
| Care recipient death | 575.55 | 2.18 | 2.20 | 0.98 | 584.37 | .82 | .82 | 1.00 |
| Time*placement | 472.03 | -.83 | .49 | 2.93 | 422.88 | -.26 | .18 | 2.20 |
| Time*death | 544.93 | -1.47 | .97 | 2.30 | 522.48 | -.40 | .36 | 1.29 |
| Caregiver gender | 118.81 | -.88 | 1.72 | .26 | 121.44 | -.63 | .56 | 1.25 |
| Number of close friends | 110.85 | .05 | .14 | .13 | 111.24 | .02 | .05 | .12 |
| Satisfaction with social network | 110.99 | 1.79*** | .30 | 35.98 | 112.23 | .53*** | .10 | 30.11 |
| Intercept | 125.06 | .62 | .55 | 1.25 | 134.29 | .17 | .25 | .46 |
| Time | 531.32 | .93** | .28 | 11.33 | 552.34 | .25 | .16 | 3.36 |
| Time squared | 521.08 | -.68** | .22 | 9.35 | 554.37 | -.12 | .13 | 1.18 |
| Time cubed | 518.10 | .15** | .05 | 9.83 | 554.760 | .02 | .02 | .53 |
| Treatmenta | 154.80 | -.19 | .14 | 2.02 | 174.89 | -.08 | .06 | 1.68 |
| Time*treatment | 537.45 | .60* | .26 | 5.22 | 563.53 | .05 | .13 | .16 |
| Time squared*treatment | 537.23 | -.52* | .21 | 6.34 | 566.93 | -.05 | .10 | .21 |
| Time cubed*treatment | 550.96 | .11* | .04 | 6.10 | 545.45 | .01 | .02 | .26 |
| Residential care placement | 589.18 | .24 | .26 | .84 | 604.31 | .11 | .13 | .78 |
| Care recipient death | 581.28 | .74 | .71 | 1.07 | 587.79 | -.25 | .34 | .55 |
| Time*placement | 439.28 | -.20 | .16 | 1.63 | 364.27 | -.07 | .07 | .98 |
| Time*death | 535.01 | -.57 | .31 | 3.39 | 498.72 | -.01 | .15 | .01 |
| Caregiver gender | 117.45 | .14 | .49 | .08 | 124.36 | -.32 | .22 | 2.10 |
| Number of close friends | 108.00 | -.03 | .04 | .43 | 111.73 | .01 | .02 | .11 |
| Satisfaction with social network | 108.58 | .53*** | .09 | 39.88 | 114.62 | .18*** | .04 | 23.66 |
| Intercept | 126.88 | .55 | .36 | 2.37 | 127.95 | 83.69*** | 5.73 | 213.69 |
| Time | 543.36 | .55** | .18 | 9.79 | 552.57 | -6.77* | 3.06 | 4.90 |
| Time squared | 541.75 | -.39** | .14 | 7.48 | 513.41 | 4.33 | 2.46 | 3.10 |
| Time cubed | 540.92 | .08** | .03 | 7.32 | 511.54 | -.87 | .54 | 2.59 |
| Treatmenta | 158.39 | .05 | .09 | .35 | 157.52 | 1.49 | 1.99 | 1.80 |
| Time*treatment | 551.73 | .09 | .17 | .30 | 531.10 | -6.42* | 2.91 | 4.88 |
| Time squared*treatment | 559.79 | -.12 | .13 | .87 | 532.46 | 5.14* | 2.28 | 5.09 |
| Time cubed*treatment | 559.61 | .03 | .03 | 1.14 | 546.83 | -.95* | .48 | 3.89 |
| Residential care placement | 591.63 | .09 | .16 | .30 | 585.13 | -4.33 | 2.86 | 2.30 |
| Care recipient death | 583.07 | .94* | .45 | 4.50 | 575.36 | 6.90 | 7.83 | .78 |
| Time*placement | 381.61 | -.11 | .09 | 1.36 | 436.11 | 3.72* | 1.70 | 4.77 |
| Time*death | 511.92 | -.45* | .19 | 5.52 | 519.48 | .94 | 3.43 | .08 |
| Caregiver gender | 119.68 | -.17 | .32 | .30 | 118.28 | 4.61 | 5.09 | .82 |
| Number of close friends | 110.44 | .02 | .03 | .75 | 107.08 | .04 | .40 | .01 |
| Satisfaction with social network | 110.99 | .16** | .06 | 8.20 | 108.88 | -4.83*** | .87 | 30.82 |
NOTE:
p < .05;
p < .01;
p < .001;
†df = degrees of freedom (denominator); GDS = Geriatric Depression Scale; WAV = Withdrawal-Apathy-Vigor subscale; CS = Cognitive Symptoms subscale;
New York University Caregiver Intervention-Adult Child treatment vs. control assignment: treatment = 1, control = -1
Figure 2.
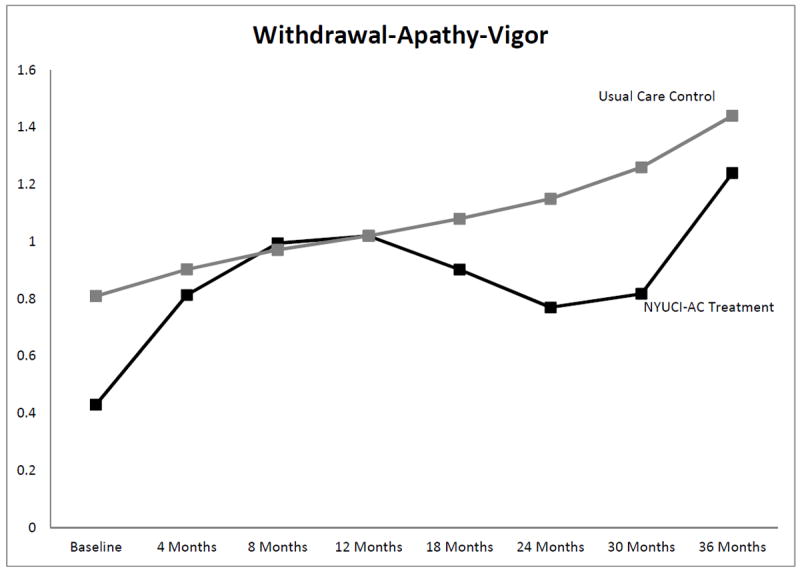
Significant growth curve trajectories: Withdrawal-Apathy-Vigor subscale of the Geriatric Depression Scale
Figure 3.
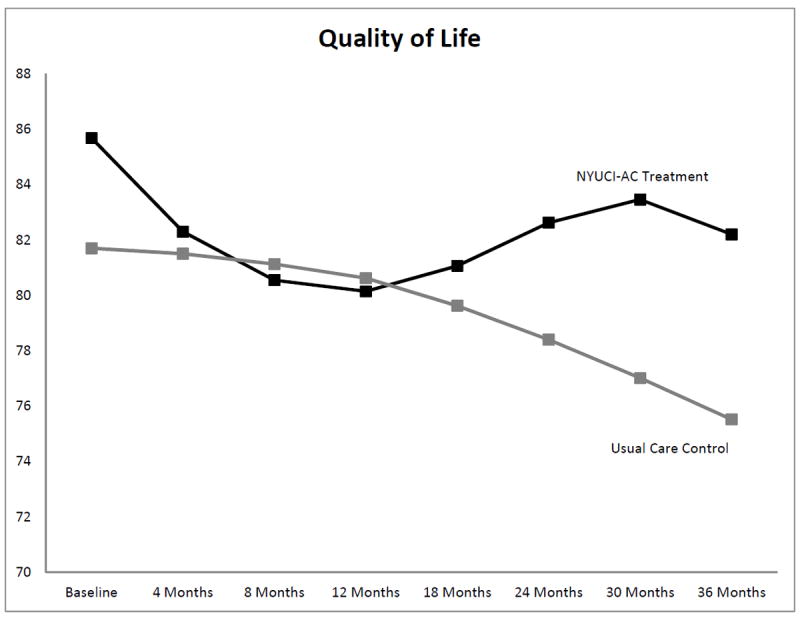
Significant growth curve trajectories: Cantril Quality of Life Ladder
Discussion
The positive effects of the NYUCI-AC on isolation, apathy and withdrawal as well as quality of life are important, as these domains are linked to key health outcomes and service utilization for ADRD caregivers.4 The sole focus of this study on adult child caregivers also lends support to the potential value of the broader application, beyond spouse caregivers, of community translations of the NYUCI caregiver support model across delivery contexts and kin relationships.11 Our findings indicate that a comprehensive, multi-component intervention that is: a) provided over time to mirror the long-term involvement of family caregivers over the course of a relative’s ADRD; b) flexible in its delivery of individual and family counseling; and c) focused on improving social support from family and friends, problem-solving and psycho-education can significantly reduce apathy and social isolation and improve quality of life of adult child caregivers of persons with dementia.
A content review of the counselor notes suggested the efficacy of the individualized clinical focus and processes implemented in all components of the NYUCI-AC. As with the original NYUCI, a main emphasis of the NYUCI-AC is on building social support. Even though many adult child caregivers did not wish to include other family members per the protocol, the counselors encouraged them to identify and develop strategies to work towards improved, quality social interactions and support as well as adopt new patterns of communication with others involved in the caregiving situation (the social support mechanism is partially evident in the strength of the baseline covariate, satisfaction with social support, and its effects on depressive symptoms and quality of life; see Table 5).42 Prioritization of tasks, goal-setting, and psycho-education related to dementia and healthcare related issues were also key clinical elements of the NYUCI-AC counseling sessions.
The findings are particularly intriguing in light of our prior analyses of the NYUCI-AC and its effects on adult child caregivers’ subjective stress.23 As noted above, the NYUCI and NYUCI-AC are conceptually rooted in the stress process model of ADRD caregiving20 in which stress is posited to proliferate from the occurrence of care demands to the emotional appraisal of these demands on the part of caregivers (subjective stress), which then negatively influences global outcomes such as quality of life and mental health. In our previous work we found that the NYUCI-AC influenced subjective stress in a positive fashion in the first 18 months of participation in the intervention, and in the current study these benefits may have proliferated to improve the more global outcome domains of mental health and quality of life in the later months of participation. For example, the skills acquired in the individual, family, and ad hoc counseling sessions along with support group attendance could have enabled caregivers to better prevent and manage disruptive behaviors initially, and addressing these more immediate concerns may have provided caregivers with the time and focus to reduce social withdrawal and experience a better quality of life overall.
The findings and implications of this study are tempered by several limitations. Although the growth curve analysis and collection of data post-institutionalization and bereavement help to offset missing data in later intervals to some extent, the fact that many caregivers were not followed after 2 years due to time of enrollment contributed to fewer observable data in the latter measurement intervals. This may have influenced the estimation of the 3-year growth curve models. The small sample limited statistical power as well as our ability to fully control for additional covariates (in particular time-varying ones). While the various time by treatment interactions appeared to influence linear, quadratic, and cubic change in quality of life and withdrawal-apathy-vigor depressive symptoms in statistically significant fashion, an overall test of the time by treatment interactions did not appear to result in significantly better model fit prior to the inclusion of baseline, placement, and care recipient death covariates (see Table 4). The sample, in keeping with the demographics of the region in which the study took place, was largely Caucasian and well-educated and thus not representative of the population as a whole. Similar to other caregiving samples, the majority of adult children enrolled were women. Future analyses of process data collected during the study will explicate the ways in which the differential use and delivery of the various NYUCI-AC components may have influenced key outcomes.
The evidence base of ADRD caregiver interventions has expanded considerably over the past decade, to the extent that many of these protocols are now in translation in healthcare systems and community agencies throughout the United States and beyond.11,43 However, a concern when considering the implementation of these protocols is that they are often positioned as “one size fits all” approaches, when in fact translating these interventions often requires modification to make them acceptable and feasible for heterogeneous ADRD caregivers. These issues became apparent when adapting the NYUCI for adult child caregivers; while the intervention demonstrated a beneficial effect on a clinically important set of depressive symptoms and quality of life, participating NYUCI-AC caregivers were often reluctant to complete six individual and family counseling sessions in the four-month timeframe as specified in the original protocol. Difficulty in completing the six counseling sessions within four months has also been noted in some of the translations of the NYUCI for spouse caregivers.11Additional scientific and clinical investigations are required to determine which subgroups of caregivers are most likely to complete, benefit from, or select comprehensive support protocols such as the NYUCI or NYUCI-AC.44
Due to the multiple life responsibilities and challenges faced by adult child caregivers on a day-to-day basis, the flexibility and individualized nature of a multi-component model such as the NYUCI and its variants appear critical to effectively addressing the complex needs of adult child caregivers. As the Alzheimer’s disease trajectory often extends from 3-20 years, comprehensive disease management should include support for family caregivers as exemplified by a model such as the NYUCI. Future translational science that determines how multi-component intervention models can be effectively implemented in diverse contexts and integrated with ongoing dementia care management efforts45 would further advance the knowledge base and potentially improve the standard of optimal treatment of dementia.
Acknowledgments
This research was supported by grant R01 AG01022066. This project was also supported by grants 1UL1RR033183 8 and UL1 TR000114-02 to the University of Minnesota Clinical and Translational Science Institute and P30 AG08051 to the NYU Alzheimer’s Disease Center. The authors thank David L. Roth, PhD, for his guidance.
Footnotes
The authors declare no conflict of interest.
Publisher's Disclaimer: This is a PDF file of an unedited manuscript that has been accepted for publication. As a service to our customers we are providing this early version of the manuscript. The manuscript will undergo copyediting, typesetting, and review of the resulting proof before it is published in its final citable form. Please note that during the production process errors may be discovered which could affect the content, and all legal disclaimers that apply to the journal pertain.
References
- 1.Schulz R, Sherwood PR. Physical and mental health effects of family caregiving. Am J Nurs. 2008;108(9 Suppl):23–7. doi: 10.1097/01.NAJ.0000336406.45248.4c;10.1097/01.NAJ.0000336406.45248.4c. quiz 27. [DOI] [PMC free article] [PubMed] [Google Scholar]
- 2.Joling KJ, van Marwijk HW, Veldhuijzen AE, et al. The two-year incidence of depression and anxiety disorders in spousal caregivers of persons with dementia: Who is at the greatest risk? Am J Geriatr Psychiatry. 2014 doi: 10.1016/j.jagp.2014.05.005. [DOI] [PubMed] [Google Scholar]
- 3.Brodaty H, Woodward M, Boundy K, Ames D, Balshaw R PRIME Study Group. Prevalence and predictors of burden in caregivers of people with dementia. Am J Geriatr Psychiatry. 2014;22(8):756–765. doi: 10.1016/j.jagp.2013.05.004. [DOI] [PubMed] [Google Scholar]
- 4.Alzheimer’s Association. 2014 Alzheimer’s disease facts and figures. Alzheimers Dement. 2014;10(2):e47–92. doi: 10.1016/j.jalz.2014.02.001. [DOI] [PubMed] [Google Scholar]
- 5.National Alliance for Caregiving. Schulz R, Cook T. Caergiving costs: Declining health in the Alzheimer’s caregiver as dementia increases in the care recipient. 2011 [Google Scholar]
- 6.White CL, Lauzon S, Yaffe MJ, Wood-Dauphinee S. Toward a model of quality of life for family caregivers of stroke survivors. Qual Life Res. 2004;13(3):625–638. doi: 10.1023/B:QURE.0000021312.37592.4f. [DOI] [PubMed] [Google Scholar]
- 7.Crellin NE, Orrell M, McDermott O, Charlesworth G. Self-efficacy and health-related quality of life in family carers of people with dementia: A systematic review. Aging Ment Health. 2014;18(8):954–969. doi: 10.1080/13607863.2014.915921. [DOI] [PMC free article] [PubMed] [Google Scholar]
- 8.Belle SH, Burgio L, Burns R, et al. Enhancing the quality of life of dementia caregivers from different ethnic or racial groups: A randomized, controlled trial. Ann Intern Med. 2006;145(10):727–38. doi: 10.7326/0003-4819-145-10-200611210-00005. [DOI] [PMC free article] [PubMed] [Google Scholar]
- 9.Czaja SJ, Loewenstein D, Schulz R, Nair SN, Perdomo D. A videophone psychosocial intervention for dementia caregivers. Am J Geriatr Psychiatry. 2013;21(11):1071–1081. doi: 10.1016/j.jagp.2013.02.019. [DOI] [PubMed] [Google Scholar]
- 10.Mittelman MS, Roth DL, Coon DW, Haley WE. Sustained benefit of supportive intervention for depressive symptoms in caregivers of patients with Alzheimer’s disease. Am J Psychiatry. 2004;161(5):850–6. doi: 10.1176/appi.ajp.161.5.850. [DOI] [PubMed] [Google Scholar]
- 11.Mittelman MS, Bartels SJ. Translating research into practice: Case study of a community-based dementia caregiver intervention. Health Aff. 2014;33(4):587–595. doi: 10.1377/hlthaff.2013.1334. [DOI] [PMC free article] [PubMed] [Google Scholar]
- 12.Savundranayagam MY. Receiving while giving: The differential roles of receiving help and satisfaction with help on caregiver rewards among spouses and adult-children. Int J Geriatr Psychiatry. 2014;29(1):41–48. doi: 10.1002/gps.3967;10.1002/gps.3967. [DOI] [PubMed] [Google Scholar]
- 13.Capistrant BD, Moon JR, Berkman LF, Glymour MM. Current and long-term spousal caregiving and onset of cardiovascular disease. J Epidemiol Community Health. 2012;66(10):951–956. doi: 10.1136/jech-2011-200040;10.1136/jech-2011-200040. [DOI] [PMC free article] [PubMed] [Google Scholar]
- 14.Adelman RD, Tmanova LL, Delgado D, Dion S, Lachs MS. Caregiver burden: A clinical review. JAMA. 2014;311(10):1052–1060. doi: 10.1001/jama.2014.304. [DOI] [PubMed] [Google Scholar]
- 15.Pinquart M, Sörensen S. Spouses, adult children, and children-in-law as caregivers of older adults: A meta-analytic comparison. Psychol Aging. 2011;26(1):1–14. doi: 10.1037/a0021863. [DOI] [PMC free article] [PubMed] [Google Scholar]
- 16.Li LW, Seltzer MM, Greenberg JS. Social support and depressive symptoms: Differential patterns in wife and daughter caregivers. J Gerontol B Psychol Sci Soc Sci. 1997;52(4):S200–11. doi: 10.1093/geronb/52b.4.s200. [DOI] [PubMed] [Google Scholar]
- 17.Reed C, Belger M, Dell’agnello G, et al. Caregiver burden in Alzheimer’s disease: Differential associations in adult-child and spousal caregivers in the GERAS observational study. Dement Geriatr Cogn Dis Extra. 2014;4(1):51–64. doi: 10.1159/000358234. [DOI] [PMC free article] [PubMed] [Google Scholar]
- 18.Andrén S, Elmståhl S. Effective psychosocial intervention for family caregivers lengthens time elapsed before nursing home placement of individuals with dementia: A five year follow-up study. Int Psychogeriatr. 2008;20(6):1177–92. doi: 10.1017/S1041610208007503. [DOI] [PubMed] [Google Scholar]
- 19.Gitlin LN, Winter L, Corcoran M, Dennis MP, Schinfeld S, Hauck WW. Effects of the home environmental skill-building program on the caregiver-care recipient dyad: 6-month outcomes from the Philadelphia REACH initiative. Gerontologist. 2003;43(4):532–546. doi: 10.1093/geront/43.4.532. [DOI] [PubMed] [Google Scholar]
- 20.Pearlin LI, Mullan JT, Semple SJ, Skaff MM. Caregiving and the stress process: An overview of concepts and their measures. Gerontologist. 1990;30:583–594. doi: 10.1093/geront/30.5.583. [DOI] [PubMed] [Google Scholar]
- 21.Brodaty H, Donkin M. Family caregivers of people with dementia. Dialogues Clin Neurosci. 2009;11(2):217–228. doi: 10.31887/DCNS.2009.11.2/hbrodaty. [DOI] [PMC free article] [PubMed] [Google Scholar]
- 22.Gaugler JE, Reese M, Mittelman MS. Effects of the NYU Caregiver Intervention-Adult Child on residential care placement. Gerontologist. 2013;53(6):985–997. doi: 10.1093/geront/gns193;10.1093/geront/gns193. [DOI] [PMC free article] [PubMed] [Google Scholar]
- 23.Gaugler JE, Reese M, Mittelman MS. Effects of the Minnesota adaptation of the NYU Caregiver Intervention on primary subjective stress of adult child caregivers of persons with dementia. Gerontologist. 2015 doi: 10.1093/geront/gnu125. [DOI] [PMC free article] [PubMed] [Google Scholar]
- 24.Mittelman MS, Haley WE, Clay OJ, Roth DL. Improving caregiver well-being delays nursing home placement of patients with Alzheimer’s disease. Neurology. 2006;67(9):1592–1599. doi: 10.1212/01.wnl.0000242727.81172.91. [DOI] [PubMed] [Google Scholar]
- 25.Mittelman MS, Roth DL, Haley WE, Zarit SH. Effects of a caregiver intervention on negative caregiver appraisals of behavior problems in patients with Alzheimer’s disease: Results of a randomized trial. J Gerontol B Psychol Sci Soc Sci. 2004;59(1):P27–34. doi: 10.1093/geronb/59.1.p27. [DOI] [PubMed] [Google Scholar]
- 26.Burgio L, Lichstein KL, Nichols L, et al. Judging outcomes in psychosocial interventions for dementia caregivers: The problem of treatment implementation. Gerontologist. 2001;41(4):481–489. doi: 10.1093/geront/41.4.481. [DOI] [PMC free article] [PubMed] [Google Scholar]
- 27.Mittelman MS, Epstein C, Pierzchala A. Counseling the alzheimer’s caregiver: A resource for health care professionals. Chicago: AMA Press; 2003. [Google Scholar]
- 28.Reisberg B, Ferris SH, de Leon MJ, Crook T. The Global Deterioration Scale for assessment of primary degenerative dementia. Am J Psychiatry. 1982;139:1136–1139. doi: 10.1176/ajp.139.9.1136. [DOI] [PubMed] [Google Scholar]
- 29.Teri L, Truax P, Logsdon R, Uomoto J, Zarit S, Vitaliano PP. Assessment of behavioral problems in dementia: The Revised Memory and Behavior Problems Checklist. Psychol Aging. 1992;7(4):622–631. doi: 10.1037//0882-7974.7.4.622. [DOI] [PubMed] [Google Scholar]
- 30.Rice DP, Fox PJ, Max W, Webber PA, Lindeman DA, Hauck WW, Segura E. The economic burden of Alzheimer’s disease care. Health Aff. 1993;12:164–176. doi: 10.1377/hlthaff.12.2.164. [DOI] [PubMed] [Google Scholar]
- 31.Duke University Center for the Study of Aging and Human Development. Multidimensional functional assessment: The OARS methodology. Durham, NC: Duke University Center for the Study of Aging and Human Development; 1978. [Google Scholar]
- 32.Stokes JP. Predicting satisfaction with social support from social network structure. Am J Community Psychol. 1983;11:141–152. [Google Scholar]
- 33.Yesavage JT, Rink T, Rose T, Aday M. Geriatric depression rating scale: Comparison with self-report and psychiatric rating scales. In: Crook T, Ferris S, Bartus R, editors. Assessment in geriatric psychopharmacology. New Canaan, CT: Mark Powley and Associates; 1983. pp. 153–167. [Google Scholar]
- 34.Adams KB, Matto HC, Sanders S. Confirmatory factor analysis of the Geriatric Depression Scale. Gerontologist. 2004;44(6):818–826. doi: 10.1093/geront/44.6.818. [DOI] [PubMed] [Google Scholar]
- 35.Cantril H. The pattern of human concerns. New Brunswick, NJ: Rutgers University; 1965. [Google Scholar]
- 36.OECD. OECD guidelines on measuring subjective well-being. Organisation for Economic Co-operation and Development; 2013. [DOI] [Google Scholar]
- 37.Singer JD, Willett JB. Applied longitudinal data analysis: Modeling change and event occurrence. New York, New York: Oxford University Press; 2003. [Google Scholar]
- 38.Raudenbush SW, Bryk AS. Hierarchical linear models: Application and data analysis methods. 2. Sage Publications; 2002. [Google Scholar]
- 39.Shek DT, Ma CM. Longitudinal data analyses using linear mixed models in SPSS: Concepts, procedures and illustrations. ScientificWorldJournal. 2011;11:42–76. doi: 10.1100/tsw.2011.2;10.1100/tsw.2011.2. [DOI] [PMC free article] [PubMed] [Google Scholar]
- 40.Liu S, Rovine MJ, Molenaar PC. Selecting a linear mixed model for longitudinal data: Repeated measures analysis of variance, covariance pattern model, and growth curve approaches. Psychol Methods. 2012;17(1):15–30. doi: 10.1037/a0026971. [DOI] [PubMed] [Google Scholar]
- 41.IBM Corporation. IBM SPSS statistics for windows. Armonk, NY: IBM Corporation; 2012. [Google Scholar]
- 42.Roth DL, Mittelman MS, Clay OJ, Madan A, Haley WE. Changes in social support as mediators of the impact of a psychosocial intervention for spouse caregivers of persons with Alzheimer’s disease. Psychol Aging. 2005;20(4):634–44. doi: 10.1037/0882-7974.20.4.634. [DOI] [PubMed] [Google Scholar]
- 43.Burgio LD, Collins IB, Schmid B, Wharton T, McCallum D, Decoster J. Translating the REACH caregiver intervention for use by Area Agency on Aging personnel: The REACH OUT program. Gerontologist. 2009;49(1):103–116. doi: 10.1093/geront/gnp012. [DOI] [PMC free article] [PubMed] [Google Scholar]
- 44.Gaugler JE, Potter T, Pruinelli L. Partnering with caregivers. Clin Geriatr Med. 2014;30(3):493–515. doi: 10.1016/j.cger.2014.04.003. [DOI] [PubMed] [Google Scholar]
- 45.Odenheimer G, Borson S, Sanders AE, et al. Quality improvement in neurology: Dementia management quality measures (executive summary) Am J Occup Ther. 2013;67(6):704–710. doi: 10.5014/ajot.2013.676004;10.5014/ajot.2013.676004. [DOI] [PMC free article] [PubMed] [Google Scholar]