

Abstract
Systemic inflammatory disorders resulting from infection, trauma, surgery, and severe disease conditions pose serious threats to human health leading to organ dysfunction, organ failure, and mortality. The highly complex and dynamic nature of the immune system experiencing acute inflammation makes immunomodulatory therapy blocking pro-inflammatory cytokines very challenging. Successful therapy requires the ability to determine appropriate anti-cytokine drugs to be delivered at a right dose in a timely manner. Label-free micro- and nano-biosensors hold the potential to overcome the current challenges, enabling cytokine-targeted treatments to be tailored according to the immune status of an individual host with their unique cytokine biomarker detection capabilities. This review studies the recent progress in label-free cytokine biosensors, summarizes their performances and potential merits, and discusses future directions for their advancements to meet challenges towards personalized anti-cytokine drug delivery.
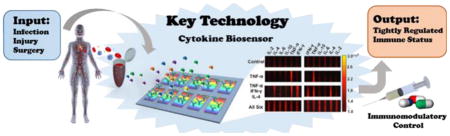
Graphical Abstract
1. Introduction
1.1. Cytokines: key clinical targets
The immune system provides a critical mechanism for a living organism to protect itself against invasions of external pathogens. Despite the conceptually clear role of the immune system, pathways underlying the defense mechanism are so complex and yet to be fully understood. The complexity of the immune defense system originates from dynamic functional interactions between biomolecules, cells, and organs over time. Among these players, cytokines are key biomolecules acting as mediators and modulators of the complex functional interactions and responses of the immune system [1–3]. They are soluble low-molecular-weight proteins secreted by immune cells and responsible for regulation of host defense, tissue homeostasis, cell-to-cell communication, and inflammatory reaction. The physiologic actions of cytokines are most apparent in the systemic inflammatory response syndrome (SIRS) that results from an excessive production of pro-inflammatory cytokines, such as IL-6 and TNF-α. These highly inflammatory responses cytokines are counteracted by certain anti-inflammatory cytokines, including IL-10, transforming growth factor (TGF-β), and IL-4, which attempt to restore immunological equilibrium. The multifaceted roles of cytokines in maintaining a tightly regulated balance of immunity have attracted enormous clinical interest in quantification of these biomolecules and its application for infectious disease treatment and drug development [4]. Previous studies suggest that quantification of cytokine-based immune fingerprints provides a more accurate way of stratifying and diagnosing bacterial infections than conventional methods based on symptoms, initial clinical observations, and basic laboratory markers [5, 6].
There has been an explosion in the use of immunotherapies for treating autoimmune diseases, infection [7], cancer [8], and other immune-related deficiencies [9, 10]. Among these therapies, cytokine-targeted methods aiming to establish a normal balance of the cytokine network in the host have shown great promise for some inflammatory diseases, such as rheumatoid arthritis and Crohn’s disease [11, 12]. Quantifying cytokines secreted by isolated immune cells or by whole blood test allows immune responses to be monitored, providing clinically and immunologically useful information related to infectious diseases, cancer, autoimmune diseases, allergy transplantation, and drug discovery [13]. Multiplexed detection of different cytokines in a single sample has been proven powerful for obtaining a more complete picture of immunity owing to the highly networked nature of their functions [14].
1.2 Current challenges: lack of real-time information on patients’ immune status
The conventional “gold standard” methods for cytokine quantification are immunoassay-based techniques including enzyme-linked immusorbent assay (ELISA) and bead-based immunoassay, whose signals are detected either by flow cytometers or plate readers. Involving sample incubation, detector antibody incubation, and labeling reagent incubation processes as well as multiple washing steps, these methods require a minimum assay time (defined as a minimum time between sampling and detection) of 3 – 8 hours in a current centralized clinical laboratory setting. In an ideal scenario, cytokine-targeted immunomodulatory therapy should be tailored to an individual’s immune status determined by quantifying a panel of cytokines. However, the setting of acute inflammatory diseases, imposes serious limitations on personalized immunomdulatory therapy, where appropriate cytokine-blockade drugs are to be delivered at a right dose in a timely manner to patients whose immune response may vary from individual to individual. Such immune status variations are exemplified by the dynamic transition of the immune status of sepsis patients from an initial pro-inflammatory phase to an anti-inflammatory phase within a short period of time (several hours to a few days). The pro-inflammatory phase at the early stage of the disease, termed “cytokine storm,” contributes to multiple organ dysfunction syndrome (MODS), prolonged chronic immune dysfunction [15], or mortality. The long assay lead time and labor intensiveness of the aforementioned gold standard methods and other similar sensing techniques based on labeled immunoassay inherently fall short of providing the urgently needed cytokine-based immune status information. Thus, this creates a huge technological gap between the clinical demand for rapid, sensitive assays of cytokine levels and the currently available assay techniques. The absence of accurate and rapid diagnostic methods renders the immunomodulation of acute inflammatory states highly empirical with no access to information allowing individualized selection and use of appropriate drugs [16]. Indeed, several review papers suggest that the failure of immunomodulatory therapy could be attributed to the lack of appropriate techniques to monitor inflammatory biomarkers and host defense responses across highly heterogeneous patient cohorts during the course of disease development [17–21]. We anticipate that future intensive care of acute inflammatory diseases will need personalized immunomodulatory drug delivery based on real-time information of cytokine-mediated immune response [21, 22]. Such a monitoring mechanism will permit fine-tuned immune control with a system feedback loop during the therapy (Fig. 1).
Fig. 1.
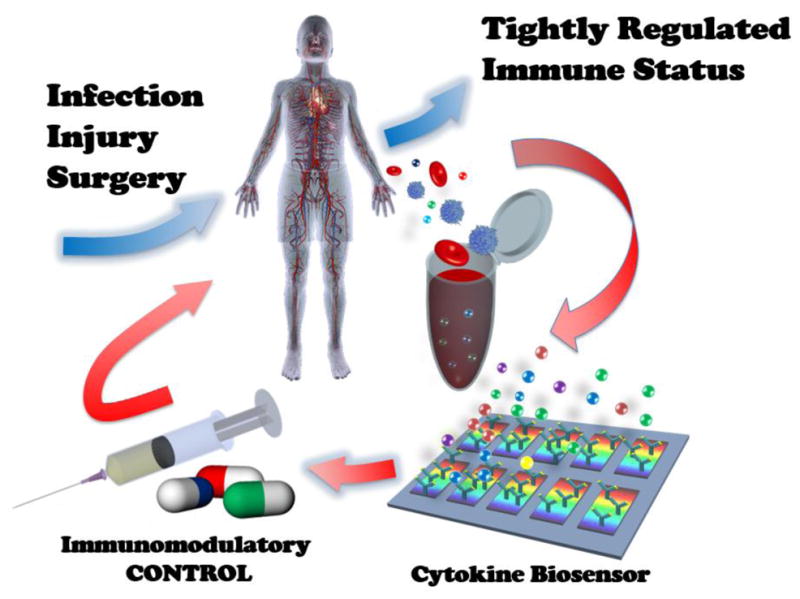
Concept of personalized immunomodulatory therapy for systemic inflammatory disease enabled by rapid cytokine-based immune status monitoring. This concept is analogous to feedback-loop system control theory used in system engineering that controls the behavior of a dynamical system with an input.
1.3 Potential of label-free cytokine biosensors
The clinical and immunological relevance of cytokine measurement has promoted recent effort to develop a wide variety of cytokine biosensors [23]. Of particular importance are their rapid, sensitive, sample-efficient bioanalysis capabilities. These biosensors are imperative components for the immune status monitoring system discussed above. For example, immune modulation in sepsis would require sensitivity to detect TNF-α, one of common sepsis biomarker cytokines, with a cut-off concentration value as low as 11.5 pg/mL in some cases [24]. Additional challenges exist in infants and children who need assays that spare clinical samples since their blood volumes are significantly less than those of adults.
Recent advances in nanomaterial synthesis [25, 26], nano optics [27–30], nanoelectrochemistry [31], nanomechanics [32, 33], and microfluidics [34] have brought together breakthroughs in label-free micro- and nano-biosensing for biomolecular analysis. Nanomaterial-based sensors offer excellent sensitivity in detecting analyte molecules. Integrated in a microfluidic system, these sensors allow for high-throughput parallel detection of biomarkers arrays, which is highly desirable for translation from benchtop discovery to clinical validation. The miniaturized system size yields a large surface-to-volume ratio in a small-volume environment while also reducing the diffusion distance of the reagent molecules. These features lead to rapid detection resulting from enhanced analyte-sensor interactions. Label-free biosensing eliminates the use of labeling molecules that experience photobleaching and interfere with analyte binding events. This approach would further add real-time analyte detection capability and enhanced selectivity to cytokine assays [35]. A system incorporating label-free cytokine micro-/nano-biosensors holds great potential to meet requirements of immediate diagnosis. In this review paper, we summarize recent progress in micro- and nano-biosensors implemented for cytokine detection, critically evaluate their performance in terms of potential of enabling guided, personalized immunomodulatory therapy against acute inflammatory diseases, and discuss future challenges and directions of the research field.
2 Label-free cytokine biosensing
2.1 Label-free bioanalysis: Why is it necessary?
The research community has seen increasing interest in label-free biomolecular analysis techniques. This is evidenced by an increasing number of review papers on this topic over the last five years. Such interest emerges along with a wider awareness of technical and practical advantages offered by label-free biosensing. For example, reviews by Qavi [36] and Hunt and Armani [37] well delineate these advantages against shortcomings of conventional methods involving a labeling process. Elimination of labeling agents, such as isotopes, fluorophores, enzymes, and nanoparticles, enables researchers to avoid adverse effects on biomolecular binding events, to achieve quantitative measurements (labeling could be only qualitative due to the inconsistent binding behavior of labels to analytes), and to save cost and time.
Label-free biosensing also enables researchers to study the binding kinetics of analyte molecules on a sensor surface. Labeling-based methods employing dye or fluorophore molecules experience signal decay over time as a result of photobleaching. In contrast, label-free bioanalysis allows continuous acquisition of signals during a binding assay, which provides time-course information of the binding event of biomolecules. This unique sensing feature bears an additional merit. Users of label-free biosensors can precisely determine the near-endpoint of the incubation process required for analyte molecules to settle on a sensor surface from the sensor response curve over the binding event. One does not need to wait for the system to reach steady state to quantify the analytes if the resulting reduction in sensitivity does not seriously compromise the assay; an initial slope of the sensor response curve, or initial rate of binding, could be correlated to the analyte concentration [38]. In this way, a long incubation process can be eliminated from the entire assay, thereby enabling rapid analyte detection. This is a significant merit brought by label-free methods.
In the context of cytokine-based immune monitoring, however, the ability to quantify analytes in a label-free fashion has a more profound significance. Immune cells experience alterations in their functions in response to infection and tissue dysfunction, often causing the immune system to experience a dynamic transition from a pro-inflammatory phase to an anti-inflammatory phase. Quantifying cytokines in bloodstream, lymph nodes, or tissue alone may not be sufficient for monitoring of rapidly changing immune status during the course of disease development. Building predictive models of immunity requires more comprehensive monitoring of the complex and dynamic cytokine-mediated functional behavior of immune cells. Real-time observation of cellular cytokine secretion in response to stimulation mimicking a pathogenic attack provides the means to probe such behavior. Conventional imaging techniques enabled by labeling are capable of obtaining information about the physical behavior of cells of interest. But the information obtained by cellular imaging is qualitative. Precise determination of the cellular behavior requires the quantitative cytokine production rate. Obviously, the rate carries critical information about the magnitude and time constant of the cellular time-varying response. Researchers can only access such information from label-free quantification of cell-secreted cytokines.
2.2. Label-free sensing principles
The common processes of label-free bioanalysis include (1) construction of sensing elements on a solid surface, (2) binding of analyte biomolecules onto the surfaces of the sensing elements, and (3) acquisition of sensor signal readouts using a transduction principle. Creation of sensing elements entails immobilization of recognition substances (i.e. receptors) of the sensor surface, such as proteins, peptides, or nucleic acids. Ideal receptors identify and capture target analytes with excellent specificity, binding affinity, and chemical stability. In the case of protein surface immobilization, it is necessary to create an environment that retains the original activity of the protein. To this end, researchers usually use biopolymers to immobilize the protein in a controlled manner [39]. This approach also reduces non-specific adsorption of analytes to the sensor surface, thus enabling discrimination between specific and non-specific bindings [40]. The binding of the analytes changes the sensor surface property or the near-field environment of the sensor surface. The property change is read out as an output signal by means of a transduction mechanism involving nanoscale mechanics, electromechanical interaction, photon transmission, electron transport, or photon-electron interaction. Conjugation of an analyte to other proteins, enzymes, or nanomaterials could amplify a signal resulting from a transduction process. Such transduction amplification often incorporates the process of sandwich immunoassay, where the analyte is sandwiched between capture and secondary antibodies. Sandwich immunoassay is a common method in label-based biosensing, which requires more assay steps than those reporting the surface binding of an unconjugated analyte. However, we include some of biosensing studies incorporating the sandwich immunoassay-based signal amplification scheme in our review as long as the secondary antibodies do not carry an agent directly acting as a label generating the signal. Based on the signal transduction mechanisms described above, we categorize label-free micro- and nano-biosensors as mechanical, electrical, optical transduction, and plasmonic sensors. Now, we review these sensors implemented in label-free cytokine quantification and evaluate their (a) analyte type, (b) sensitivity (or limit of detection), (c) detection range, (d) sample volume, and (e) multiplexity. These performance metrics are key factors to determine whether the biosensor is suitable for enabling the aforementioned cytokine-based immune status monitoring.
2.3 Mechanical cytokine biosensors
Mechanical biosensing processes detect surface binding events of biological molecules by means of mechanical deflections or dynamic resonance shifts of the transducer system resulting from surface stress or mass changes. The most representative mechanical micro- and nano-biosensors are (1) microcantilevers fabricated on a silicon chip using semiconductor micromachining technologies, (2) acoustic wave sensors based on integrated piezoelectric mechanical transduction, and (3) quartz crystal microbalance mass sensors. These sensors allow researchers to detect a wide range of biomolecules, including nucleic acids, proteins, and lipids [33].
Microcantilever biosensing uses deflection-based or resonance-based measurement depending on the signal generation mechanism. Deflection-based measurement detects surface stress caused by analyte binding on a cantilever surface. The surface stress gives rise to a cantilever deflection, which is measured using a probe laser and a position sensitive detector. In contrast, resonance-based measurement detects the resonance shift of an oscillating microcantilever due to a mass increase upon analyte surface binding. While the resonance-based measurement yields higher sensitivity, we find that deflection-based measurement is a common technique for cytokine detection. The resonance-based measurement is highly susceptible to damping effect in a liquid, potentially showing error-bearing variation with solution composition [36].
The sensitivity of deflection cantilevers is determined by their mechanical properties (e.g. Young’s modulus), structural designs, and surface properties. A significant challenge lies in achieving sufficient sensitivity for cytokine detection since the molecular sizes of cytokines are much smaller than other more commonly detected disease biomarker proteins, such as prostate-specific antigen (PSA) [41]. To address this, Dutta et al. [42] introduced nanostructured, colloid-like features to a gold-coated microcantilver surface and detected IL-1β in PBS buffer with 2-fold higher sensitivity than a smooth surface. The sensitivity improvement is attributed to a larger analyte binding area provided by the nanostructured surface. But the LOD of their sensors is 10 ng/mL, still remaining several orders of magnitude larger than desirable for clinical use. In a more recent study, van den Hurk and Evoy [43] investigated the impact of selection of linker molecules on the sensitivity of deflection microcantilever measurements of IFN-γ in PBS buffer. They found linking procedures using gluteraldehyde and prolinker B are effective to yield better sensitivity.
Other mechanical transduction mechanisms for cytokine detection reported in literature include surface acoustic wave sensing and quartz microbalance measurement. Krishnamoorthy et al. [44] performed detection of IL-6 in serum using a ZnO-based guided shear horizontal surface acoustic wave (SH-SAW) biosensor. The biosensor has an active sensing window between lithographically patterned comb-shaped electrodes acting as interdigitated input and output transducers on the ZnO acoustic wave guiding film. The researchers measured the total mass of proteins attached to the sensor surface, which was determined by the total sample volume and concentration. Bahk et al. [45] used a quartz crystal microbalance (QCM) biosensor with antibody-immobilized gold electrodes. They demonstrated an improvement of selectivity and sensitivity in QCM-based detection of TNF-α in PBS buffer using a sandwich immunoassay configuration that incorporates magnetic particle-conjugated secondary antibodies. A magnetic force applied to the analyte-bound particles amplified the resonance shift due to the TNF-α surface binding, which resulted in the sensitivity enhancement of the sensor.
The miniaturization of sensor systems enhances their speed by increasing the mechanical bandwidth. The bandwidth of micro- and nano-mechanical transducers is typically around a few kHz. These devices can respond to a mechanical step input within a millisecond or a shorter period of time. Among these mechanical cytokine biosensors described above, the deflection microcantilevers developed by Dutta et al. [42] achieved the shortest assay time of ~ 20 min. This time scale is much longer than the dynamic response time of these devices. This means that the analyte binding kinetics governs the speed of the entire assay process. The aforementioned assay time appears to have been arbitrarily determined before the cantilever deflection reaches steady state. In this case, the binding kinetics-governed assay may be completed at any time point where the sensor yields a sufficiently detectable signal for the lower bound for the analyte concentration. Other mechanical cytokine biosensors reviewed here require an assay time on the order of 1 – 2 h. The length of the assay is highly affected by the sample flow rate. A higher flow rate allows convection to dominate the transport of the analyte molecules reaching the sensor surface. Indeed, Dutta et al. [42] employed a sample flow rate as high as 0.1 mL/min and achieved the short assay time mentioned above. Strong convection yields a higher analyte binding rate as it prevents the generation of a large analyte depletion region near the sensor surface, and facilitates the rapid sensor response. The longer assay time is probably attributed to a slower sensor response resulting from weak convection or lack of convection, where slow diffusion dominates in the analyte transport mechanism. The QCM biosensor-based cytokine detection by Bahk et al. [45] required the longest assay time (>2 h). The researchers of this study performed the measurement by simply depositing a stationary cytokine-containing solution onto the sensor surface with no sample flow. Regardless of the transduction mechanisms, the same principle applies to determining the speed of assays employing the micro- and nano-scale label-free biosensors.
2.4 Electrochemical cytokine biosensors
The principle of electrochemical biosensing methods is based on an electrical signal change associated with analyte binding onto electroactive sensing elements of a circuit. Correlating the signal change with the quantity of analyte enables the measurement. Electrical biosensors are a promising candidate for point-of-care analysis under limited resources since they are suitable for integration in a system compatible with complementary metal-oxide-semiconductor (CMOS) technology. Such integration can be facilitated by low power consumption and ease of miniaturization demonstrated by these sensors [46, 47]. Electrical biosensors are constructed by immobilizing receptors, such as antibodies and synthetic nucleic acids (i.e., aptamers), on lithographically patterned microelectrodes or electrical nanomaterials. The signal measurement in cytokine biosensing reported in literature has been performed by electrochemical impedance spectroscopy (EIS) [48, 49], amperometric detection [49, 50], capacitive affinity detection [51], and nanoelectronic field-effect transistor (FET) biosensing [52, 53].
EIS-based methods measure the impedance of an electrochemical cell while applying an AC potential across the cell using electrodes. With antibodies immobilized on its surface, one of these electrodes (working electrode) serves as the sensing element. The impedance data provides information about charge transfer processes at the interface between the sensing electrode and the solution of the electrochemical cell, which is affected by the presence of the analytes bound to the sensing element. Previous studies show that an electrode geometry incorporating arrayed interdigitated features provide higher sensitivity for biosensors [54–56]. Using a device incorporating this electrode geometry, Pui et al. [49] has recently demonstrated high-sensitivity (1pg/mL-level) detection of TNF-α in cell culture medium originating from LPS-stimulated Jurkat cells. The same research group [48] has further achieved detection of TNF-α eluted from non-diluted human serum. To eliminate undesirable background interference, the researchers depleted albumin and IgG molecules from the original serum using antibody-coated magnetic beads. They later eluted TNF-α using similar beads and loaded the effluent to their EIS biochip, thus advancing their cytokine biosensing technique for more practical use in a clinical setting.
Amperometric sensing is another electrical chemical label-free cytokine detection method similar to EIS. The difference is that this method measures variations of electrical current (Faradic current) across an electrochemical cell with a varying AC potential and employs enzymes to amplify the signal associated with analyte biding events. In amperometric biosensing, the measured current provides a sensing output signature. Liu et al. [50] quantified IFN-γ in serum with an electrical chemical aptamer-based biosensor. The sensor is a DNA hairpin carrying IFN-γ-binding aptamer, conjugated with a methylene blue redox tag, and immobilized on a gold electrode by self-assembly. The binding of IFN-γ unfolds the hairpin-structured sensor. The structural change decreases the efficiency of electron transfer from the redox label to the electrode. The resulting reduction in Faradaic current serves as an output-sensing signature. By utilizing the redox tag, the researchers achieved high sensitivity and specificity for IFN-γ detection even in the presence of background serum proteins.
Recent advances in the fields of nanomaterial synthesis and nanomanufacturing have propelled tremendous research efforts to develop novel nanoscale biosensors. Field-effect transistor (FET) devices incorporating semiconducting/conducting nanomaterials, such as silicon nanowires [57], carbon nanotubes [58, 59], graphenes [60, 61], and other two-dimensional layered materials [62, 63], have been proven to be promising candidates for protein analysis owing to their high performance. The large surface-to-volume ratio and unique electronic properties of these materials yield high sensitivity to biochemical modifications at their surfaces. In addition, FET biosensors typically exhibit real-time response and high sensing selectivity. In FET-based biosensing, binding of analyte molecules at the semiconductor channel surface with immobilized receptors varies the channel surface potential and modulates the channel conductance. Measuring the conductance variations allows for quantifying the analyte in solution in contact with the transistor channel.
In regards to cytokine biosensing, Pui et al. [52] demonstrated very fast (20 s) and ultrasensitive (0.1 pg/mL) cytokine detection using silicon nanowire biosensors. The biosensors allowed them to simultaneously monitor the time-course (not real-time) variations of TNF-α and IL-8 in a supernatant of macrophage cell culture and in serum of rats under LPS stimulation. The study found that the serum cytokine levels monotonically increased at a certain time point but sharply decreased after reaching a peak value while the cytokine levels in the cell culture medium continuously increased with time. The transient characteristics of the cytokine variation in the animal models clearly illustrate the complex nature of the immune response of living organisms that involves the anti-inflammatory reaction. The common drawback of these biosensors is their high manufacturing cost. However, Hakim et al. [53] have recently developed a low-cost top-down silicon nanowire fabrication method based on simple and mature photolithography, thin film technology, and plasma etching, which are similar to those used for manufacturing a thin film transistor (TFT) displays. Antibody-functionalized nanowire sensors detected IL-8 and TNF-α in BPS buffer over a large range of concentrations of 0.2pg/mL – 200 μg/m. Such a large detection range could be highly advantageous for future use in multiplex immunoassays. More recently, Nam et al. [64] have demonstrated high-sensitivity (1 pg/mL) detection of TNF-α in BPS buffer using a FET biosensor consisting of two-dimensional (2D) atomically layered MoS2 transitional metal dichalcogenide semiconducting sheet. Due to their compatibility to cost-effective manufacturing and transport properties highly sensitive to external stimuli, FET biosensors based on 2D atomically layered materials could be emerging alternatives for ultrasensitive label-free biosensing applications.
The FET nano-biosensors reviewed here hold great potential to be integrated in a portable, standalone electronic module system owing to their CMOS technology compatibility. These biosensors would be highly suitable for point-of-care (POC) clinical applications requiring immediate detection of cytokine biomarkers. However, the devices are susceptible to biofouling and non-specific binding on active sensor surfaces. These issues pose serious challenges against FET-based cytokine biosensing that involves complex, physiological solutions [35]. Thus, practical implementation of the FET nano-biosensors needs to be coupled with a mechanism permitting sample purification and device operation in a purified buffer as discussed later. In addition, we find no study demonstrating multiplexed cytokine detection using FET nano-biosensors. Comprehensive monitoring of the complex immune response requires further advancements in FET-based biosensing that enable simultaneous detection of multiple cytokine species for the same sample.
2.5 Optical cytokine biosensors
Optical biosensing provides a significant foundation for robust, label-free detection of biomolecules. Optical signal signatures originate from refractive index changes near a solid light-guiding microstructure upon analyte surface binding. Theses signatures typically take the form of changes in the light reflection, transmission, or absorbance properties of a sensing structure. Compared to mechanical or electrical biosensing methods, optical sensors are easier to operate in aqueous solutions since they eliminate issues, such as fluidic damping and electrical short-circuit formation. Furthermore, optical biosensing does not suffer from signal noise owing to pH or ion concentration variations in a buffer solution. For these reasons, it is not surprising that quite a few studies have implemented optical methods for label-free cytokine biosensing. Currently, resonance cavity-based measurement using optical devices, such as photonic crystals and optical resonators, is the most common approach used for cytokine detection.
The mechanism of photonic crystal resonators is based on optical bandgap engineering, which leads to spatial confinement of light at a particular wavelength into periodic optical nanostructures. Compared to other optical resonator biosensors, planar photonic crystal biosensors confine less resonant electromagnetic energy in a solid light-guiding structure, which enables stronger light-matter interaction. Mandal et al. [65] developed a planar photonic crystal biosensor to perform multiplexed cytokine (IL-4, IL-6, IL-8) detection. The sensitivity is 0.35nm resonance shift per nanometer of surface bounded molecule. The lowest detectable analyte mass by this sensor is 63 ag, which corresponds to a surface mass coverage of 7.5 pg/mm2. In their design, the cytokine detection range is from 1–100μg/mL. Although the 1-D photonic crystal resonator is less sensitive due to its low Q-factor, the sensitivity could be further improved by designing a narrower line-width. Another example of photonic crystal resonators was demonstrated by Choi et al. [66]. The researchers integrated photonic crystal resonators with a microchannel structure to quantify the analyte with a sample volume as small as 300 pL and the limit of detection is 16.7 ng/mL. Besides, the detection dynamic range of the biosensor is 3 orders of magnitude, which is larger than those of other similar photonic crystal resonators. The relatively low sensitivity of photonic crystal biosensors still remains to be improved.
An optical resonator consists of a circular or periodic hollow-shaped microstructure that confines incident light at a specific wavelength and allows the confined light to circulate in a closed path. The wavelength-specific light confinement in the microstructure is called optical resonance. An optical resonator biosensor is constructed by immobilizing receptors on its microstructure surfaces. Analyte binding to the receptors changes the refractive index surrounding the sensor surface, causing the resonant wavelength to shift. Correlation between the resonant wavelength shift and the analyte concentration in a sample allows for quantification of targeted biomolecules. Optical resonator biosensors usually exhibit significantly distinct selectivity towards the resonant wavelength owing to high quality factor (Q). The high selectivity is desirable for achieving high sensitivity.
Luchansky et al. [67] demonstrated the first cytokine detection based on silicon photonic microring resonators. The researchers successfully measured IL-2 and IL-8 secreted from Jurkat T lymphocytes in serum-containing cell culture media. To enhance the overall resonant wavelength shift, they introduced the sandwich immunoassay scheme involving heavy secondary antibodies. The limit of detection of the microring resonators is 100 pg/mL. In their following report [38], they constructed the silicon photonic microring resonators in an array form and simultaneously measured four cytokines, IL-2, IL-4, IL-5 and TNF-α with a one-step sandwich immunoassay process. To prove high antibody-antigen binding specificity, they also conducted a negative control test confirming the negligible effect of non-specific binding. Finally, they measured the temporal IL-2 secretion profiles of three primary T-cells (Th0, Th1, Th2 cells) and Jurkat T-cell using the silicon photonic microring resonator arrays.
Armani et al. [68] developed a whispering gallery mode (WGM) resonator biosensor with a toroidal microcavity structure using a simple three-step microfabrication process. Incident light was optically coupled with the resonator via a tapered optical fiber while precisely controlling the fiber position with respect to the microcavity. The loss of light circulating in WGM resonators is normally extremely small, which results in ultrahigh Q biosensing. The researchers demonstrated the sensor performance using a series of IL-2 cytokine concentration ranging from 10−19 to 10−6 M and obtained a calibration curve showing the extremely high dynamic range (12 orders) and single-molecular level detection limit (~5 fg/mL). Detection of IL-2 in fetal bovine serum using the WGM resonator sensor validated its utility in a clinically relevant setting. The result showed that pure serum would not induce any resonance wavelength shift. But the detection limit of IL-2 was somewhat poorer in serum than in pure buffer. This could be attributed to the presence of background substances in serum.
We find that both of the microring device [67] and the WGM resonator [68] described above enabled highly rapid, label-free cytokine detection with a sample loading-to-answer time of ~5 min. The rapid detection is possible because the analyte concentration is quantified from the initial curve of analyte binding kinetics that is obtained much prior to establishment of the equilibrium state. In general, the non-equilibrium detection approach compromises sensitivity. However, the particular WGM resonator biosensor discussed here still showed the single-molecule detection capability. Armani et al. [68] originally attributed such extremely high sensitivity to improved resolution in measuring resonant shifts due to the ultrahigh Q (108) of the resonator and an enhanced resonant shift resulting from local heating of the resonator surface by light-analyte interaction. However, another research group [69] later invalidated the explanation based on the opto-thermal effect. At present, the physics behind the ultrahigh sensitivity is yet to be fully understood.
Although the microring and WGM resonators show higher sensitivity, the 1-D photonic crystal resonator may be easier to implement for multiplexed detection. The alignment of multiple tapered optical fiber waveguides to microtoroid, microring, and microdisk resonator structures is complicated and requires much manual precision and labor. Besides, the 1D photonic crystal resonator with the small cavity size provides a larger free spectral range (FSR) over 200nm, where most WGM sensors are ~3–5nm. The larger FSR permits more resonant peaks to enable multiplexed detection [65].
To eliminate the stringent optical alignment requirements prohibiting easy implementation of optical resonators in multiplexed detection, Huckabay et al. [70] demonstrated WGM resonator-based cytokine biosensing with fluorescently labeled glass microspheres. A total internal reflection microscope based on free space optics was used to couple evanescent field light to the microspheres distributed on a glass slide surface. The fluorescent dye (Alexa Fluor 633) served as the sensor reporters, whose emission intensity variation allowed for measuring the analyte concentration. The researchers performed muliplexed analyte detection by utilizing two groups of microspheres with distinct sizes (38μm and 53μm in diameter), which were conjugated with CA-125 and TNF-α antibodies, respectively. The limit of detection achieved for the TNF-α detection using these microsphere WGM resonators was about 240 pg/mL. Unlike all the other resonators described above, the microsphere WGM resonator biosensors require no precisely aligned optical waveguides for sensor-light coupling. Furthermore, no sophisticated microfabrication is needed for constructing these resonators. The measurement only employs sensor structures as simple as disperse high-dielectric microspheres on a glass substrate.
2.6 Plasmonic cytokine biosensors- SPR & LSPR
Plasmonic biosensors, first demonstrated in 1983 [71], has been extensively studied over the last decade. The principle of the plasmonic biosensors relies on the interaction of electromagnetic (EM) radiation on a noble metal in contact with a surrounding dielectric medium. Specifically, when the collective motion of the free electrons in a metal resonates with incident light of particular wavelength, it gives rise to surface-confined EM modes that are commonly referred to as “surface plasmons (SPs).” SPs possess an evanescent field at the boundaries between the metal and the dielectric region. The evanescent field of SPs decays exponentially into the dielectric region, which is extremely sensitive to the local refractive index change on the metal surface. The RI change induced by the temporal or irreversible adsorption of biomolecules in the vicinity of the metal–dielectric interface results in the alternation of the resonant condition of SPs. Such a change can be traced in real time, which enables label-free quantitative analysis of biomolecular surface density, protein binding kinetics, and analyte-antibody interactions. Generally, SPs emerge under two settings: (1) surface plasmon resonance (SPR), where propagating SPs are excited on a metallic thin film and (2) localized surface plasmon resonance (LSPR), where sub-wavelength-sized metal nanoparticles are excited by an external light source.
SPR biosensors are perhaps the most widely used optical label-free sensing technique for detection of biological and chemical analytes. However, the SPR biosensors based on the Kretschmann configuration suffer from several fundamental limitations, making the clinical applications of SPR technique challenging. First of all, the traditional SPR technique still requires bulky optical instruments, including a prism coupler, which hinders the sensor miniaturization and integration with other functional systems. Moreover, the SPR evanescent field exhibits a longer penetration depth typically on the order of half of the resonance wavelength (a few hundreds of nm). The size of the penetration depth is much larger than the typical sizes of target biomolecules [72]. As a result, SPR biosensors are susceptive to background noise caused by fluctuations of the bulk refractive index, and suffer from limited sensitivity that usually lies between 10−7 and 10−6 in refractive index unit (RIU) [72, 73], which corresponds to a detection limit in the range of pM-nM. The limited sensitivity has become one of the most critical issues in translating the SPR technique to clinical applications. Many of clinical settings require detection of small analytes (i.e. cytokines) at concentrations typically falling in the range of fM to pM. An improvement of the low sensitivity typically requires additional steps involving the use of secondary antibodies or compounds.
For example, Chou et al. [74] achieved a detection limit down to 1.3 ng/mL for IL-6 in cell culture medium by combining the SPR technique with a sandwich immunoassay that uses secondary antibody as a signal-amplifying agent. This assay allowed the researchers to spontaneously monitor IL-6 secretion by LPS stimulated human fibroblast MRC5-CVI cells. More recently, Martinez-Perdigueroa et al. [75] introduced gold nanoparticles, instead of the secondary antibodies, for signal amplification. This method improved TNF-α detection sensitivity to 11.6 pg/mL (211fM) and 54.4 pg/mL (989 fM) in spiked buffer and human serum, respectively. The approach of adding the secondary recognition elements induces an overall increase in molecular weight and significantly enhances the measured signal. Despite the improved sensing performance, this methodology complicates overall procedures and inevitably increases the number of assay steps.
Researchers have explored alternative SPR excitation methods using fiber-optics [76] to improve the sensor performance for cytokine detection. Battaglia et al. [76] demonstrated the first fiber-optic SPR biosensor to detect IL-1, IL-6, and TNF-α in BSA solution and spiked cell culture medium and achieved a LOD at or below 1 ng/mL. However, such sensitivity still fails to meet the clinical requirements. A recent theoretic study suggests that optimization of the intrinsic properties of SPR would further improve the sensitivity [77]. Improving the optical characteristics of the metal thin film, or altering the dielectric surroundings may provide the desirable result. It has been reported that the use of a multilayer thin film consisting of noble and ferromagnetic metals (Au/Co/Au) yields a four-fold sensitivity enhancement over conventional SPR biosensors [78]. Long-range surface plasmon resonance (LR-SPR) sensors have also displayed a significantly improved sensitivity of approximately 2.5 × 10⁻⁸ RIU (~40 fM in terms of concentration) [79].
Recent advances in nanomaterials and nanofabrication have brought LSPR-based plasmonic biosensing technologies that show great promise in providing fast, real-time label-free detection of biological species[72, 80, 81]. The highly localized confinement of a strong EM field in the LSPR effect generates an evanescence field in the near field of a metal nanostructure. Functionalization of such a metal nanostructure with receptors allows for forming a nanoscale LSPR biosensor. The evanescent field surrounding the LSPR biosensor can be directly excited by an EM illumination using free space optics. This eliminates the need for bulky optics for EM coupling required for SPR biosensing. As a direct consequence, biomolecules attached to the nanoparticle surface occupy a space covering a larger fraction of the volume of the evanescent-field, potentially yielding high sensitivity that allows for detection of tiny biomolecules in a low amount. Owing to the extremely small size scale and the ease of signal acquisition, the LSPR-based biosensing is highly desirable for sensor miniaturization, integration, and multiplexing.
Huang et al. [82] demonstrated, for the first time, using silver nanoparticles as optical LSPR biosensors to detect TNF-α molecules at a single molecular level with unprecedentedly high selectivity. But such excellent sensing performance comes with a long analysis time required for the analyte binding event to reach equilibrium. This makes it undesirable to implement such an assay for rapid immune diagnosis with high statistical accuracy. By integrating the LSPR biosensors with fiber optics, Chiang et al. and Huang et al. detected IL-1β and TNF-α at tens of pg/mL within less than 10 mins [83, 84]. However, these sensors need to dip the fiber probe into a large volume of sample for detection, making the implementation of such sensors for clinical application impractical. In addition, the coupled fiber-optics were highly sensitive to the bulk refractive index change and resulted in error and poor assay repeatability in measuring cytokines in a complex clinical medium. More recently, Chen et al. [85] developed a LSPR biosensing device using micropatterned gold nanorod arrays and demonstrated parallel multiplexed serum cytokine detection under a condition simulating a real clinical setting. Instead of using individual nanoparticles as sensing elements, the researchers patterned an ensemble of isolated gold nanorods into microarrays and functionalized them with antibodies. The gold nanorod LSPR biosensor microarrays allowed for high-throughput analysis of six cytokine biomarkers in a 1μL sample of serum at concentration ranging from 10 – 10,000 pg/mL within 40 minutes. So far, the biosensor developed by these researchers shows the highest multiplexing capability across all the devices reviewed here.
2.7 Comparative label-free cytokine biosensor performances and theoretical limits
A most common approach to rapid immune status monitoring required in systemic inflammatory disorder diagnosis involves detection of cytokines in serum extracted from centrifuged blood. The use of purified cytokines in phosphate-buffered saline (PBS) solution rather serves the purpose of demonstrating and/or calibrating biosensors. Cytokine detection coupled with cell culture is more relevant to functional analysis of immune cells in the post pro-inflammatory phase. Fig. 2 compares the sensitivity and speed of label-free cytokine biosensors used in serum or buffer solution together with theoretical sensor performance predictions following the modeling approach described below. Detailed specifications of these biosensors are provided in Table 1. Ideal cytokine detection in the common critical care setting needs to meet stringent requirements, such as sensitivity reaching the 10 pg/mL level [24] and speed permitting analyte analysis with a sampling-to-answer time < 30 min, which is estimated accounting for the fact that the immune status could change within a few hours, while holding multiplexing power to detect a wide variety of cytokine species in serum. Sample-sparing capability is desirable for these biosensors but may not be so critical as the other metrics unless the analysis targets children and infants. Our comparative study reveals that biosensors based on electrochemical and LSPR plasmonic detection schemes are close to meet the clinical requirements. The performances of the mechanical and optical biosensors are still far from meeting these requirements. Their sensitivity needs to improve by more than two orders of magnitude for cytokine detection.
Fig. 2.

Regime map showing sensitivity versus assay time for different types of label-free biosensors. The term of “sensitivity” refers to limit of detection (LOD) in pg/mL. The top panels show the schematics of the sensor types. The color of each panel frame and of each circled area of data points in the regime map identifies the same corresponding sensor type shown above the panel. The black dashed lines show the theoretical limits of sensitivity and assay time based on antibody-analyte binding kinetics. (left dashed line: lower bounds for LOD and assay time in the analyte binding reaction-limited regime at Da<1; right dashed line: lower bounds for LOD and assay time in the analyte diffusion-limited regime at Da>10.) The light blue region shows the biosensor performance needed for acute inflammatory cytokine secretion measurement to serve timely personalized anti-cytokine drug delivery. FET nanowire, EIS, and LSPR biosensors exhibit sensitivity and assay time approaching the desirable levels. Note that the FET nanowire biosensors in ref. [52] and [53] (marked with stars * in the figure) show exceptional sensitivity and assay time beyond the theoretical limit. The underlying mechanisms are unclear. An analyte mass of 15 kDa was used to convert the sensitivity unit from grams per milliliter to molar concentration. The assay time was determined assuming kon = 10−6 M−1·sec−1and koff = 10−3 sec−1, respectively. The top panel figures are reproduced from [86] (FET nanowire), [87] (microcantilever), [88] (ring resonator), [89] (impedance) and [85] (LSPR) with permission.
Table 1.
Characteristics of representative label-free biosensors
| Category and Symbol in Fig. 2 | Sensor Type | Analyte Type | Sensitivity (pg/ml) | Assay Time (min) | Sample Volume (μL) | Ref | |
|---|---|---|---|---|---|---|---|
| Mechanical Biosensors |

|
Deflection Cantiliver | IFN-γ in PBS | 5×10⁶ | 540 | 200 | [43] |

|
Deflection Cantiliver | IL-1β in PBS | 1×10⁴ | 21 | 150 | [42] | |

|
QCM | TNF-α in PBS | 2.5×10⁴ | 40 | 30 | [45] | |

|
Acoustic Wave | IL-6 in PBS | 2×10⁴ | 120 | N/A | [44] | |
|
| |||||||
| Electrical Biosensors |
|
Impedance Spectroscopy | TNF-α in Serum | 1 | 145 | 50 | [48] |
|
|
TNF-α in Cell Culture Medium | 1 | 30 | 20 | [49] | ||

|
Aptamer-Based Electrochem | IFN-γ in HEPES | 1000 | 16 | 100 | [50] | |
|
|
IFN-γ in HEPES | 1500 | 60 | 2000 | [90] | ||

|
Field Effect Transistor | TNF-α and IL-6 in Cell Culture Medium | 0.1 | 0.33 | 40 | [52] | |
|
|
IL-8 and TNF-α in PBS | 0.2 | 0.5 | N/A | [53] | ||
|
|
TNF-α in PBS | 1 | 30 | N/A | [64] | ||
|
| |||||||
| Optical Biosensors |

|
Optical Ring Resonator | IL-2 and IL-8 in PBS | 100 | 45 | 150 | [67] |
|
|
IL-2, IL-4, IL-5 and TNF-α in Cell Medium | 1500 | 5 | N/A | [38] | ||

|
WGM | CA-125 and TNF-α in PBS | 120 | 240 | N/A | [70] | |
|
| |||||||
| Plasmonic Biosensors |

|
SPR | IL-6 in Cell Culture Medium | 1300 | 20 | 60 | [74] |

|
EGF, IL-4, TNF-α, TGF-β1, VEGF and Ang-2 | 2×10⁴ | 25 | 300 | [91] | ||

|
TNF-α in Human Serum | 1×10⁶ | 30 | 200 | [75] | ||

|
Fiber-Optics SPR | IL-1, IL-6 and TNF-α in PBS | 1000 | 20 | N/A | [76] | |
|
|
LSPR | TNF-α in PBS | 2 | 60 | 10 | [82] | |

|
Fiber-Plasmonic LSPR | IL-1β in Synovial Fluids | 21 | 10 | 200 | [83] | |

|
TNF-α and MMP-3 in Synovial Fluids | 8.22 | 10 | N/A | [84] | ||

|
LSPR Microarrays | IL-2, IL-4, IL-6, IL-10, TNF-α, and IFN-γ in Human Serum | 5 | 40 | 1 | [85] | |
|
| |||||||
| ELISA/Luminex® |

|
Fluorescence | Cytokines in Serum | 1.5 | ~240 | 50 | |
There are primarily three factors determining the theoretical limit of detection and speed of a biosensing system: (1) inherent biosensor sensitivity towards analyte binding events; (2) sample delivery; and (3) affinity between target analytes and receptors [92]. For example, an optical resonator biosensor exhibits high sensitivity to a small amount of molecules due to the high Q value, which eliminates the need for a large sensing area. In contrast, the sensing area of an SPR-based plasmonic biosensor is much larger, which leads to more capacity to capture target analytes. But the SPR sensor requires a larger number of molecules bounded on its surface for sufficient signal acquisition because of its poorer inherent sensitivity. To fully predict sensing performance across different types of biosensors, one must understand the detailed microscopic view of micro/nanoscale analyte-sensor interactions involving mass transport and analyte reaction kinetics.
The theoretical limit of detection (LOD) can be estimated by knowing the available binding site on the sensor surface (Bn), the minimum number of detectable molecules (NLOD), and the equilibrium dissociation constant (KD) of the specific analyte/antibody pair. By coupling those parameters with first-order Langmuir kinetics, the total number of surface-bound molecules (Beq) at steady state as well as the corresponding LOD are given by
| (1) |
| (2) |
Assuming that the receptor molecules have the same surface coverage density regardless of the sensor material, the relation shown in equation (2) allows us to calculate the LOD as a function of Bn/NLOD, which is equivalent to the surface area divided by the minimum detectable number of surface-bound analyte molecules for a given value of KD. (Fig. 3). Although it difficult to use this relation to predict the LOD of a particular biosensor because of the inability to precisely determine most of the parameters described here, it still provides insight into how the LOD could be improved for the sensor.
Fig. 3.

Calculated molecular limit of detection as a function of detectable binding ratio for label-free biosensors based on Langmuir isotherm. The detectable binding ratio is defined by the total available binding sites (Bn) divided by the minimum numbers of detectable bound molecular (NIod). The grey region shows the LOD of the label-free biosensors estimated based on the values of dissociate constant (KD) from commonly used cytokine antibodies in literature [74, 93–95].
Biosensors normally operate between binding kinetics-limited and mass-transport-limited regimes [92]. In mass-transport-limited regime, the analyte biding events take place at a very high rate, and the physics determining the sensor performance is the diffusion and convection of sample fluid. The kinetics-limited regime emerges when the surface binding reaction is very slow. Here, we can estimate the assay time required for a low-concentration sample from the time required for the analyte surface binding kinetics to reach equilibrium. In the transient process before the system reaches its equilibrium state, an analyte depletion zone evolves near the sensor surface, which leads to a competition between reaction and diffusion. Accounting for the reaction-diffusion competition, the time constant (i.e., time scale) required for the analyte binding event to reach equilibrium τ is given by
| (3) |
| (4) |
where is Damkohler number, which is an important index to evaluate whether the system is reaction-limited or diffusion-limited, kon (koff ) is the association (dissociation) rate for a specific analyte-receptor pair, bm is the surface binding site density, L is the length of the sensor parallel to the flow, D is the diffusion constant of the analyte, F is the dimensionless collection flux which is determined by Peclet number and the sensor geometry as described in reference [92].
Since the binding affinity of cytokines towards their receptors is usually weak (KD ~ 10−9 – 10−10M), cytokine biosensors are primarily operated in the reaction-limit regime. According to equation (3), τ is primarily determined by the binding affinity and concentration of the analyte. If the data acquisition takes place after the signal reaches the plateau, the theoretical assay time is equal to τ. It is still possible to set a fixed assay time shorter than the equilibrium time and to only measure the binding rate from a transient data curve while sacrificing the sensor sensitivity.
3 Microfluidics-based cytokine immunoassay
3.1 microfluidic sensor integration and miniaturization: label-free biosensing enabler
Modern advances in microfabrication technologies have driven an increasing number of studies to integrate biosensors in a microfluidic platform with sophisticated on-chip fluidic channels, chamber, and valves. What is the motivation of such efforts? The microfluidic environment creates a short sample-to-sensor distance positioning analyte molecules in close proximity to receptors on the sensor surface. It reduces the time required for the molecules to reach the sensor receptors by diffusion. The small volume of the microfluidic environment generates strong convection at a small sample flow rate. The coupling of diffusion and convection in the microfluidic volume enhances analyte transport, and therefore resulting in efficient sample delivery and sample sparing capabilities for cytokine analysis [96]. In addition, integration of biosensors in a microfluidic platform allows analyte detection to be coupled with several advantageous functions leading to highly efficient sample purification, reagent loading, parallel signal reading, and multiplexed analyte detection. One can find studies synergistically coupling microfluidic integration and miniaturization with label-free biosensing (Fig. 4)
Fig. 4.

Microfluidic integration of label-free biosensors enabling on-chip upstream sample preparation and multiplexed cytokine detection. a. Processes of selectively purifying target biomarker proteins from a whole blood sample using a microfluidic device with capture antibodies immobilized to the device via photocleavable linkers. Reproduced from [35] with permission. Upper left: The valve (red arrow) is open to the waste channel of the empty device before sample loading. Upper right: The antibodies immobilized by the photocleavable linkers selectively capture biomarker proteins from the loaded sample, which is followed by a washing process. Lower left: Ultraviolet irradiation releases the captured proteins with the valve closed. Lower right: The valve is open to the downstream chamber with label-free electrochemical biosensor arrays, and the proteins are detected. b. Multiplexed cytokine detection using silicon microring resonator arrays integrated in a microfluidic system. Reproduced from [38] with permission. c. Multiplexed cytokine detection on a LSPR biosensor-arrayed microfluidic chip. Reproduced from [85] with permission. The microfluidic integration of label-free biosensors in b and c enables massively parallel analysis of multiple cytokine analytes in a rapid manner.
Eliminating the use of labels in assays makes label-free biosensing methods susceptible to false positives resulting from non-specific binding of background biomolecules. This becomes a serious issue for assays involving complex physiological fluidic samples. However, microfluidic integration of label-free biosensors could provide a way to mitigate this problem. For example, Stern et al. [35] demonstrated label-free detection of cancer biomarkers in whole blood using silicon nanoribbon-structured FET biosensors integrated in a microfluidic chip. As described in Section 2.4, operation in a purified buffer solution is highly desirable for reliable operation of FET nano-biosensors. The microfluidic system that the researchers used for their study incorporates a mechanism that first captures the biomarkers from a blood sample loaded to the chip and subsequently releases the analayte molecules by photocleavage of crosslinkers after washing the sample (Fig. 4a). A similar microfluidic analyte purification approach could be also employed for label-free cytokine FET-based biosensing to obtain desirable sensitivity and specificity.
Label-free biosensor integration provides another significant advantage. Recent studies [38, 85] reviewed above have reported that integration of multi-arrayed label-free optical biosensors in a microfluidic system enables researchers to perform parallel detection of multiple cytokine species (Fig. 4b and Fig. 4c). In this case, the whole chip system may incorporate microfluidic detection channel arrays, each integrating optical biosensors constructed in an array form, and allow for high-throughput, duplicated, multiplexed measurements of cytokines in a small-volume sample solution. The parallel analyte detection capability enables researchers to probe the complex dynamics of the immune system by simultaneously monitoring the time-course concentration variations of different cytokine species. The high-throughput, duplicated measurements can obtain much information from a single sample with a large set of data. The large data set enables analysis with a high level of statistical confidence while reducing false-positive readouts resulting from assay noise.
3.2 label-free microfluidic cytokine secretion assay: potential key to rapid, comprehensive immunofunctional analysis
Cytokine secretion assay provides an approach to probing the immune response during the anti-inflammatory phase occurring after systemic inflammation. Involving immune cell isolation, stimulation, and culture, followed by detection of cell-secreted cytokines, this assay offers a comprehensive picture of immunity based on cellular functional phenotypes. At the laboratory level, researchers usually employ enzyme-linked immunosorbent spot (ELISpot) [97, 98] to quantify extracellular cytokine production as the standard technique. Despite its multiplexing power and high sensitivity (~1 pg/mL), the need for the multi-step procedure makes this method highly laborious and time-consuming (~3 days), normally prohibiting its utility in rapid immune status monitoring for prognostic purposes in clinical care. Measurement of cytokines in cell culture medium using label-free biosensors holds potential to simplify and accelerate the assay procedure of this method. Once the anti-inflammatory condition is identified, the host’s immune activity could be restored to its normal status by using immune enhancing agents, such as granulocyte colony-stimulating factor (GM-CSF), to prevent secondary infection leading to mortality. Indeed, cytokine secretion assay is a good example that would enjoy technological merits brought by synergistic integration of label-free biosensors in a microfluidic platform.
Specifically, biosensing can be performed together with on-chip isolation and confinement of cells of interest under a microfluidic environment. Studies by Revzin’s group well illustrate these merits. The group integrated the apatmer-based amperometric sensing biosensors described in Section 2.4 in close vicinity to immune cells (e.g, CD4 cells and monocytes) trapped within a microfluidic chamber. Using this approach, they demonstrated continuous monitoring of cellular IFN-γ and TNF-α secretion [99, 100] and simultaneously detected cell-secreted IFN-γ and TNF-α in a multiplexed configuration [101, 102].
Fig. 5 shows several examples of integrated microfluidics enabling on-chip cell isolation, enrichment and confinement to achieve cell-based cytokine secretion assay. Huang et al. [103] developed a microfluidic immunophenotying assay (MIPA) device incorporating a surface-micromachined porous PDMS micromembrane for THP-1 (human monocytic cell line) cells trapping and enrichment (Fig. 5a). The transparent PDMS micromembrane provides optical access that enables on-chip cell enumeration to analyze the population of the trapped cells. The authors then used this platform to perform in-situ cell endotoxin stimulation, cell culture, and cytokine secretion measurement using a homogenous immunoassay technique. The same research group extended a similar microfluidic approach to label-free cytokine secretion assay using immune cell subpopulations isolated from whole blood (Fig. 5b) [104]. In this study, 15 μm-diameter polystyrene microbeads specifically conjugated with CD45 immune cells were mechanically trapped by high-density PDMS micropillar arrays in a microfluidic chamber.
Fig. 5.

Integrated microfluidics enabling on-chip cell isolation, enrichment and confinement to achieve cell-based cytokine secretion assay. a. Schematic of a microfluidic immunophenotying assay (MIPA) device with a PDMS micromembrane to achieve on-chip isolation and enrichment of THP-1 cells. Reproduced from [103] with permission. b. A microfluidic platform to achieve label-free cytokine secretion assay using an integrated LSPR biosensor. Endotoxin-stimulated target white blood cells are conjugated by microbeads and mechanically trapped by micropillar arrays of the device for their cytokine secretion analysis. Reproduced from [104] with permission. c. A microfluidic device with a PDMS valve structure actuated by a vacuum pump for cell incubation and electrochemical detection of cell-secreted cytokines in an enclosed microenvironment. Reproduced from [105] with permission. The time-variation amperometric signal plot for IFN-γ detection shows that the microfluidic device can continuously monitor cellular cytokine secretion dynamics. Reproduced from [101] with permission. d. A similar microfluidic device with upstream and downstream microchambers is used to study cytokine-mediated cellular communications. Reproduced from [100] with permission.
Gao et al. [105] developed a microfluidic device with a vacuum-actuatable PDMS valve structure that creates an enclosed microenvironment for CD4 T-cell incubation and label-free detection of cell-secreted cytokines. With the PDMS valve opened, cell-secreted cytokines diffused and became bound to aptamers immobilized on an electrode at the center of the chamber (Fig. 5c). A similar microfluidic design was also be utilized by the same group for continuous monitoring of both IFN-γ and TNF-α secreted by T-cells [101] and of intercellular communications (Fig. 5d) [100]. In the latter experiment, they created two serially connected microfluidic chambers, each providing an enclosed microenvironment. The upstream chamber contained mitogen-activated monocytes while the downstream chamber had quiescent monocytes. Once TNF-α secreted by the upstream monocytes accumulated to an adequate level, the PDMS valve structure was opened to allow TNF-α diffusion, which activate downstream quiescent monocytes for TNF-α secretion.
The physical confinement of cells in an enclosed microenvironment is particularly advantageous for label-free biosensing with limited sensitivity. The small volume of the microenvironment results in enhanced concentration of cell-secreted cytokines. This effectively compensates for the biosensor sensitivity. Continuous monitoring of cellular cytokine secretion enabled by label-free biosensors integrated in a microfluidic system allow for measuring the cytokine secretion rate of confined cells. The measured cytokine secretion rate may serve as another important indicator of immune activity and facilitate development of a predictive model showing how the immune system will respond to secondary infection. Extracting the secretion rate from the initial slope of the cytokine production curve could eliminate the need for a long incubation time to analyze the cellular immune response
4 Current challenges and future directions
Our review reveals several challenges facing the current label-free biosensors towards their full translation to critical care based on personalized medicine. First, simultaneously achieving sufficient sensitivity and speed poses a significant challenge.
Fig. 2 indicates that a majority of the current label-free biosensors requires assay time at least 30–60 min for the analyte concentration of a few pg/mL. Such characteristic is governed by the analyte diffusion, association, and dissociation rates based on Langmuir isotherm across all the sensing modalities reviewed. It is not feasible to achieve a more rapid measurement than predicted by theory while maintaining relatively high sensitivity in the diffusion-based sensing scheme. However, the theoretical upper bound for sensor speed could be pushed down by exerting external forces (i.e. shear flow [106] and electrokinetic force [107]) to reduce the analyte depletion zone near the sensor surface. This approach favors biosensors with extraordinary miniaturization capability, which can be readily integrated with micro/nano sized fluidic channels and electrodes. Benefiting from modern nanotechnology and nanomanufacturing, nanowire FET and nanoplasmonic LSPR biosensors fit right into this category. Successful integration of nano-engineered biosensors in a microfluidic platform could improve the speed of sensor response after sample loading and provide other capabilities, including upstream on-chip sample preparation, fine controlled sample handling and sparing, and multiplexed analyte detection. The increased sensing speed can significantly shorten the overall assay time especially for measurements requiring immediate answers in the clinical setting discussed in this review.
Our review also finds that another possible approach to achieve a rapid turn-around assay is to continuously monitor the label-free biosensor response upon analyte binding for an arbitrarily determined assay duration (i.e. <5 min) during which the sensor system never reaches binding equilibrium. The analyte concentration may be measured from the initial slope of the sensor response curve upon sample introduction [38]. This methodology sacrifices the sensor dynamic range at lower concentrations where the sensor response cannot be clearly observed in such a short period of time. The initial sensor response detection under the non-equilibrium low-concentration state would require ultra-sensitive biosensors that optimally afford single- molecular detection in real time. As illustrated in section 2.7 and Fig. 3, the surface binding sites (Bn) and the minimum detectable sensor response upon analyte binding (NLod) determines the sensitivity of label-free biosensors. The former (Bn) is mainly dependent on the antibody density and the sensor surface-to-volume ratio. The latter (NLod) relies mostly on the intrinsic properties of the sensor, which are severely affected by the non-specific interactions especially for sensor operation in a complex clinical sample. However, we find that recent progress on biochemistry [108] has been made to develop reliable schemes for molecular immobilization yielding increased antibody surface coverage density. Proper surface biofunctionalization can also lead to enhanced sensitivity by reducing background noise due to non-specific interactions of the biomolecules. Together with this, novel nanofabrication and nanomaterial patterning techniques may produce nanosturctured surfaces with rough inhomogenous features [109], self-assembly monolayer [108], or, parallelly patterned nanosensors [85]. These nanostructured surfaces will further enhance the sensitivity of label-free biosensors based on any transduction modality with a high surface-to-volume ratio.
Besides the intrinsic properties of the sensor itself, the antigen-antibody binding affinity is another factor that limits the label-free biosensor performance as shown in Eq. 2 and Fig. 3. Generally, the equilibrium dissociation constants of cytokine-antibody complexes fall in the range between 10−10 M to 10−9 M, which keeps the LOD of most of the current label-free biosensors above the pg/mL level for cytokine detection. Thus, replacing the current antibodies with new species showing higher binding affinity and specificity could gear up the label-free biosensors towards a new level of sensing performance meeting clinical needs.
The second challenge lies in realizing multiplexing capability for label-free biosensors without increasing complexity in their operations. Continued progress in fundamental clinical discovery and patient care critically hinges on the availability of specific, reliable assay systems capable of multiplexed detection from a single sample [110–112]. Modern clinical treatments require techniques that can screen multiple protein biomarkers in order to accurately diagnose patients’ diseased conditions. For example, cytokines secreted by T-cells, such as TNF-α, IFN-γ, IL-6, IL-10, and so forth are known to correlate with positive or negative disease outcomes [113]. Thus, development of a reliable multiplexed biosensing technique permitting simultaneous detection of these cytokines is needed to provide discriminating power for diagnostic methods based on immune cell function analysis. This principle also applies to personalized treatments of systemic inflammatory disorders. Yet, only a handful of studies reviewed here have addressed this challenge so far. Optical and plasmonic biosensors appear to be the most promising candidate to achieve high multiplexity when their detection schemes are based on easy-to-implement free space optics requiring no waveguide- or prism-based light coupling. High-multiplexity detection would become more challenging for electrochemical biosensors. Future research needs to develop methods to integrate arrayed structures of these sensors with a large number of electrodes and wires on a single platform for signal reading. A similar challenge will arise for system integration of mechanical biosensors to achieve multiplexed detection whether their signal reading employs an optical or mechanical method. Once these challenges are properly addressed with development of low-cost device packaging schemes and user-friendly signal-reading instruments, these label-free biosensors would undoubtedly become much more powerful diagnostic platforms in terms of sample handling, throughput, speed, and cost effectiveness as compared to the conventional ELISA method, which will surely facilitate the wider use of such biosensors for future immune monitoring.
5 Conclusions
In this review, we have performed a comparative study with the aim to answer the following question: Do label-free biosensors enable personalized immunomodulatory therapy for systemic inflammatory diseases? The original rationale for our study of these biosensors is that the less laborious nature of assays employing label-free biosensors would have the potential to bring rapid cytokine-based immune status monitoring capabilities to the therapy. Real-time monitoring of the time-varying condition of the immune system may allow for tailoring the delivery of anti-cytokine drugs to the afflicted host with a clear picture of the cytokine-mediated immune response. Of course, the answer to the key question above is different for each device. Among those reviewed so far, biosensors based on FET nanowires and LSPR metallic nanoparticles show the greatest promise to meet the criteria with their practicality and device features simultaneously achieving the sensitivity and speed. But a majority of reported biosensors would still find difficulty with meeting the stringent requirements. It remains to be seen whether some of their existing shortcomings, such as insufficient response speed, low sensitivity, lack of multiplexed detection capability, and susceptivity to background noise in a complex physiological fluid, will be overcome or whether the technology will become mature and make the devices user-friendly enough to be adopted in a real clinical setting. We find potential solutions to these problems in microfluidic biosensor integration, readily implementable sensor signal acquisition (e.g. CMOS-compatible electronic signal reading and free space optics-based detection), sensor surface nanoengineering, and high-affinity receptor design. Furthermore, the integration of biosensors in a microfluidic platform significantly facilities cell-based immunofunctional analysis based on cytokine secretion assay. Rapid analysis of the cytokine secretion behaviors of immune cell subpopulations may provide the means to predict the immune response of a host in a comprehensive and timely manner. While there are still many challenges lying ahead, we believe that the continued development of label-free biosensing technology will provide a powerful tool for immune status monitoring and pave the way to personalized medicine treating systemic inflammatory disorders in the future.
Acknowledgments
This study was supported by the National Science Foundation (Grant No. CBET 1263889), the National Institute of Health (R01 HL119542-01A1), the Coulter Foundation, and the University of Michigan Office of Research (Faculty Seed Funds Program). The content is solely the responsibility of the authors and does not necessarily represent the official views of the National Science Foundation or the National Institute of Health.
Footnotes
Publisher's Disclaimer: This is a PDF file of an unedited manuscript that has been accepted for publication. As a service to our customers we are providing this early version of the manuscript. The manuscript will undergo copyediting, typesetting, and review of the resulting proof before it is published in its final citable form. Please note that during the production process errors may be discovered which could affect the content, and all legal disclaimers that apply to the journal pertain.
References
- 1.Meager T. The Molecular Biology of Cytokines. John Wiley & Sons; New York, NY: 1998. [Google Scholar]
- 2.Thompson AW, Lotze MT. The Cytokine Handbook. 4. Academic Press; Amsterdam, Netherlands: 2003. [Google Scholar]
- 3.Dinarello CA. Historical insights into cytokines. European Journal of Immunology. 2007 doi: 10.1002/eji.200737772. [DOI] [PMC free article] [PubMed] [Google Scholar]
- 4.Schulte W, Bernhagen J, Bucala R. Cytokines in Sepsis: Potent Immunoregulators and Potential Therapeutic Targets-An Updated View. Mediators of Inflammation. 2013 doi: 10.1155/2013/165974. [DOI] [PMC free article] [PubMed] [Google Scholar]
- 5.Pai M, Riley LW, Colford JM. Interferonn assays-gamma in the immunodiagnosis of tuberculosis: a systematic review. Lancet Infectious Diseases. 2004;4:761–776. doi: 10.1016/S1473-3099(04)01206-X. [DOI] [PubMed] [Google Scholar]
- 6.Lin CY, Roberts GW, Kift-Morgan A, Donovan KL, Topley N, Eberl M. Pathogen-Specific Local Immune Fingerprints Diagnose Bacterial Infection in Peritoneal Dialysis Patients. Journal of the American Society of Nephrology. 2013;24:2002–2009. doi: 10.1681/ASN.2013040332. [DOI] [PMC free article] [PubMed] [Google Scholar]
- 7.Payen D, Monneret G, Hotchkiss R. Immunotherapy - a potential new way forward in the treatment of sepsis. Crit Care. 2013;17 doi: 10.1186/cc12490. [DOI] [PMC free article] [PubMed] [Google Scholar]
- 8.Rosenberg SA, Yang JC, Restifo NP. Cancer immunotherapy: moving beyond current vaccines. Nat Med. 2004;10:909–915. doi: 10.1038/nm1100. [DOI] [PMC free article] [PubMed] [Google Scholar]
- 9.Ludewig B, Ochsenbein AF, Odermatt B, Paulin D, Hengartner H, Zinkernagel RM. Immunotherapy with dendritic cells directed against tumor antigens shared with normal host cells results in severe autoimmune disease. J Exp Med. 2000;191:795–803. doi: 10.1084/jem.191.5.795. [DOI] [PMC free article] [PubMed] [Google Scholar]
- 10.Valenta R. The future of antigen-specific immunotherapy of allergy. Nature Reviews Immunology. 2002;2:446–453. doi: 10.1038/nri824. [DOI] [PubMed] [Google Scholar]
- 11.Targan SR, Hanauer SB, vanDeventer SJH, Mayer L, Present DH, Braakman T, DeWoody KL, Schaible TF, Rutgeerts PJ. A short-term study of chimeric monoclonal antibody cA2 to tumor necrosis factor alpha for Crohn’s disease. New England Journal of Medicine. 1997;337:1029–1035. doi: 10.1056/NEJM199710093371502. [DOI] [PubMed] [Google Scholar]
- 12.Siebert S, Tsoukas A, Robertson J, McInnes I. Cytokines as Therapeutic Targets in Rheumatoid Arthritis and Other Inflammatory Diseases. Pharmacological Reviews. 2015;67:280–309. doi: 10.1124/pr.114.009639. [DOI] [PubMed] [Google Scholar]
- 13.Bienvenu J, Monneret G, Fabien N, Revillard JP. The clinical usefulness of the measurement of cytokines. Clinical Chemistry and Laboratory Medicine. 2000;38:267–285. doi: 10.1515/CCLM.2000.040. [DOI] [PubMed] [Google Scholar]
- 14.de Jager W, te Velthuis H, Prakken BJ, Kuis W, Rijkers GT. Simultaneous detection of 15 human cytokines in a single sample of stimulated peripheral blood mononuclear cells. Clin Diagn Lab Immunol. 2003;10:133–139. doi: 10.1128/CDLI.10.1.133-139.2003. [DOI] [PMC free article] [PubMed] [Google Scholar]
- 15.Gentile LF, Cuenca AG, Efron PA, Ang D, Bihorac A, McKinley BA, Moldawer LL, Moore FA. Persistent inflammation and immunosuppression: A common syndrome and new horizon for surgical intensive care. Journal of Trauma and Acute Care Surgery. 2012;72:1491–1501. doi: 10.1097/TA.0b013e318256e000. [DOI] [PMC free article] [PubMed] [Google Scholar]
- 16.Kanthor R. DIAGNOSTICS Detection drives defence. Nature. 2014;509:S14–S15. doi: 10.1038/509S14a. [DOI] [PubMed] [Google Scholar]
- 17.Abraham E. Why immunomodulatory therapies have not worked in sepsis. Intensive Care Medicine. 1999;25:556–566. doi: 10.1007/s001340050903. [DOI] [PubMed] [Google Scholar]
- 18.Kox WJ, Volk T, Kox SN, Volk HD. Immunomodulatory therapies in sepsis. Intensive Care Medicine. 2000;26:S124–S128. doi: 10.1007/s001340051129. [DOI] [PubMed] [Google Scholar]
- 19.Osuchowski MF, Connett J, Welch K, Granger J, Remick DG. Stratification is the key: Inflammatory biomarkers accurately direct immunomodulatory therapy in experimental sepsis. Critical Care Medicine. 2009;37:1567–1573. doi: 10.1097/CCM.0b013e31819df06b. [DOI] [PMC free article] [PubMed] [Google Scholar]
- 20.Fink MP, Warren HS. Strategies to improve drug development for sepsis. Nature Reviews Drug Discovery. 2014;13:741–758. doi: 10.1038/nrd4368. [DOI] [PubMed] [Google Scholar]
- 21.Wong HR, Weiss SL, Giuliano JS, Wainwright MS, Cvijanovich NZ, Thomas NJ, Allen GL, Anas N, Bigham MT, Hall M, Freishtat RJ, Sen A, Meyer K, Checchia PA, Shanley TP, Nowak J, Quasney M, Chopra A, Fitzgerald JC, Gedeit R, Banschbach S, Beckman E, Lahni P, Hart K, Lindsell CJ. Testing the Prognostic Accuracy of the Updated Pediatric Sepsis Biomarker Risk Model. Plos One. 2014;9 doi: 10.1371/journal.pone.0086242. [DOI] [PMC free article] [PubMed] [Google Scholar]
- 22.Behrens F, Kohm M. Personalized medicine in cytokine-targeted therapy. Zeitschrift Fur Rheumatologie. 2013;72:41. doi: 10.1007/s00393-011-0886-3. [DOI] [PubMed] [Google Scholar]
- 23.Stenken JA, Poschenrieder AJ. Bioanalytical chemistry of cytokines - A review. Analytica Chimica Acta. 2015;853:95–115. doi: 10.1016/j.aca.2014.10.009. [DOI] [PMC free article] [PubMed] [Google Scholar]
- 24.Balci C, Sungurtekin H, Gurses E, Sungurtekin U, Kaptanoglu B. Usefulness of procalcitonin for diagnosis of sepsis in the intensive care unit. Critical Care. 2003;7:85–90. doi: 10.1186/cc1843. [DOI] [PMC free article] [PubMed] [Google Scholar]
- 25.Chartuprayoon N, Zhang ML, Bosze W, Choa YH, Myung NV. One-dimensional nanostructures based bio-detection. Biosensors & Bioelectronics. 2015;63:432–443. doi: 10.1016/j.bios.2014.07.043. [DOI] [PubMed] [Google Scholar]
- 26.Arya SK, Saha S, Ramirez-Vick JE, Gupta V, Bhansali S, Singh SP. Recent advances in ZnO nanostructures and thin films for biosensor applications: Review. Analytica Chimica Acta. 2012;737:1–21. doi: 10.1016/j.aca.2012.05.048. [DOI] [PubMed] [Google Scholar]
- 27.Barrios CA. Optical Slot-Waveguide Based Biochemical Sensors. Sensors. 2009;9:4751–4765. doi: 10.3390/s90604751. [DOI] [PMC free article] [PubMed] [Google Scholar]
- 28.Deckert-Gaudig T, Bailo E, Deckert V. Perspectives for spatially resolved molecular spectroscopy - Raman on the nanometer scale. Journal of Biophotonics. 2008;1:377–389. doi: 10.1002/jbio.200810019. [DOI] [PubMed] [Google Scholar]
- 29.Sepulveda B, Angelome PC, Lechuga LM, Liz-Marzan LM. LSPR-based nanobiosensors. Nano Today. 2009;4:244–251. [Google Scholar]
- 30.Baker JE, Sriram R, Miller BL. Two-dimensional photonic crystals for sensitive microscale chemical and biochemical sensing. Lab on a Chip. 2015;15:971–990. doi: 10.1039/c4lc01208a. [DOI] [PMC free article] [PubMed] [Google Scholar]
- 31.Ping JF, Zhou YB, Wu YY, Papper V, Boujday S, Marks RS, Steele TWJ. Recent advances in aptasensors based on graphene and graphene-like nanomaterials. Biosensors & Bioelectronics. 2015;64:373–385. doi: 10.1016/j.bios.2014.08.090. [DOI] [PubMed] [Google Scholar]
- 32.Arntz Y, Seelig JD, Lang HP, Zhang J, Hunziker P, Ramseyer JP, Meyer E, Hegner M, Gerber C. Label-free protein assay based on a nanomechanical cantilever array. Nanotechnology. 2003;14:86–90. [Google Scholar]
- 33.Arlett JL, Myers EB, Roukes ML. Comparative advantages of mechanical biosensors. Nature Nanotechnology. 2011;6:203–215. doi: 10.1038/nnano.2011.44. [DOI] [PMC free article] [PubMed] [Google Scholar]
- 34.Kelley SO, Mirkin CA, Walt DR, Ismagilov RF, Toner M, Sargent EH. Advancing the speed, sensitivity and accuracy of biomolecular detection using multi-length-scale engineering. Nature Nanotechnology. 2014;9:969–980. doi: 10.1038/nnano.2014.261. [DOI] [PMC free article] [PubMed] [Google Scholar]
- 35.Stern E, Vacic A, Rajan NK, Criscione JM, Park J, Ilic BR, Mooney DJ, Reed MA, Fahmy TM. Label-free biomarker detection from whole blood. Nature Nanotechnology. 2010;5:138–142. doi: 10.1038/nnano.2009.353. [DOI] [PMC free article] [PubMed] [Google Scholar]
- 36.Qavi AJ, Washburn AL, Byeon JY, Bailey RC. Label-free technologies for quantitative multiparameter biological analysis. Analytical and Bioanalytical Chemistry. 2009;394:121–135. doi: 10.1007/s00216-009-2637-8. [DOI] [PMC free article] [PubMed] [Google Scholar]
- 37.Hunt HK, Armani AM. Label-free biological and chemical sensors. Nanoscale. 2010;2:1544–1559. doi: 10.1039/c0nr00201a. [DOI] [PubMed] [Google Scholar]
- 38.Luchansky MS, Bailey RC. Rapid, Multiparameter Profiling of Cellular Secretion Using Silicon Photonic Microring Resonator Arrays. Journal of the American Chemical Society. 2011;133:20500–20506. doi: 10.1021/ja2087618. [DOI] [PMC free article] [PubMed] [Google Scholar]
- 39.Drake AW, Myszka DG, Klakamp SL. Characterizing high affinity antigen/antibody complexes by kinetic- and equilibrium based methods. Analytial Biochemistry. 2004;328:35–43. doi: 10.1016/j.ab.2003.12.025. [DOI] [PubMed] [Google Scholar]
- 40.Fechner P, Bleher O, Ewald M, Freudenberger K, Furin D, Hilbig U, Kolarov F, Krieg K, Leidner L, Markovic G, Proll G, Proll F, Rau S, Riedt J, Schwarz B, Weber P, Widmaier J. Size does matter! Label-free detection of small molecule-protein interaction. Analytical and Bioanalytical Chemistry. 2014;406:4033–4051. doi: 10.1007/s00216-014-7834-4. [DOI] [PubMed] [Google Scholar]
- 41.Wu GH, Datar RH, Hansen KM, Thundat T, Cote RJ, Majumdar A. Bioassay of prostate-specific antigen (PSA) using microcantilevers. Nature Biotechnology. 2001;19:856–860. doi: 10.1038/nbt0901-856. [DOI] [PubMed] [Google Scholar]
- 42.Dutta P, Sanseverino J, Datskos PG, Sepaniak MJ. Nanostructured Cantilevers as Nanomechanical Immunosensors for Cytokine Detection. Nano Biotechnology. 2005;1:237–244. [Google Scholar]
- 43.van den Hurk R, Evoy S. Deflection cantilever detection of interferon gamma. Sensors and Actuators B-Chemical. 2013;176:960–965. [Google Scholar]
- 44.Krishnamoorthy S, Iliadis AA, Bei T, Chrousos GP. An interleukin-6 ZnO/SiO2/Si surface acoustic wave biosensor. Biosensors & Bioelectronics. 2008;24:313–318. doi: 10.1016/j.bios.2008.04.011. [DOI] [PubMed] [Google Scholar]
- 45.Bahk YK, Kim HH, Park DS, Chang SC, Go JS. A New Concept for Efficient Sensitivity Amplification of a QCM Based Immunosensor for TNF-alpha by Using Modified Magnetic Particles under Applied Magnetic Field. Bulletin of the Korean Chemical Society. 2011;32:4215–4220. [Google Scholar]
- 46.Lisdat F, Schafer D. The use of electrochemical impedance spectroscopy for biosensing. Analytical and Bioanalytical Chemistry. 2008;391:1555–1567. doi: 10.1007/s00216-008-1970-7. [DOI] [PubMed] [Google Scholar]
- 47.Daniels JS, Pourmand N. Label-free impedance biosensors: Opportunities and challenges. Electroanalysis. 2007;19:1239–1257. doi: 10.1002/elan.200603855. [DOI] [PMC free article] [PubMed] [Google Scholar]
- 48.Kongsuphol P, Ng HH, Pursey JP, Arya SK, Wong CC, Stulz E, Park MK. EIS-based biosensor for ultra-sensitive detection of TNF-alpha from non-diluted human serum. Biosensors & Bioelectronics. 2014;61:274–279. doi: 10.1016/j.bios.2014.05.017. [DOI] [PubMed] [Google Scholar]
- 49.Pui TS, Kongsuphol P, Arya SK, Bansal T. Detection of tumor necrosis factor (TNF-alpha) in cell culture medium with label free electrochemical impedance spectroscopy. Sensors and Actuators B-Chemical. 2013;181:494–500. [Google Scholar]
- 50.Liu Y, Tuleouva N, Ramanculov E, Revzin A. Aptamer-Based Electrochemical Biosensor for Interferon Gamma Detection. Analytical Chemistry. 2010;82:8131–8136. doi: 10.1021/ac101409t. [DOI] [PMC free article] [PubMed] [Google Scholar]
- 51.Qureshi A, Niazi JH, Kallempudi S, Gurbuz Y. Label-free capacitive biosensor for sensitive detection of multiple biomarkers using gold interdigitated capacitor arrays. Biosensors & Bioelectronics. 2010;25:2318–2323. doi: 10.1016/j.bios.2010.03.018. [DOI] [PubMed] [Google Scholar]
- 52.Pui TS, Agarwal A, Ye F, Huang YX, Chen P. Nanoelectronic detection of triggered secretion of pro-inflammatory cytokines using CMOS compatible silicon nanowires. Biosensors & Bioelectronics. 2011;26:2746–2750. doi: 10.1016/j.bios.2010.09.059. [DOI] [PubMed] [Google Scholar]
- 53.Hakim MMA, Lombardini M, Sun K, Giustiniano F, Roach PL, Davies DE, Howarth PH, de Planque MRR, Morgan H, Ashburn P. Thin Film Polycrystalline Silicon Nanowire Biosensors. Nano Letters. 2012;12:1868–1872. doi: 10.1021/nl2042276. [DOI] [PubMed] [Google Scholar]
- 54.Daniels Jonathan S, Pourmand N. Label- Free Impedance Biosensors: Opportunities and Challenges. Electroanalysis. 2007;19:1239–1257. doi: 10.1002/elan.200603855. [DOI] [PMC free article] [PubMed] [Google Scholar]
- 55.Dharuman V, Grunwald T, Nebling E, Albers J, Blohm L, Hintsche R. Label-free impedance detection of oligonucleotide hybridisation on interdigitated ultramicroelectrodes using electrochemical redox probes. Biosensors and Bioelectronics. 2005;21:645–654. doi: 10.1016/j.bios.2004.12.020. [DOI] [PubMed] [Google Scholar]
- 56.Yang L, Li Y, Erf GF. Interdigitated Array Microelectrode-Based Electrochemical Impedance Immunosensor for Detection of Escherichia coli O157: H7. Analytical chemistry. 2004;76:1107–1113. doi: 10.1021/ac0352575. [DOI] [PubMed] [Google Scholar]
- 57.Chen KI, Li BR, Chen YT. Silicon nanowire field-effect transistor-based biosensors for biomedical diagnosis and cellular recording investigation. Nano Today. 2011;6:131–154. [Google Scholar]
- 58.Gruner G. Carbon nanotube transistors for biosensing applications. Analytical and bioanalytical chemistry. 2006;384:322–335. doi: 10.1007/s00216-005-3400-4. [DOI] [PubMed] [Google Scholar]
- 59.Katz E, Willner I. Biomolecule-functionalized carbon nanotubes: applications in nanobioelectronics. Chem Phys Chem. 2004;5:1084–1104. doi: 10.1002/cphc.200400193. [DOI] [PubMed] [Google Scholar]
- 60.Shao Y, Wang J, Wu H, Liu J, Aksay IA, Lin Y. Graphene based electrochemical sensors and biosensors: a review. Electroanalysis. 2010;22:1027–1036. [Google Scholar]
- 61.Kuila T, Bose S, Khanra P, Mishra AK, Kim NH, Lee JH. Recent advances in graphene-based biosensors. Biosensors and Bioelectronics. 2011;26:4637–4648. doi: 10.1016/j.bios.2011.05.039. [DOI] [PubMed] [Google Scholar]
- 62.Sarkar D, Liu W, Xie X, Anselmo AC, Mitragotri S, Banerjee K. MoS2 field-effect transistor for next-generation label-free biosensors. Acs Nano. 2014;8:3992–4003. doi: 10.1021/nn5009148. [DOI] [PubMed] [Google Scholar]
- 63.Wang L, Wang Y, Wong JI, Palacios T, Kong J, Yang HY. Functionalized MoS2 Nanosheet- Based Field- Effect Biosensor for Label- Free Sensitive Detection of Cancer Marker Proteins in Solution. Small. 2014;10:1101–1105. doi: 10.1002/smll.201302081. [DOI] [PubMed] [Google Scholar]
- 64.Nam H, Oh B-R, Chen P, Chen M, Wi S, Wan W, Kurabayashi K, Liang X. Multiple MoS2 Transistors for Sensing Molecule Interaction Kinetics. Scientific Reports. 2015;5 doi: 10.1038/srep10546. [DOI] [PMC free article] [PubMed] [Google Scholar]
- 65.Mandal S, Goddard JM, Erickson D. A multiplexed optofluidic biomolecular sensor for low mass detection. Lab on a Chip. 2009;9:2924–2932. doi: 10.1039/b907826f. [DOI] [PubMed] [Google Scholar]
- 66.Choi CJ, Belobraydich AR, Chan LL, Mathias PC, Cunningham BT. Comparison of label-free biosensing in microplate, microfluidic, and spot-based affinity capture assays. Analytical Biochemistry. 2010;405:1–10. doi: 10.1016/j.ab.2010.06.009. [DOI] [PubMed] [Google Scholar]
- 67.Luchansky MS, Bailey RC. Silicon Photonic Microring Resonators for Quantitative Cytokine Detection and T-Cell Secretion Analysis. Analytical Chemistry. 2010;82:1975–1981. doi: 10.1021/ac902725q. [DOI] [PMC free article] [PubMed] [Google Scholar]
- 68.Armani AM, Kulkarni RP, Fraser SE, Flagan RC, Vahala KJ. Label-free, single-molecule detection with optical microcavities. Science. 2007;317:783–787. doi: 10.1126/science.1145002. [DOI] [PubMed] [Google Scholar]
- 69.Arnold S, Shopova SI, Holler S. Whispering gallery mode bio-sensor for label-free detection of single molecules: thermo-optic vs. reactive mechanism. Opt Express. 2010;18:281–287. doi: 10.1364/OE.18.000281. [DOI] [PubMed] [Google Scholar]
- 70.Huckabay HA, Dunn RC. Whispering gallery mode imaging for the multiplexed detection of biomarkers. Sensors and Actuators B-Chemical. 2011;160:1262–1267. [Google Scholar]
- 71.Liedberg B, Nylander C, Lunström I. Surface plasmon resonance for gas detection and biosensing. Sensors and Actuators. 1983;4:299–304. [Google Scholar]
- 72.Homola J. Surface Plasmon Resonance Sensors for Detection of Chemical and Biological Species. Chemical Reviews. 2008;108:462–493. doi: 10.1021/cr068107d. [DOI] [PubMed] [Google Scholar]
- 73.Bolduc OR, Live LS, Masson JF. High-resolution surface plasmon resonance sensors based on a dove prism. Talanta. 2009;77:1680–1687. doi: 10.1016/j.talanta.2008.10.006. [DOI] [PubMed] [Google Scholar]
- 74.Chou TH, Chuang CY, Wu CM. Quantification of Interleukin-6 in cell culture medium using surface plasmon resonance biosensors. Cytokine. 2010;51:107–111. doi: 10.1016/j.cyto.2010.04.004. [DOI] [PubMed] [Google Scholar]
- 75.Martinez-Perdiguero J, Retolaza A, Bujanda L, Merino S. Surface plasmon resonance immunoassay for the detection of the TNFα biomarker in human serum. Talanta. 2014;119:492–497. doi: 10.1016/j.talanta.2013.11.063. [DOI] [PubMed] [Google Scholar]
- 76.Battaglia TM, Masson JF, Sierks MR, Beaudoin SP, Rogers J, Foster KN, Holloway GA, Booksh KS. Quantification of cytokines involved in wound healing using surface plasmon resonance. Analytical Chemistry. 2005;77:7016–7023. doi: 10.1021/ac050568w. [DOI] [PubMed] [Google Scholar]
- 77.Piliarik M, Homola J. Surface plasmon resonance (SPR) sensors: approaching their limits? Opt Express. 2009;17:16505–16517. doi: 10.1364/OE.17.016505. [DOI] [PubMed] [Google Scholar]
- 78.Regatos D, Sepúlveda B, Fariña D, Carrascosa LG, Lechuga LM. Suitable combination of noble/ferromagnetic metal multilayers for enhanced magneto-plasmonic biosensing. Opt Express. 2011;19:8336–8346. doi: 10.1364/OE.19.008336. [DOI] [PubMed] [Google Scholar]
- 79.Slavík R, Homola J. Ultrahigh resolution long range surface plasmon-based sensor. Sensors and Actuators B: Chemical. 2007;123:10–12. [Google Scholar]
- 80.Mariani S, Minunni M. Surface plasmon resonance applications in clinical analysis. Analytical and Bioanalytical Chemistry. 2014;406:2303–2323. doi: 10.1007/s00216-014-7647-5. [DOI] [PMC free article] [PubMed] [Google Scholar]
- 81.Šípová H, Homola J. Surface plasmon resonance sensing of nucleic acids: A review. Analytica Chimica Acta. 2013;773:9–23. doi: 10.1016/j.aca.2012.12.040. [DOI] [PubMed] [Google Scholar]
- 82.Huang T, Nallathamby PD, Xu XHN. Photostable Single-Molecule Nanoparticle Optical Biosensors for Real-Time Sensing of Single Cytokine Molecules and Their Binding Reactions. Journal of the American Chemical Society. 2008;130:17095–17105. doi: 10.1021/ja8068853. [DOI] [PMC free article] [PubMed] [Google Scholar]
- 83.Chiang CY, Hsieh ML, Huang KW, Chau LK, Chang CM, Lyu SR. Fiber-optic particle plasmon resonance sensor for detection of interleukin-1β in synovial fluids. Biosensors and Bioelectronics. 2010;26:1036–1042. doi: 10.1016/j.bios.2010.08.047. [DOI] [PubMed] [Google Scholar]
- 84.Huang YC, Chiang CY, Li CH, Chang TC, Chiang CS, Chau LK, Huang KW, Wu CW, Wang SC, Lyu SR. Quantification of tumor necrosis factor-[small alpha] and matrix metalloproteinases-3 in synovial fluid by a fiber-optic particle plasmon resonance sensor. Analyst. 2013;138:4599–4606. doi: 10.1039/c3an00276d. [DOI] [PubMed] [Google Scholar]
- 85.Chen P, Chung MT, McHugh W, Nidetz R, Li Y, Fu J, Cornell TT, Shanley TP, Kurabayashi K. Multiplex Serum Cytokine Immunoassay Using Nanoplasmonic Biosensor Microarrays. ACS Nano. 2015;9:4173–4181. doi: 10.1021/acsnano.5b00396. [DOI] [PMC free article] [PubMed] [Google Scholar]
- 86.Bai J, Cheng R, Xiu F, Liao L, Wang M, Shailos A, Wang KL, Huang Y, Duan X. Very large magnetoresistance in graphene nanoribbons. Nat Nano. 2010;5:655–659. doi: 10.1038/nnano.2010.154. [DOI] [PMC free article] [PubMed] [Google Scholar]
- 87.Huber F, Lang HP, Gerber C. Nanomechanical sensors: Measuring a response in blood. Nat Nano. 2014;9:165–167. doi: 10.1038/nnano.2014.42. [DOI] [PubMed] [Google Scholar]
- 88.Witzens J, Hochberg M. Optical detection of target molecule induced aggregation of nanoparticles by means of high-Q resonators. Opt Express. 2011;19:7034–7061. doi: 10.1364/OE.19.007034. [DOI] [PubMed] [Google Scholar]
- 89.Dastider SG, Barizuddin S, Dweik M, Almasri M. A micromachined impedance biosensor for accurate and rapid detection of E. coli O157:H7. RSC Advances. 2013;3:26297–26306. [Google Scholar]
- 90.Zhang H, Jiang B, Xiang Y, Chai Y, Yuan R. Label-free and amplified electrochemical detection of cytokine based on hairpin aptamer and catalytic DNAzyme. Analyst. 2012;137:1020–1023. doi: 10.1039/c2an15962g. [DOI] [PubMed] [Google Scholar]
- 91.Helena Bustos R, Suesca E, Millan D, Manuel Gonzalez J, Fontanilla MR. Real-Time Quantification of Proteins Secreted by Artificial Connective Tissue Made from Uni- Or Multidirectional Collagen I Scaffolds and Oral Mucosa Fibroblasts. Analytical Chemistry. 2014;86:2421–2428. doi: 10.1021/ac4033164. [DOI] [PubMed] [Google Scholar]
- 92.Squires TM, Messinger RJ, Manalis SR. Making it stick: convection, reaction and diffusion in surface-based biosensors. Nature biotechnology. 2008;26:417–426. doi: 10.1038/nbt1388. [DOI] [PubMed] [Google Scholar]
- 93.Vered Bronner TB, Lavie Kobi. Rapid and Detailed Analysis of Multiple Antigen-Antibody Pairs Using the ProteOn™ XPR36 Protein Interaction Array System. Bio-Rad bulletin. 2006;5360 [Google Scholar]
- 94.Wang C-W, Kapoor R. Dissociation constant measurement using combination tapered fiber optic biosensor (CTFOB) dip-probes. 2010:75590A-75590A-75594. doi: 10.1117/12.843720. [DOI] [PMC free article] [PubMed] [Google Scholar]
- 95.Medvedev AE, Espevik T, Ranges G, Sundan A. Distinct Roles of the Two Tumor Necrosis Factor (TNF) Receptors in Modulating TNF and Lymphotoxin Effects. Journal of Biological Chemistry. 1996;271:9778–9784. doi: 10.1074/jbc.271.16.9778. [DOI] [PubMed] [Google Scholar]
- 96.Cesaro-Tadic S, Dernick G, Juncker D, Buurman G, Kropshofer H, Michel B, Fattinger C, Delamarche E. High-sensitivity miniaturized immunoassays for tumor necrosis factor a using microfluidic systems. Lab on a Chip. 2004;4:563–569. doi: 10.1039/b408964b. [DOI] [PubMed] [Google Scholar]
- 97.Cox JH, Ferrari G, Janetzki S. Measurement of cytokine release at the single cell level using the ELISPOT assay. Methods. 2006;38:274–282. doi: 10.1016/j.ymeth.2005.11.006. [DOI] [PubMed] [Google Scholar]
- 98.Guerkov RE, Targoni OS, Kreher CR, Boehm BO, Herrera MT, Tary-Lehmann M, Lehmann PV, Schwander SK. Detection of low-frequency antigen-specific IL-10-producing CD4(+) T cells via ELISPOT in PBMC: cognate vs. nonspecific production of the cytokine. J Immunol Methods. 2003;279:111–121. doi: 10.1016/s0022-1759(03)00240-0. [DOI] [PubMed] [Google Scholar]
- 99.Liu Y, Yan J, Howland MC, Kwa T, Revzin A. Micropatterned Aptasensors for Continuous Monitoring of Cytokine Release from Human Leukocytes. Analytical Chemistry. 2011;83:8286–8292. doi: 10.1021/ac202117g. [DOI] [PMC free article] [PubMed] [Google Scholar]
- 100.Kwa T, Zhou Q, Gao YD, Rahimian A, Kwon L, Liu Y, Revzin A. Reconfigurable microfluidics with integrated aptasensors for monitoring intercellular communication. Lab on a Chip. 2014;14:1695–1704. doi: 10.1039/c4lc00037d. [DOI] [PMC free article] [PubMed] [Google Scholar]
- 101.Liu Y, Kwa T, Revzin A. Simultaneous detection of cell-secreted TNF-alpha, and IFN-gamma using micropatterned aptamer-modified electrodes. Biomaterials. 2012;33:7347–7355. doi: 10.1016/j.biomaterials.2012.06.089. [DOI] [PMC free article] [PubMed] [Google Scholar]
- 102.Liu Y, Matharu Z, Rahimian A, Revzin A. Detecting multiple cell-secreted cytokines from the same aptamer-functionalized electrode. Biosensors & Bioelectronics. 2015;64:43–50. doi: 10.1016/j.bios.2014.08.034. [DOI] [PubMed] [Google Scholar]
- 103.Huang NT, Chen WQ, Oh BR, Cornell TT, Shanley TP, Fu JP, Kurabayashi K. An integrated microfluidic platform for in situ cellular cytokine secretion immunophenotyping. Lab on a Chip. 2012;12:4093–4101. doi: 10.1039/c2lc40619e. [DOI] [PMC free article] [PubMed] [Google Scholar]
- 104.Oh BR, Huang NT, Chen WQ, Seo JH, Chen PY, Cornell TT, Shanley TP, Fu JP, Kurabayashi K. Integrated Nanoplasmonic Sensing for Cellular Functional Immunoanalysis Using Human Blood. Acs Nano. 2014;8:2667–2676. doi: 10.1021/nn406370u. [DOI] [PMC free article] [PubMed] [Google Scholar]
- 105.Gao YD, Zhou Q, Matharu Z, Liu Y, Kwa T, Revzin A. A mathematical method for extracting cell secretion rate from affinity biosensors continuously monitoring cell activity. Biomicrofluidics. 2014;8 doi: 10.1063/1.4874216. [DOI] [PMC free article] [PubMed] [Google Scholar]
- 106.Lynn NS, Sipova H, Adam P, Homola J. Enhancement of affinity-based biosensors: effect of sensing chamber geometry on sensitivity. Lab on a Chip. 2013;13:1413–1421. doi: 10.1039/c2lc41184a. [DOI] [PubMed] [Google Scholar]
- 107.Gong J-R. Label-Free Attomolar Detection of Proteins Using Integrated Nanoelectronic and Electrokinetic Devices. Small. 2010;6:967–973. doi: 10.1002/smll.200902132. [DOI] [PubMed] [Google Scholar]
- 108.Bolduc OR, Pelletier JN, Masson JF. SPR Biosensing in Crude Serum Using Ultralow Fouling Binary Patterned Peptide SAM. Analytical Chemistry. 2010;82:3699–3706. doi: 10.1021/ac100035s. [DOI] [PubMed] [Google Scholar]
- 109.Soleymani L, Fang Z, Lam B, Bin X, Vasilyeva E, Ross AJ, Sargent EH, Kelley SO. Hierarchical Nanotextured Microelectrodes Overcome the Molecular Transport Barrier To Achieve Rapid, Direct Bacterial Detection. ACS Nano. 2011;5:3360–3366. doi: 10.1021/nn200586s. [DOI] [PubMed] [Google Scholar]
- 110.Vreeland WN, Meagher RJ, Barron AE. Multiplexed, high-throughput genotyping by single-base extension and end-labeled free-solution electrophoresis. Analytical Chemistry. 2002;74:4328–4333. doi: 10.1021/ac0258094. [DOI] [PubMed] [Google Scholar]
- 111.Johnson SC, Marshall DJ, Harms G, Miller CM, Sherrill CB, Beaty EL, Lederer SA, Roesch EB, Madsen G, Hoffman GL, Laessig RH, Kopish GJ, Baker MW, Benner SA, Farrell PM, Prudent JR. Multiplexed genetic analysis using an expanded genetic alphabet. Clinical Chemistry. 2004;50:2019–2027. doi: 10.1373/clinchem.2004.034330. [DOI] [PMC free article] [PubMed] [Google Scholar]
- 112.Pregibon DC, Toner M, Doyle PS. Multifunctional encoded particles for high-throughput biomolecule analysis. Science. 2007;315:1393–1396. doi: 10.1126/science.1134929. [DOI] [PubMed] [Google Scholar]
- 113.Ma C, Fan R, Ahmad H, Shi QH, Comin-Anduix B, Chodon T, Koya RC, Liu CC, Kwong GA, Radu CG, Ribas A, Heath JR. A clinical microchip for evaluation of single immune cells reveals high functional heterogeneity in phenotypically similar T cells. Nat Med. 2011;17:738–U133. doi: 10.1038/nm.2375. [DOI] [PMC free article] [PubMed] [Google Scholar]